

Abstract
Biodegradable polymer scaffolds can be used to deliver soluble factors to enhance osseous remodeling in bone defects. To this end, we designed a poly(lactic-co-glycolic acid) (PLAGA) microsphere scaffold to sustain the release of FTY720, a selective agonist for sphingosine 1-phosphate (S1P) receptors. The microsphere scaffolds were created from fast degrading 50:50 PLAGA and/or from slow-degrading 85:15 PLAGA. Temporal and spatial regulation of bone remodeling depended on the use of appropriate scaffolds for drug delivery. The release profiles from the scaffolds were used to design an optimal delivery system to treat critical size cranial defects in a rodent model. The ability of local FTY720 delivery to maximize bone regeneration was evaluated with microcomputed tomography (microCT) and histology. Following 4 weeks of defect healing, FTY720 delivery from 85:15 PLAGA scaffolds resulted in a significant increase in bone volumes in the defect region compared to the controls. 85:15 microsphere scaffolds maintain their structural integrity over a longer period of time, and cause an initial burst release of FTY720 due to surface localization of the drug. This encourages cellular in-growth and an increase in new bone formation.
Keywords: Bone tissue engineering, Drug delivery, Biodegradable polymer scaffolds
Introduction
The regeneration of traumatized or damaged bone is an increasingly significant clinical problem in the US and around the world. Reconstructive surgery to treat bone loss commonly employs a cancellous bone autograft transplant, which is considered the “gold standard” material due to its excellent biocompatibility and ability to stimulate new bone growth and remodeling. However, several limitations such as expense, trauma to the patient, and limited availability, necessitate the use of alternative implant materials. Though engineered bone and local delivery of growth factors have been viewed as alternative solutions, they present many challenges such as defect site vascularization, high costs, short shelf life and lack of long-term stability1. Bone morphogenic proteins (BMPs) in the TGF-β superfamily of differentiation factors have received special attention as an alternative or adjuvant to current strategies. Unfortunately, the use of BMP-2, a FDA approved therapy, is being questioned due to skepticism regarding the supra-physiological delivery dose and possible adverse effects 2,3.
Sphingosine 1-phosphate (S1P) is a bioactive lipid that is a ligand for five known G protein-coupled receptors, S1P1-5.4 S1P receptor signaling is involved in the migration and proliferation of endothelial cells, smooth muscle cells, and lymphocytes.5,6 Local delivery of S1P and S1P receptor-targeted drugs was shown to enhance the formation and maturation of nascent blood vessels in a murine skinfold window chamber model, through the recruitment of endothelial and smooth muscle cells.5–7 S1P receptor signaling also affects the migration of osteoblast precursors8 and osteoclast progenitor cells.9 The sustained release of S1P and S1P receptor-targeted compounds from biodegradable polymer scaffolds has been shown to enhance bone regeneration in critical-size cranial defects.10
The activation of S1P1 and S1P3, with the sustained delivery of FTY720, was shown to provide the greatest enhancement of bone regeneration in the defect space. FTY720 is phosphorylated in vivo primarily by sphingosine kinase 2 to FTY720 phosphate (FTY720-P), which acts as an agonist for S1P1 and S1P3, as well as S1P4 and S1P5.7,11,12 The delivery of FTY720 also enhanced neovascularization in the original defect space, while decreasing the amount of inflammatory cells. However, the distribution and release kinetics of sphingolipids from polymer scaffolds has not been characterized.
Being a small molecule drug, FTY720 is more stable and has a longer half-life than many growth factors that are candidates for clinical applications. In the current study, we determine the effect of the release kinetics of FTY720 in bone regeneration in a critical-size rat cranial defect. The release kinetics of therapeutic agents from biodegradable polymer scaffolds are affected by several factors, including polymer degradation rate and the distribution of the drug in the polymer scaffold.13–16 The degradation rate of poly (lactic-co-glycolic acid) (PLAGA) can be tuned by varying the molecular weight, end functional groups, and lactic/glycolic acid ratio.17 Temporal and spatial regulation of bone remodeling was achieved by delivering FTY720 from PLAGA microsphere scaffolds composed of both a relatively fast-degrading 50:50 PLAGA (1–2 month degradation timeframe), and a slow-degrading 85:15 PLAGA (5–6 month degradation timeframe). FTY720 release profiles from each polymer were obtained in order to tailor a delivery strategy that maximally enhances bone regeneration in critical size cranial defects.
Methods and Materials
Materials
85:15 PLAGA (8515 DLG 7E, Mw = 109 kDa) and 50:50 PLAGA (5050 DLG 5E, Mw = 65 kDa), were purchased from Lakeshore Biomaterials (Birmingham, AL). FTY720 was purchased from Cayman Chemical (Ann Arbor, MI). Methanol, and methylene chloride (MeCl2) were purchased from Fisher Scientific (Pittsburgh, PA). Dimethyl formamide was purchased from Avantor Performance Materials (Central Valley, PA). Poly (vinyl alcohol) (PVA) and formic acid were purchased from Sigma-Aldrich (St. Louis, MO). All were used as received.
Fabrication of microsphere scaffolds
FTY720-loaded microspheres were fabricated using a single emulsion method. Briefly, FTY720 and PLAGA (1:200 mass ratio) were dissolved in MeCl2 by sonication, with the resulting solution at 20% polymer (w/w). The organic solution was then slowly ejected into a 1% aqueous PVA (w/v) solution stirring at 500 rpm. After stirring overnight, the microspheres were collected by filtration, and dried under reduced pressure for 24 hours. The microspheres were then sieved, and only spheres with diameters < 300 μm were used for the study. Unloaded PLAGA microspheres were prepared in a similar way, but without the addition of FTY720.
Microspheres were then placed in copper molds shaped to match the defect space (8 mm in diameter, 1 mm in height). 50:50/85:15 scaffolds were fabricated by filling half of the mold with FTY720-loaded 50:50 microspheres, and the other half with FTY720-loaded 85:15 microspheres. 85:15 (L/U) scaffolds were made by filling half of the molds with FTY720-loaded 85:15 scaffolds, and the other half with unloaded 85:15 scaffolds. Scaffolds were sintered in the circular molds at 60°C for 1 hour. In order to fluorescently label 85:15 microspheres, FTY720 were dissolved in MeCl2, triethylamine was added and stirred under a nitrogen atmosphere. Naphthoyl chloride (Sigma Aldrich, St. Louis, MO) was then added and allowed to react for 16 hours. 85:15 microspheres with the labeled FTY720 were prepared as previously mentioned and imaged with a confocal microscope (Zeiss). A second method of examining FTY720 localization was done by imaging microspheres made of 50:50 and 85:15 PLAGA that loaded with fluorescently tagged drug (Cayman Chemical, Ann Arbor, MI). Evaluation using both methods ensured that the observed result was not a consequence of labeling strategy.
In vitro FTY720 release from microsphere scaffolds
The scaffolds were placed in vials containing 500 μL simulated body fluid (SBF, pH 7.2; 7.996g NaCl, 0.35 g NaHCO3, 0.3 g KCl, 0.136 g KH2PO4, 0.095 g MgCl2, 0.278 g CaCl2, 0.06 g MgSO4 to 1 L deionized water) with 4% (w/v) fatty acid free bovine serum albumin (FAF BSA, Roche, Mannheim, Germany), and maintained at 37°C with constant agitation. For each vial, the fluid was aspirated and replaced with fresh solution daily. To extract FTY720 from the solution, the fluid samples were added to 2 mL of a 3:1 methanol:chloroform mixture. C17 sphingosine was used as an internal standard. The mixture was homogenized via sonication for 10 minutes, and immediately incubated at 48°C with agitation overnight. After the addition of 200μL of methanolic KOH, the samples were incubated at 37°C for 2 hours. 30μL of glacial acetic acid was added, samples were cooled to 4°C, and then centrifuged at 10,000×g for 10 minutes. The supernatant was collected, dried to a solid, and stored at −20°C. FTY720 release was measured for up to 7 and 14 days in separate studies. Scanning electron microscope (SEM) images were taken before and after FTY720 release form 50:50 loaded microspheres.
High performance liquid chromatography-mass spectrometry analysis
Immediately prior to high performance liquid chromatography-mass spectrometry (HPLC-MS) analysis, the extraction residue was dissolved in 300 μL of methanol and filtered. Samples were analyzed with a Shimadzu UFLC High Performance Liquid Chromatograph (Columbia, MD) equipped with a Supelco Discovery C18, 5μm (125 × 2 mm connected to an ABI 4000 QTrap triple quadrupole mass spectrometer (Applied Biosystems, Inc., USA).
Diffusion-based release model
The time-dependent release of drugs from polymer microspheres has been previously described and modeled.18 Briefly, the fraction of drug released at time t, (Mt/M∞) is shown to be:
| (1) |
for Mt/M∞ < 0.6, where r is the radius of the microspheres, and T is the time-dependent diffusion coefficient given by:
| (2) |
where Dinitial is the drug diffusion coefficient, and a and b are constants that are dependent on polymer-drug interactions, the polymer’s molecular weight, and degradation rate.
Results from a 7-day in vitro FTY720 release study from 85:15 and 50:50 PLAGA microsphere scaffolds were fit to this model in order to obtain the parameters necessary to predict FTY720 release at longer timepoints.
Dissolution study
Quadruplicate samples of FTY720-loaded microsphere scaffolds were placed in 1 mL 1:1 DMF: MeCl2 (v/v) for a total of 20 minutes. At intermediate timepoints, the solvent was collected and replaced with fresh solvent. The collected solvent was mixed with 500 μL methanol in order to precipitate the dissolved polymer. The liquid was then collected, dried to a solid, and stored at −20°C. Immediately prior to analysis, the samples were prepared for HPLC-MS analysis in order to determine the amount of FTY720.
Mass loss study
Quadruplicate samples of unloaded microsphere scaffolds were placed in 1 mL 1:1 DMF: MeCl2 for timepoints up to 20 minutes. At each time point, the solvent was aspirated. The scaffold was then dried, and the residual solvent was evaporated under reduced pressure. The scaffolds’ final mass was compared to the initial mass.
NMR Analysis
1D and 2D NOESY 1H NMR spectra were recorded on a Bruker DRX-600 spectrometer, operating at 600 Hz. Deuterated chloroform (CDCl3) was used as a solvent. Chemical shifts are reported as ppm, with tetramethylsilane as a reference.
Statistical analysis
Results are presented as mean ± SEM. 3 replicates were used for all in vitro experiments. Statistical analysis of the increase in bone volume was performed using a General Linear Model analysis of variance, followed by Tukey’s Test for pairwise comparison. n=5 was used for all animal studies. Significance was asserted at p < 0.05.
Cranial defect model and implantation of scaffolds
Scaffolds were implanted into adult male rat retired breeders (400–550 g, wild-type Sprague Dawley; Charles River, Wilmington, MA) as described previously, with some modifications.19 Animals were anesthetized by intraperitoneal injection of a mixture of ketamine and xylazine. Following anesthetization, the skin was incised along the midline and the subcutaneous fascia was divided until the periosteal layer was revealed. The periosteum was reflected laterally. An 8 mm diameter circular defect was excavated using a drill under constant irrigation with sterile saline solution in order to prevent bone overheating. Implants of choice were placed into the defect. In the case of the 50:50/85:15 scaffolds, the scaffolds were implanted so that the 50:50 side was on the left side of the animal. Animals in the 85:15 (L/U) group received the FTY720-loaded microspheres on the left side. All animals that received implants were left with a reflected periosteum. Animals that were in the empty defect group had the periosteum re-sutured over the defect in order to avoid issues with soft tissue prolapse into the defect space. The skin was closed using running sutures. Following closure, both antibiotics and postoperative analgesics were administered for 1 week following surgery. NIH guidelines for the care and use of laboratory animals (NIH Publication #85-23 Rev. 1985) were observed. All surgeries were performed according to a protocol approved by the Institutional Animal Care Committee at the University of Virginia.
Microcomputed tomography image analysis of cranial defect
New bone formation was assessed by in vivo microcomputed tomography (microCT) at 0, 2, 4, 6, and 9 (50:50/85:15 PLAGA and empty defect groups only) weeks. The animals were anesthetized by intraperitoneal injection of a mixture of ketamine and xylazine. Low-resolution 45 kVp scans were used to generate microCT images. After reconstruction of the two-dimensional slices, an appropriate threshold range matching the original grayscale images was chosen. Contour lines were drawn around the defect area to appropriately select a volume of that encompassed the defect and some surrounding native bone. Three-dimensional images were created from two-dimensional slices, and the bone volume was calculated using the three-dimensional evaluation program.
Histological sectioning and staining of tissue
After ex vivo microCT scanning at the end of the study, each sample was placed into a histology cassette, labeled, and decalcified using 10% formic acid for 7 days at room temperature on a rotating rocker. After decalcification, samples were dehydrated overnight. Samples were then cut along the coronal plane at the midline of the defect and embedded in paraffin. 5 mm sections were then cut, and stained with hematoxylin and eosin (H&E).
Results
Increasing polymer hydrophobicity localizes FTY720 to the microsphere surface
In order to determine the role of FTY720’s distribution in the microspheres on the release kinetics, 85:15 and 50:50 FTY720-loaded PLAGA scaffolds were dissolved in 1:1 DMF:MeCl2 for timepoints up to 20 minutes. Dissolution of the polymer by MeCl2/DMF is successive layers was used to show higher concentration of the drug is distributed on the surface. At each time point, the 85:15 scaffolds released a larger amount of FTY720 (Figure 1a), despite scaffolds composed of each polymer exhibiting similar mass loss (Figure 1b). After 20 minutes, the 85:15 scaffolds had released over 25% of the FTY720 in their initial loading, compared to less than 10% release exhibited by the 50:50 scaffolds. The ratio of the fraction drug released to the fraction mass loss (Figure 1c) supports the idea that the initial higher cumulative FTY720 release from the 85:15 PLAGA microsphere scaffolds in the in vitro release studies are due to a localization toward the microsphere surface compared to a more even distribution in 50:50 scaffolds. Surface localization of FTY720 in 85:15 microspheres is confirmed by confocal imaging as shown in Figure 1f–k. Figures h–k show the intensity of FTY720 increases towards the edge in the 85:15 microspheres and stays constant in the 50:50 microspheres. Additionally, we have also quantified the fluorescence intensity at different locations and normalized to the average intensity across the spheres Figure 1k).
Figure 1.

Release profiles of FTY720 from PLAGA microspheres of different compositions in 1:1 DMF:MeCl2. (A) Cumulative FTY720 release from 85:15 (○), and 50:50 (■) microsphere scaffolds dissolved in 1:1 DMF:MeCl2. (B) Mass loss of 85:15 (○), and 50:50 (■) microsphere scaffolds dissolved in 1:1 DMF:MeCl2 at each time point. (C) Cumulative ratio of fraction of FTY720 released to the fraction mass loss of microspheres made of different PLAGA composition. SEM images of FTY720 loaded 50:50 microsphere scaffolds at (D) day 0 and (E) week 3. Confocal imaging of (F) 85:15 microspheres loaded with labeled FTY720 confirms surface localization of the drug. No signal is seen in (G) unloaded microspheres. A second method of visualizing FTY720 was implemented by using fluorescently tagged drug. It also shows (H) more uniform distribution in 50:50 microspheres and (I) drug accumulation at the surface in 85:15 microspheres. No signal is seen in (J) unloaded microspheres. (K) The fluorescent intensity at different regions normalized to the average intensity of the microsphere confirms this observation.
In order to characterize the release of FTY720 from PLAGA scaffolds, the 7-day cumulative FTY720 release from 85:15 and 50:50 microsphere scaffolds in SBF with 4% fatty acid free BSA was measured. In the first 7 days, the 85:15 scaffolds released a higher percentage of its FTY720 loading compared to the 50:50 scaffolds. The 7-day release profiles from each scaffold were fitted to the mathematical model in order to predict the cumulative release at longer time points (Figure 2a). The model predicts a crossover of the cumulative release before 12 days, when the cumulative release of FTY720 from the 50:50 scaffolds becomes higher than the release from the 85:15 scaffolds. This trend was verified by a separate 15-day in vitro FTY720 release study (Figure 2b).
Figure 2.
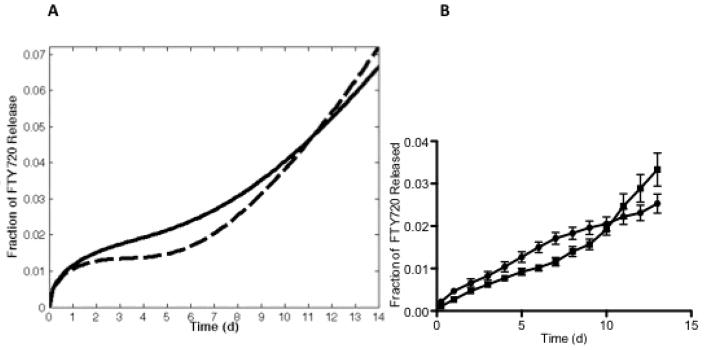
Release profiles of FTY720 from PLAGA microspheres of different compositions. (A) Mathematical prediction of cumulative release of FTY720 from 85:15 (-) and 50:50 (---) microsphere scaffolds up to 15 days based on experimental values obtained for the first 7 days (B) Cumulative in vitro FTY720 release from 85:15 (●), and 50:50 (■) microsphere scaffolds over a period of 15 days.
FTY720 release is sustained over a longer period of time due to drug-polymer interaction
Figure 3 shows the 1H NOESY NMR scan of a 1:200 mixture of FTY720 and PLAGA at combined concentration of 0.7 M in d-chloroform. The larger image shows the overall scan, whereas the smaller inset focuses on the downfield region at 6.0 – 9.0 ppm. The peaks upfield of 6 ppm can all be attributed to methylene and methyl peaks making up the main chain of FTY720 and PLAGA, leaving the amide proton as the only signals unaccounted for. While there is a single amide proton in FTY720, there is none in PLAGA and the peak at 8 ppm and the weak cross peak at 8.3 ppm may be attributed to intermolecular relationships.
Figure 3.

1H NOESY NMR scan of a 1:200 mixture of FTY720 and PLAGA at combined concentration of 0.7 M in d-chloroform. Inset: Focuses on the downfield region at 6.0 – 9.0 ppm. While there is a single amide proton in FTY720, there is none in PLAGA and the peak at 8 ppm and the weak cross peak at 8.3 ppm may be attributed to intermolecular relationships.
Rapid release of FTY720 from surface of 85:15 scaffold microspheres enhances bone growth over a period of 9 weeks
To study the effect of the FTY720 release kinetics on bone regeneration, scaffolds composed of FTY720-loaded 50:50 PLAGA on one side (left), and 85:15 PLAGA on the other (right) were implanted into critical-sized cranial defects in rats. MicroCT analysis shows new bone regeneration after 9 weeks in the original defect space for both sides of the 50:50/85:15 PLAGA scaffold groups (Figure 4a). Two weeks after implantation, quantitative microCT results show that the 50:50 side of the defect exhibits a higher increase in new bone growth compared to the 85:15 side and empty defect controls (Figure 4a), though none of the groups are statistically different from one another at this time point. However, between 4 and 9 weeks, the 85:15 side showed significantly increased bone growth compared to the 50:50 side (Figure 4b). The histological cross-sections (Figure 4c–e) suggests that early release of FTY720 from the 85:15 side of the scaffold that occured in the first 2 weeks as shown in the release profiles (Figure 2b) had a long-term impact on bone growth. The 50:50 scaffolds swell and lose pore volume at a faster rate. The structure of the 85:15 scaffolds would be maintained for a longer time encouraging cellular in-growth and an increase in new bone formation.
Figure 4.

85:15 microsphere scaffolds develop a more stable scaffold that results in enhanced bone formation over longer time periods. (A) MicroCT imaging shows that the amount of bone formed is higher in the half of the defect region that is treated with 85:15 FTY720 loaded microsphere scaffold compared to the 50:50 loaded scaffolds. Yellow outline shows the image of the original defect region at day 0, the blue outline shows the image at week 6 with the new bone formation (white arrows). (B) Change in bone volume between weeks 0–2, 0–4, 0–6, and 0–9 for the empty defect (
 ), the 50:50 side of the 50:50–85:15 scaffold (
 ), and the 85:15 side of the 50:50–85:15 scaffold (
 ). *Statistical significance, where p<0.05. This result is reflected in the histology. (C) Untreated empty defects have minimal bone formation. (D) The side treated with 50:50 microsphere scaffold swells and loses pore volume and has less bone formation (red arrows) compared to the side treated with (E) 85:15 microsphere scaffold. All histological analysis was done 9 weeks after treatment.
Spatial control of FTY720 release was achieved by implanting composite scaffolds with one side composed of FTY720-loaded 85:15 PLAGA microspheres, and the other side composed of unloaded 85:15 PLAGA microspheres. Qualitatively, microCT images reveal that FTY720-loaded side of the 85:15 (L/U) group exhibits the greatest enhancement of bone growth (Figure 5a). White arrowheads in the figures indicate regions of bone growth in the defect area that is not arising from the periphery. Such growth is absent in the side treated with unloaded PLAGA microspheres. Figure 5b shows the change in bone growth on the two sides of an 85:15 L/U scaffold, and an empty defect as assessed by quantitative microCT. At all timepoints, the FTY720-loaded side exhibited enhanced bone growth compared to the unloaded side and the empty defect. Figures 5c–e show histological images of the left side of a 85:15 loaded scaffold, the loaded side (left) of a 85:15 composite scaffold (85:15 L/U-L) and the unloaded side (right) of the 85:15 composite scaffold (85:15 L/U-U). Figures 5c–e suggests that FTY720 enhances new bone formation in a spatially dependent manner.
Figure 5.

FTY720 loading increases the amount of new bone formation in the defect region. (A) Microct imaging shows that the amount of bone formed is higher in the half of the defect region that is treated with a FTY720 loaded microsphere scaffold. Yellow outline shows the image of the original defect region at day 0, the blue outline shows the image at week 6 after the new bone formation at the periphery (white arrows) and away from the periphery (while arrowheads). (B) Change in bone volume between weeks 0–2, 0–4, and 0–6 for the empty defect (
), the FTY720-loaded side of the 85:15 (L)(
) scaffold, and the unloaded side of the 85:15 (U) scaffold (
). *Statistical significance, where p<0.05. This result is reflected in the histology. (C) The loaded side of the scaffold (left) shows more bone formation (red arrows) compared to the (D) unloaded side (right). All histological analysis was done 6 weeks after treatment.
Discussion
Sustained delivery of S1P and S1P receptor-targeted compounds has been used in several in vivo models. Since lactic acid is more hydrophobic than glycolic acid, increasing the lactic acid to glycolic acid ratio in PLAGA makes the polymer more hydrophobic. FTY720’s amphiphilic structure could be the main reason for its initial higher release from the slower-degrading 85:15 PLAGA, compared to the 50:50 PLAGA. Chen et al. showed that spatially localizing and temporally controlling growth factor delivery created spatially organized tissues, that could be utilized to guide tissue regeneration in a way that mimics native remodeling.20 The authors showed that the delivery of vascular endothelial growth factor (VEGF) and platelet-derived growth factor (PDGF) from 85:15 and 75:25 PLAGA microspheres affected the pattern of blood vessel formation and maturation in a murine ischemic hindlimb model. The effect of scaffold-therapeutic interactions on release kinetics is also critical with the co-delivery of multiple growth factors from a single scaffold. Freeman and Cohen showed that the interactions of VEGF, PDGF-BB and TGF-β1 with a modified alginate scaffold resulted in a release profile that enhanced the growth and maturation of new blood vessels.21 Among factors that affect drug distribution, and therefore release kinetics, in the microsphere are size and the hydrophobicity of the polymer and drug.22 The authors found that the more hydrophilic compounds exhibited a faster, burst release profile from hydrophobic polymer microspheres, due to a strong proclivity to localize toward the microsphere surface. Spatial control of bioactive signals is also desired, as it has been shown to affect cell migration as well as tissue growth and regeneration.22 Spatially controlling the distribution of VEGF in scaffolds was also shown to enhance perfusion and recovery in a murine hindlimb ischemia model.23,24
We showed that FTY720 is more localized at the surface of the 85:15 PLAGA microspheres, and initially exhibits faster release kinetics. This is supported by the FTY720 released during the dissolution of the microsphere scaffolds in 1:1 DMF:MeCl2 shown in Figure 1a. Although the 85:15 and 50:50 PLAGA microsphere scaffolds exhibited comparable time-dependent mass loss when submerged in the solvent (Figure 1b), cumulative FTY720 release from 85:15 scaffolds was greater by a factor of 2.5 after 20 minutes. However, the faster degradation rate of the 50:50 PLAGA results in an eventual crossover of the cumulative FTY720 release. After analyzing the 7-day in vitro release profiles from both PLAGA scaffolds, the mathematical model predicts this crossover occurring before day 12 (Figure 2a). Extending the in vitro release study to longer timepoints (Figure 2b) shows that this crossover does occur before day 12, as predicted by the model. However, the amount of FTY720 released at each time point is less than what is predicted by the mathematical model. PLAGA is known to degrade by a combination of bulk erosion and surface erosion. However, 1H NOESY NMR analysis suggests that there could be intermolecular interaction between the PLAGA scaffold and the loaded FTY720 (Figure 3). This suggests that the release of FTY720 from a PLAGA scaffold will be primarily mediated by the polymer degradation and not bulk erosion.
S1P receptor activation has been shown to induce the migration of dural bone progenitor cells, thereby contributing to enhance bone regeneration.10 The early higher cumulative release from the 85:15 microspheres seemed to create a scaffold with better structural integrity and recruits more bone progenitor cells to the corresponding side of the defect in the 50:50/85:15 scaffolds, as the 85:15 side exhibited significantly greater bone growth after 4 and 6 weeks. The higher release of FTY720 from the 85:15 microspheres for the first 12 days lead to enhanced bone growth between weeks 0 and 2 (Figure 4b), as a higher number of cells were recruited to the defect area, then formed mineralized matrix that was detected by microCT scans. The maintenance of matrix integrity in the 85:15 scaffolds as indicated by the histology of the defect site could also have enhanced progenitor recruitment. It is also worth noting that at week 9, the bone growth associated with the 50:50 side and the 85:15 side is no longer statistically significant (Figure 4a), possibly due to the higher FTY720 release from the 50:50 microspheres after 12 days. The shallow dimension of craniofacial bone and the high local acidity of the polymer is a challenge to induce boney ingrowth. However, we believe this was a good model to test the effects of FTY720 delivery.
Spatial control of bone remodeling was also accomplished by implanting 85:15 (L/U) scaffolds. As shown in Figure 5a, the FTY720-loaded side of the 85:15 (L/U) scaffold also showed significantly enhanced bone growth after 4 and 6 weeks. Compared to the right and left sides of the 85:15 (L) scaffold, the FTY720-loaded 85:15 sides of 85:15 (L/U) scaffolds showed higher bone growth at all timepoints, and significantly higher growth after 6 weeks. Currently, there are limited published results on the effect of FTY720 dose on enhanced bone tissue growth and regeneration. However there are several studies that show a maximum in cell migration with S1P gradients, where cell migration is inhibited at higher concentrations. Endothelial25,26 and CD4+ T cells27 have been shown to exhibit a maximum in cell migration with S1P and FTY720/FTY720-P concentration. Hematopoetic28 and osteoclast29 progenitors have also exhibited maximums in a chemotactic response to S1P concentration. It is possible that higher FTY720 released from the 85:15 (L) scaffolds, compared to the 85:15 (L/U) scaffolds, is enough to provide a high dose that effectively limits the migration of bone progenitor cells, an effect that is shown to occur with S1P and FTY720 in vitro with a variety of cell types. However, further studies demonstrating a dose response effect of FTY720 release in vivo will be necessary to confirm this.
Conclusions
The healing of cranial bone defects involves progenitor cell recruitment, and blood vessel remodeling and maturation, which are enhanced by the sustained release of S1P and S1P receptor-targeting compounds. In this study, the release of FTY720 from polymer scaffolds was characterized in terms of its distribution in polymer microspheres, and the in vitro release kinetics in order to maximally enhance bone regeneration in a critical-sized cranial defect. The greater tendency of FTY720 to localize toward the surface of the more hydrophobic 85:15 PLAGA, compared to 50:50 PLAGA, contributed to a higher cumulative release in the first 12 days. This higher initial release and the long-term structural integrity of the 85:15 scaffold contributed to enhanced bone regeneration in a cranial defect for up to 9 weeks. Spatial control of bone regeneration was achieved by creating scaffolds with a heterogeneous distribution of FTY720. Further characterization of FTY720 release, and the fabrication of optimal scaffolds, will allow us to discern the relative contribution of early drug release and long-term maintenance of structurally integrity to bone healing.
Acknowledgments
This work was supported by NIH R01 DE019935-01. Financial support was provided by an institutional National Research Service Award from T32 AR050960 from NIAMS and NIH. University of Virginia Research Histology Core.
Footnotes
No benefit of any kind will be received either directly or indirectly by the author(s).
References
- 1.Amini AR, Laurencin CT, Nukavarapu SP. Bone tissue engineering: recent advances and challenges. Crit Rev Biomed Eng. 2012;40(5):363–408. doi: 10.1615/critrevbiomedeng.v40.i5.10. [DOI] [PMC free article] [PubMed] [Google Scholar]
- 2.Woo EJ. Adverse Events After Recombinant Human BMP2 in Nonspinal Orthopaedic Procedures. Clin Orthop Relat Res. 2012 Nov 7; doi: 10.1007/s11999-012-2684-x. Epub Ahead of Print. [DOI] [PMC free article] [PubMed] [Google Scholar]
- 3.Woo EJ. Recombinant human bone morphogenetic protein-2: adverse events reported to the Manufacturer and User Facility Device Experience database. Spine J. 2012 Oct;12(10):894–9. doi: 10.1016/j.spinee.2012.09.052. [DOI] [PubMed] [Google Scholar]
- 4.Chen RR, Silva EA, Yuen WW, Brock AA, Fischbach C, Lin AS, Guldberg RE, Mooney DJ. The FASEB journal : official publication of the Federation of American Societies for Experimental Biology. 2007;21:3896–903. doi: 10.1096/fj.06-7873com. [DOI] [PubMed] [Google Scholar]
- 5.Lynch KR, Macdonald TL. Biochimica et biophysica acta. 2008;1781:508–12. doi: 10.1016/j.bbalip.2008.06.006. [DOI] [PMC free article] [PubMed] [Google Scholar]
- 6.Hla T. Pharmacological Research. 2003;47:401–407. doi: 10.1016/s1043-6618(03)00046-x. [DOI] [PubMed] [Google Scholar]
- 7.Mandala S, Hajdu R, Bergstrom J, Quackenbush E, Xie J, Milligan J, Thornton R, Shei G-J, Card D, Keohane C, Rosenbach M, Hale J, Lynch CL, Rupprecht K, Parsons W, Rosen H. Science (New York, NY) 2002;296:346–9. doi: 10.1126/science.1070238. [DOI] [PubMed] [Google Scholar]
- 8.Sefcik LS, Petrie Aronin CE, Awojoodu AO, Shin SJ, Gabhann FM, Macdonald TL, Wamhoff BR, Lynch KR, Peirce SM, Botchwey EA. Tissue engineering. Part A. 2011;17:617–629. doi: 10.1089/ten.tea.2010.0404. [DOI] [PMC free article] [PubMed] [Google Scholar]
- 9.Pederson L, Ruan M, Westendorf JJ, Khosla S, Oursler MJ. Proceedings of the National Academy of Sciences of the United States of America. 2008;105:20764–9. doi: 10.1073/pnas.0805133106. [DOI] [PMC free article] [PubMed] [Google Scholar]
- 10.Petrie Aronin CE, Sefcik LS, Tholpady SS, Tholpady A, Sadik KW, Macdonald TL, Peirce SM, Wamhoff BR, Lynch KR, Ogle RC, Botchwey EA. Tissue engineering. Part A. 2010;16:1801–9. doi: 10.1089/ten.tea.2009.0539. [DOI] [PMC free article] [PubMed] [Google Scholar]
- 11.Zhu R, Snyder AH, Kharel Y, Schaffter L, Sun Q, Kennedy PC, Lynch KR, Macdonald TL. Journal of medicinal chemistry. 2007;50:6428–35. doi: 10.1021/jm7010172. [DOI] [PMC free article] [PubMed] [Google Scholar]
- 12.Brinkmann V, Lynch KR. Current opinion in immunology. 2002;14:569–75. doi: 10.1016/s0952-7915(02)00374-6. [DOI] [PubMed] [Google Scholar]
- 13.Berkland C, Kim KK, Pack DW. Pharmaceutical research. 2003;20 doi: 10.1023/a:1024466407849. [DOI] [PubMed] [Google Scholar]
- 14.Choi Y-S, Joo J-R, Hong A, Park J-S. Bulletin of the Korean Chemical Society. 2011;32:867–872. [Google Scholar]
- 15.Mollica F, Biondi M, Muzzi S, Ungaro F, Quaglia F, Rotonda MI, La, Netti PA. Journal of materials science. Materials in medicine. 2008;19:1587–93. doi: 10.1007/s10856-007-3301-5. [DOI] [PubMed] [Google Scholar]
- 16.Tran V-T, Benoît J-P, Venier-Julienne M-C. International journal of pharmaceutics. 2011;407:1–11. doi: 10.1016/j.ijpharm.2011.01.027. [DOI] [PubMed] [Google Scholar]
- 17.Alexis F. Polymer International. 2005;54:36–46. [Google Scholar]
- 18.Bezemer JM, Radersma R, Grijpma DW, Dijkstra PJ, van Blitterswijk Ca, Feijen J. Journal of controlled release : official journal of the Controlled Release Society. 2000;67:249–60. doi: 10.1016/s0168-3659(00)00212-1. [DOI] [PubMed] [Google Scholar]
- 19.Sefcik LS, Petrie Aronin CE, Wieghaus Ka, Botchwey Ea. Biomaterials. 2008;29:2869–77. doi: 10.1016/j.biomaterials.2008.03.017. [DOI] [PMC free article] [PubMed] [Google Scholar]
- 20.Chen RR, Silva EA, Yuen WW, Mooney DJ. Pharmaceutical research. 2007;24:258–64. doi: 10.1007/s11095-006-9173-4. [DOI] [PubMed] [Google Scholar]
- 21.Freeman I, Cohen S. Biomaterials. 2009;30:2122–31. doi: 10.1016/j.biomaterials.2008.12.057. [DOI] [PubMed] [Google Scholar]
- 22.Berkland C, Kipper MJ, Narasimhan B, Kim K Kevin, Pack DW. Journal of Controlled Release. 2004;94:129–141. doi: 10.1016/j.jconrel.2003.09.011. [DOI] [PubMed] [Google Scholar]
- 23.Lin C-C, Anseth KS. Pharmaceutical research. 2009;26:631–43. doi: 10.1007/s11095-008-9801-2. [DOI] [PMC free article] [PubMed] [Google Scholar]
- 24.Singh M, Morris CP, Ellis RJ, Detamore MS, Berkland C. Tissue engineering. Part C, Methods. 2008;14:299–309. doi: 10.1089/ten.tec.2008.0167. [DOI] [PMC free article] [PubMed] [Google Scholar]
- 25.Alford SK, Kaneda MM, Wacker BK, Elbert DL. Journal of biomedical materials research. Part A. 2009;88:205–12. doi: 10.1002/jbm.a.31885. [DOI] [PubMed] [Google Scholar]
- 26.Sanchez T, Estrada-Hernandez T, Paik J-H, Wu M-T, Venkataraman K, Brinkmann V, Claffey K, Hla T. The Journal of biological chemistry. 2003;278:47281–90. doi: 10.1074/jbc.M306896200. [DOI] [PubMed] [Google Scholar]
- 27.Maeda Y, Matsuyuki H, Shimano K, Kataoka H, Sugahara K, Chiba K, Alerts E. The Journal of Immunology. 2007;178:3437–3446. doi: 10.4049/jimmunol.178.6.3437. [DOI] [PubMed] [Google Scholar]
- 28.Ryser MF, Ugarte F, Lehmann R, Bornhäuser M, Brenner S. Molecular immunology. 2008;46:166–71. doi: 10.1016/j.molimm.2008.07.016. [DOI] [PubMed] [Google Scholar]
- 29.Ishii M, Kikuta J, Shimazu Y, Meier-Schellersheim M, Germain RN. The Journal of experimental medicine. 2010;207:2793–8. doi: 10.1084/jem.20101474. [DOI] [PMC free article] [PubMed] [Google Scholar]