

Abstract
Purpose:
Though various targets have been proposed and evaluated, no agent has yet been investigated in a clinical setting for head and neck cancer. The present study aimed to compare two fluorescently labeled anti-epidermal growth factor receptor (EGFR) antibodies for detection of head and neck squamous cell carcinoma (HNSCC).
Procedures:
Antigen specificities and in vitro imaging of the fluorescently labeled anti-EGFR antibodies were performed. Next, immunodeficient mice (n=22) bearing HNSCC (OSC-19 and SCC-1) tongue tumors received systemic injections of cetuximab-IRDye800CW, panitumumab-IRDye800CW, or IgG-IRDye800CW (a nonspecific control). Tumors were imaged and resected using two near-infrared imaging systems, SPY and Pearl. Fluorescent lymph nodes were also identified, and all resected tissues were sent for pathology.
Results:
Panitumumab-IRDye800CW and cetuximab-IRDye800CW had specific and high affinity binding for EGFR (KD=0.12 and 0.31 nM, respectively). Panitumumab-IRDye800CW demonstrated a 2-fold increase in fluorescence intensity compared to cetuximab-IRDye800CW in vitro. In vivo, both fluorescently labeled antibodies produced higher tumor-to-background ratios compared to IgG-IRDye800CW. However, there was no significant difference between the two in either cell line or imaging modality (OSC-19: p=0.08 SPY, p=0.48 Pearl; SCC-1: p=0.77 SPY, p=0.59 Pearl; paired t tests).
Conclusions:
There was no significant difference between the two fluorescently labeled anti-EGFR monoclonal antibodies in murine models of HNSCC. Both cetuximab and panitumumab can be considered suitable targeting agents for fluorescent intraoperative detection of HNSCC.
Keywords: Aerodigestive squamous cell carcinoma, Head and neck, Near-infrared imaging, Epidermal growth factor receptor
Introduction
Novel techniques for intraoperative detection of tumor margins and residual disease have been an ongoing interest of surgeons for years. Gross inspection and frozen sections continue to be the gold standard. However, these techniques result in a failure to obtain complete tumor resections in almost 40 % of head and neck cancer cases [1]. Since positive margins predict poor patient survival and result in further surgery and/or adjuvant treatment, improved detection is required [2]. Precise identification of tumor margins during the operative period would help guide surgical technique and spare patients from added morbidity associated with additional surgery or chemoradiation. Recently, investigators have begun to look at tumor-specific agents combined with optical imaging compounds to delineate tumor margins and/or residual cancer [3-11]. This technique has the potential to provide surgeons with intraoperative information to minimize resection of benign tissue and thereby decrease associated morbidities. By also enhancing disease resection, this technique may improve oncologic outcomes.
Imaging strategies such as computed tomography, magnetic resonance imaging, and positron emission tomography have long been the gold standard for the early detection of cancer as well as the surveillance of local, regional, or distant recurrence. However, these imaging modalities do not provide real-time information during the surgical resection. Development of an optical imaging technique that provides real-time viewing of both the anatomical surface as well as specific identification of cancer would provide invaluable intraoperative information.
The longer wavelength spectrum of near-infrared fluorescence allows for lower tissue absorption and reduces interference from tissue autofluorescence [8]. As a result, fluorescence imaging has gained wide acceptance in the detection of several different forms of cancer [5, 10, 12-17]. Recent works with near-infrared optical contrast agents in urologic, gastrointestinal, lung, breast, and upper aerodigestive tract cancers have shown that this technique is viable in the operative setting [6, 7, 10, 14, 18-22]. Additionally, the initial steps towards clinical translation are occurring in Europe where the first clinical trials are taking place [7, 23]. These studies are evaluating the efficacy of fluorescently labeled antibodies for intraoperative ovarian and breast cancer detection. However, the optimal optical imaging agent for head and neck cancer has yet to be evaluated.
Epidermal growth factor receptor (EGFR) is overexpressed in up to 90 % of head and neck cancers and unregulated in early tumor progression, making it an ideal target for cancer-specific contrast agents in this patient population [24]. Additionally, anti-EGFR antibodies bind with a high affinity to EGFR, facilitating their localization to oncologic cells [25-28]. As a result, several previous studies have investigated the utility of labeling monoclonal antibodies targeting EGFR for imaging [16, 29, 30]. Combining monoclonal antibodies with a fluorophore has been found to detect tumor dimensions as small as 2 mm, as well as regional metastasis in vivo [4, 31, 32]. Of course, results such as these will depend on the properties of the imaged tissue as well as the imaging systems used.
In this investigation, we sought to determine which anti-EGFR therapeutic antibody performs the best in head-to-head in vitro and in vivo comparisons. Several investigations have explored cetuximab-IRDye800CW for optical imaging and cancer detection [3, 4, 31-33]. Panitumumab, a fully humanized anti-EGFR monoclonal antibody, has a different binding epitope than cetuximab, and structurally, it is a different immunoglobulin G (IgG) subclass. These properties alter its EGFR binding and circulation time [27]. Identifying the best antibody in preclinical studies would help with agent selection for clinical translation. In this study, we investigated if the differences in IgG structure affected binding specificity, tumor localization, and tumor detection.
Materials and Methods
Cell Lines and Cell Culture
Head and neck squamous cell carcinoma (HNSCC) cell lines SCC-5 and SCC-1 (University of Michigan, Ann Arbor, MI), FADU (ATCC), and OSC-19 (University of Texas M. D. Anderson Cancer Center, Houston, TX) were maintained in Dulbecco’s modified Eagle’s medium containing 10 % fetal bovine serum (FBS) and supplemented with 1 % penicillin, streptomycin, and amphotericin B. The cells were incubated at 37 °C in 5 % CO2.
Reagents
Cetuximab (ImClone Systems, Branchburg, NJ) is a recombinant, human/mouse chimeric monoclonal antibody that binds specifically to the extracellular domain of the human EGFR. Cetuximab is composed of the Fv regions of a murine anti-EGFR antibody with human immunoglobulin G1 (IgG1) heavy and kappa light chain (152 kDa). The mean half-life in humans is 112 h (63–230 h).
Panitumumab (Vectibix; Amgen, Thousand Oaks, CA) is a recombinant, fully humanized monoclonal antibody that binds specifically to the extracellular domain of the human EGFR. Panitumumab is an anti-EGFR antibody with human immunoglobulin G2 (IgG2) heavy and kappa light chain (147 kDa). Protein A purified IgG antibody (Innovative Research, Peary Court Novi, MI) was used as a control antibody (146 kDa). The mean half-life in humans is 180 h (86–262 h).
Fluorescent Labeling of Monoclonal Antibodies
Near-infrared imaging probe, IRDye-800CW-NHS (IRDye 800CW-N-hydroxysuccinimide ester, LI-COR Biosciences, Lincoln, NE), has a broad absorption peak (maximum at 778 nm) and emission peak (maximum at 794 nm). When conjugated with an antibody, IRDye800CW has an absorption maximum of 774 nm and an emission maximum of 789 nm [34]. Control IgG, cetuximab, and panitumumab were labeled according to the manufacturer’s instructions. Briefly, they were incubated in the dark at room temperature with IRDye800CW in 1.00 M potassium phosphate buffer (pH 9.0) for 2 h. The unconjugated dye was removed by desalting spin columns (Pierce Biotechnology, Rockford, IL). The spectrometry readings of the antibody–dye conjugates were performed using the DU-640B spectrophotometer (Beckman Coulter, Inc., Brea, CA).
Antibody Binding Specificity
A binding assay was developed utilizing purified ingredients and not cells, therefore eliminating inconsistencies which can result from a variation in cell confluency. Recombinant EGFR (rEGFR; 100 ng/well/100 μl; R&D systems, Minneapolis, MN) was coated on a 96-well black plate (Corning, Lowell, MA). The plate was incubated overnight at 4 °C and then blocked with 1 % bovine serum albumin (BSA) for 1 h at room temperature. Wells were washed with phosphate buffer solution (PBS) three times, and a final volume of 100 μl of PBS with 1 % BSA was added to the wells. Plates were incubated for 3 h at 37 °C with eight different concentrations (0.05 to 6.6 nM) of IgG-IRDye800CW, cetuximab-IRDye800CW, or panitumumab-IRDye800CW. In addition, nonspecific binding was determined by incubating with excess unlabeled IgG, cetuximab, or panitumumab for 1 h at room temperature. Furthermore, uncoated wells were incubated with equal molar equivalents of nonspecific IgG-IRDye800CW, cetuximab-IRDye800CW, or panitumumab-IRDye800CW. Wells were washed with PBS three times, and then the plate was imaged using the Pearl Imager. The well fluorescence intensities were analyzed using Pearl Impulse Software Version 2.0. Briefly, a region of interest was drawn around the internal rim of the well, and the mean pixel values of designated areas were recorded. The assay was run on a single 96-well black plate, eliminating the need to account for background signal. To confirm this, the mean pixel value of the background was subtracted from each value, and the KD was calculated and found to be the same. The above procedure was repeated for three different batches of antibody–IRDye conjugates.
In Vitro Fluorescence Cell Staining
HNSCC cell lines SCC-5, FADU, and OSC-19 were plated 2×10⁵ in glass bottom culture dishes and allowed to adhere overnight. Cells were then incubated at 37 °C for 20 min with 2 μg of control IgG-IRDye800CW, cetuximab-IRDye800CW, or panitumumab-IRDye800CW and imaged with the Pearl Imager. The fluorescence intensity for each cell population was quantified (mean pixel values of designated areas) by using the Pearl Impulse Software Version 2.0.
EGFR Expression Quantification
SCC-5, FADU, and OSC-19 (1×10⁶) cells were incubated with 0.2 μl of PE mouse anti-human EGFR (BD Biosciences Pharmigen, San Diego, CA) in 100 μl of PBS with 3 % FBS for 20 min. The cells were then washed with PBS and resuspended in 100 μl of PBS with 3 % FBS, and EGFR expression levels were quantified by flow cytometry (Accuri, C6, Ann Arbor, MI) and analyzed with the CFlow plus software.
Animal Models
Nude (nu/nu) female mice, aged 4 to 6 weeks (Charles River Laboratories, Hartford, CT), were obtained and housed in accordance with our Institutional Animal Care and Use Committee (IACUC) guidelines. All of the experiments were conducted after review and approval of the institution’s IACUC guidelines. For the HNSCC cell line model, nude mice (n=22) received tongue injections of 2.5×10⁵ SCC-1 or OSC-19 cells. These cell lines were chosen because they are standard cell lines used in clinical models of head and neck cancer, represent a range of EGFR expression, and more consistently produce tumors in the orthotopic tongue model. The injections were prepared in a suspension of 25 μl of PBS and were administered into the tongue. A board-certified pathologist confirmed the presence or absence of squamous cell carcinoma in the tissue samples.
Fluorescent Imaging Devices and Contrast Measurement
The SPY imaging system captures fluorescent light using a charge-coupled device video camera at a rate of 30 frames/second and displays it on a computer monitor, allowing visualization of images in real time [35]. The SPY system was used to guide tumor resections 48 h following injection of the antibody–dye conjugates. The Pearl Impulse Small Animal Imager (LI-COR Biosciences, Lincoln, NE) is specifically designed to image IRDye800CW and was used for in vitro (rEGFR and HNSCC cells) and in vivo imaging. The Pearl Impulse device is a closed system with a cooled charge-coupled camera. The settings (excitation/emission) for the 800-nm channel were 785/820. Because the Pearl is specific for IRDye800CW, in vivo imaging with Pearl allowed for co-localization and verification of the fluorescence seen by the SPY. In vitro fluorescence intensity (luminosity) was measured by drawing equivalently sized regions of interest (ROI) around areas of fluorescence and nonfluorescence (background), and the mean pixel values of designated areas were analyzed by Pearl Impulse Software Version 2.0. The tumor-to-background ratio (TBR) in vitro was derived by dividing the mean fluorescence of the tumor by the mean fluorescence of the background. In vivo, fluorescence intensity from both SPY and Pearl images was quantified using ImageJ software [36]. ROIs within the tumor and background were again selected and a mean value, calculated. TBRs were then calculated.
Statistical Analyses
Data analysis (mean fluorescence, one-site binding saturation, total and nonspecific binding) of the antibodies for EGFR was done using GraphPad Prism software (GraphPad Software, San Diego, CA). A p<0.05 was considered significant in unpaired t test analysis used to determine differences between groups. The dye-to-protein ratio was calculated according to the manufacturer’s formula (D/P=[(A780/εDye]/[A208−(0.03×A780)/εProtein]) provided in the protocol for IRDye-800CW protein labeling kit for high molecular weight proteins (LI-COR Biosciences, Lincoln, NE). The ratio was reported as the mean for three samples ± standard deviation.
For each cell line, TBRs of each antibody were compared using paired t tests using GraphPad Prism version 5.04 for Windows (GraphPad Software; San Diego, CA, USA, www.graphpad.com). Statistical significance was considered at p<0.05.
Results
Binding Specificity of Anti-EGFR Antibodies
The mean dye-to-protein ratio was higher for cetuximab-IRDye800CW (1.44±0.11) compared to panitumumab-IRDye800CW (0.80±0.11). To compare the binding characteristics between fluorescently labeled antibodies, the antibodies’ dissociation constants (KD) for EGFR were determined. The KD values were found to be 0.31 nM (±0.05) for cetuximab-IRDye800CW and 0.12 nM (±0.21) for panitumumab-IRDye800CW (Fig. 1). The average nonspecific binding was low for cetuximab-IRDye800CW [20 % (±2.7)] and panitumumab-IRDye800CW [20 % (±5.8)] but very high for the control IgG-IRDye800CW [94.4 % (±1.3)]. Additionally, the total binding of IgG to plates coated with recombinant EGFR was less than 25 % of the binding demonstrated by cetuximab and panitumumab.
Fig. 1.
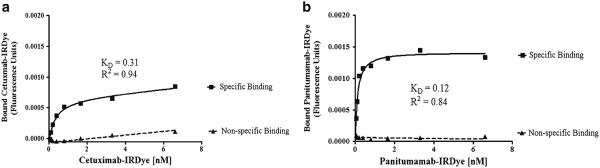
Binding assays for IRDye800CW conjugated cetuximab (a) and panitumumab (b). Saturation ligand binding curves show specific and nonspecific binding.
Comparison of EGFR Expression and Fluorescence Intensity In Vitro
In order to determine in vitro imaging characteristics, HNSCC cell lines SCC-5, FADU, and OSC-19 cells were incubated with control IgG-IRDye800CW or anti-EGFR antibodies labeled with IRDye800CW. Consistent with previous investigations, we found that EGFR expression did not correlate with fluorescence intensity and therefore binding of cetuximab-IRDye800CW or panitumumab-IRDye800CW to HNSCC cells [37, 38]. The FADU cell line did not demonstrate the expected linear relationship between fluorescence levels and EGFR expression levels. Of the three cell lines, FADU, had the lowest expression levels of EGFR but had the highest incorporation of the labeled antibodies, as indicated by the highest fluorescence intensities. In addition, relative to the florescence intensity of labeled IgG (2.79×10⁻³), labeled cetuximab had a 4-fold increase in fluorescence intensity (9.25×10⁻³), and panitumumab-IRDye800CW had a 7-fold increase in fluorescence intensity (1.66×10⁻²). A similar pattern was seen in the other cell lines as well. For the SCC-5 cell line, there was a 2.5-fold increase in fluorescence for cetuximab-IRDye800CW (7.61×10⁻³) and 5-fold increase for panitumumab-IRDye800CW (1.44×10⁻²), compared to control IgG-IRDye800CW (2.95×10⁻³). The OSC-19 cell line had the lowest fluorescence intensity values with control IgG-IRDye800CW being the lowest (1.90×10⁻³), followed by a 2-fold increase for cetuximab-IRDye800CW (4.53×10⁻³), and a 6-fold increase for panitumumab-IRDye800CW (1.19×10⁻²).
Peak Antibody–Dye Fluorescence In Vivo
Flank xenografts of SCC-5, FADU, and SCC-1 were imaged in vivo following systemic injection of 100 μg of cetuximab-IRDye800CW or panitumumab-IRDye800CW. The peak fluorescence for cetuximab-IRDye800CW occurred at approximately 48 h, while the peak fluorescence for panitumumab-IRDye800CW occurred closer to 72 h. In order to make a direct comparison, 48 h was the time point chosen. Consistent with the longer circulating times, there was still significant fluorescence intensity within the tumors at 96–120 h for the mice which received panitumumab-IRDye800CW, but those mice receiving cetuximab-IRDye800CW saw significant reduction in fluorescence intensity by 96 h (data not shown).
Near-infrared Fluorescent Imaging of Orthotopic Tumors
Nonspecific IgG-IRDye800CW was injected in mice bearing orthotopic tongue tumors (n=3 OSC-19, n=3 SCC-1) and imaged with both the SPY and Pearl. TBRs ranged from 0.96–1.13 (mean=1.05) on the SPY and 1.0–1.57 (mean=1.18) using the Pearl, indicating similar fluorescence intensities between the tumors and backgrounds. We have demonstrated this trend in other tumor types [31, 39].
Next, we assessed the labeled antibodies in 16 mice (eight of each cell line) bearing tongue tumors. In each cell line, mice randomly received either cetuximab-IRDye800CW (n=4) or panitumumab-IRDye800CW (n=4). Representative tumors and fluorescence intensities are illustrated in Fig. 2. In both cell lines, cetuximab-IRDye800CW achieved TBRs ranging from 2.20–3.15 (SPY, mean=2.85) and 2.58–4.26 (Pearl, mean=3.28). TBR ranges on SPY and Pearl for panitumumab-IRDye800CW were 2.19–3.05 (mean=2.55) and 2.46–5.09, respectively, with a mean=3.52 (Fig. 3). The TBRs produced by cetuximab-IRDye800CW were not significantly different than those by panitumumab-IRDye800CW for OSC-19 (p=0.48) or SCC-1 (p=0.59) using the Pearl. This was also true for the SPY system (OSC-19 p=0.08 and SCC-1 p=0.77).
Fig. 2.

SPY and Pearl images of representative tumors with each antibody–dye conjugate and control IgG-IRDye800CW are shown.
Fig. 3.

No significant difference was found between cetuximab-IRDye800CW and panitumumab-IRDye800CW for the two cell lines OSC-19 (a) or SCC-1 (b), and both imaging systems showed the same results. Both antibodies achieved tumor-to-background ratios of approximately 2.5 or higher and demonstrated much better contrast compared to IgG-IRDye800CW.
Resection with Fluorescent-Guided Imaging
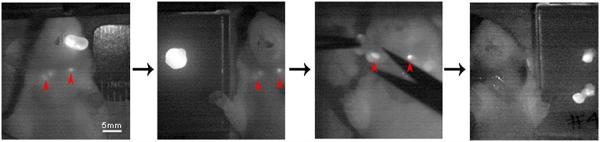
Once TBRs were established for each mouse with each imaging modality, the tumor tissue was resected using the SPY. The SPY allowed for real-time assessment of any residual fluorescent tissue in the oral cavity. Though no residuals remained after surgery in the oral cavities, fluorescent lymph nodes were identified in three mice (one with panitumumab-IRDye800CW and two with cetuximab-IRDye800CW, though only one mouse is shown) as shown in Fig. 4a. Pearl images confirmed the fluorescence seen on SPY, and the lymph nodes were later confirmed for the presence of squamous cell carcinoma by pathologic examination (Fig. 4b). Figure 5 illustrates the use of the SPY in the real-time resection of these lymph nodes. Under white light, it was unclear if these tissues contained metastatic disease. It is worth noting that the nodes were evident on SPY imaging through the skin; they were even more so upon removal of the overlying skin. Pathologic examination of pathologic slides confirmed the presence of tumor in our resected tumor samples.
Fig. 4.

Conjugated cetuximab and panitumumab were able to identify positive lymph nodes (a). After the primary tumor was resected (arrows), cervical lymph nodes were still detectable (arrowheads). These lymph nodes were later confirmed for the presence of disease on pathological examination (b). Both cases show subcapsular spread of squamous cell carcinoma.
Fig. 5.
Real-time SPY imaging was used to guide lymph node dissection.
Discussion
Surgeons continue to rely on frozen sections and gross tissue changes as the gold standard for the intraoperative assessment of tumor margins. Unfortunately, this results in significant sampling error and has led to a rapidly increasing interest in the use of fluorescently targeted agents for optical imaging of cancer. Previous experiments have shown the utility of using fluorescently labeled cetuximab to guide surgical resections and/or frozen section assessment to an area of residual tumor less than 5 mm [31]. Considering the well-documented upregulation of EGFR in multiple cancer types including head and neck cancers [40-42], we chose to conduct a preclinical evaluation of the binding specificities and optical imaging capabilities of the two FDA-approved anti-EGFR monoclonal antibodies. The majority of existing data uses fluorescently labeled cetuximab; therefore, we considered this to be our standard for comparison [3, 4, 31-33]. Using ligand- and cell-based assays, we found both IRDye800CW conjugated antibodies to have high affinity and low nonspecific binding to recombinant EGFR. In vitro fluorescence studies also revealed the antibodies to have higher binding to head and neck cancer cells as compared to control IgG-IRDye800CW. Consistent with our previous findings, we did not identify a relationship between fluorescence intensity and EGFR expression [43]. Our previous results suggest that the fluorescence intensity may be more related to receptor-mediated internalization of the dye–antibody bioconjugate over the 48 h of circulating time than to a cross-sectional analysis of EGFR expression. Interestingly, this is similar to clinical results where EGFR expression is not found to correlate to response to anti-EGFR therapies [44]. We have also shown that EGFR imaging can occur in the presence of therapeutic doses of anti-EGFR antibody, thus illustrating that receptors are not sensitive to blocking by unlabeled antibody [45].
In vivo, both antibodies showed higher TBRs in comparison to IgG-IRDye800CW. Though TBR values for IgG-IRDye800CW were quite low, we attribute values over 1 to the enhanced permeability and retention effect. This effect has been documented in similar animal models [46]. TBRs attained with panitumumab-IRDye800CW were consistent with those of previous studies using HNSCC in an orthotopic tongue model [39]. Peak tumor fluorescence for each antibody was found to differ slightly, with cetuximab-IRDye800CW occurring around 2 days and panitumumab-IRDye800CW, around 3 days. Because we chose to compare the two at 48 h instead of each antibody–dye conjugate’s peak fluorescence day, this may have led to lower TBRs by panitumumab-IRDye800CW, and we acknowledge this as a potential drawback to our design. We also acknowledge that the use of the Pearl, another fluorescent imaging system, as a standard for comparison in our experiments may be a possible weakness to the study design. In preclinical imaging studies, bioluminescent imaging (BLI) has been used for comparison in preclinical models; however, the clinical significance of positive disease by BLI has not been established (is residual disease by BLI sufficient to cause regrowth?). Furthermore, part of the focus of these studies is to serve as a bridge for clinical validation of this technique. Since BLI cannot be applied to human tumors, and as we have previously proposed, the Pearl has potential for use in the pathologic assessment of human tissue samples [47]. Therefore, our use of the Pearl for comparison was driven by the possibility for use with future patients. Lastly, as we have previously demonstrated in this model, the cervical lymph nodes can contain metastatic disease [39]; however, here we directly compare both anti-EGFR antibodies and demonstrate their potential to identify positive cervical lymph nodes with real-time imaging. This data provide compelling evidence for either antibody’s use for tumor-targeting in the optical imaging of HNSCC and associated lymphatic spread.
Optical imaging research, as a whole, has expanded greatly over the last decade, and additional strategies for tumor-targeting have been undertaken. Quantum dot nanoparticles, bioluminescent imaging, and protease-activated probes are among some of the proposed methods. These techniques, however, all have their own drawbacks including toxicity concerns, nonfeasible genetic alterations, and a lack of specificity that render them less translatable for clinical use. The safety of some of these reagents represents a real risk to patients during translation, and as a result, FDA approval may be a long process and a barrier to the use of these techniques. On average, the entire process from preclinical studies to approval can take between 8 and 12 years [48]. The concurrent development of suitable imaging hardware will also dictate the future success of these probes.
We have previously examined other monoclonal antibodies targeting tumor-specific ligands such as bevacizumab (anti-VEGF) and anti-CD147 [49, 50]. Results from these studies have not compared multiple antibodies as we do in the current study or used currently available imaging hardware to demonstrate feasibility of translation. Other tumor-targeting methods for the optical imaging of oral squamous cell carcinoma specifically have been explored. Keereweer et al. [51] demonstrated high fluorescence using IRDye800CW-labeled epidermal growth factor in both primary tongue tumors as well as associated cervical lymph node metastases. These studies further validate the EGFR axis as an appropriate probe for tumor-specific targeting in head and neck tumors. The exploitation of the overexpressed transferrin receptor (TfR) has also been reported in a head and neck tumor mouse model using TfR antibody conjugated to the Alexa-488 fluorochrome (480–490 nm) [52]. However, imaging in the near-infrared range (800 nm) has demonstrated superior imaging qualities such as increased depth penetration and lower nonspecific fluorescence [51]. Essential aspects to the detection thresholds of optical imaging, though, are the properties of the imaged tissue and those of the imaging systems used.
Although a large number of probes and hardware are being developed for the specific purpose of targeting cancers, we propose that safe and cost-efficient translation will be achieved by repurposing existing targeting molecules (FDA-approved antibodies) and intraoperative hardware such as the SPY system (designed to image indocyanine green). Many imaging studies fail to use imaging hardware consistent with operative use, such as the SPY, or preclinical surgical models to identify the potential to detect microscopic disease in the ablative wound bed. Secondly, both panitumumab and cetuximab are FDA approved, making them ideal targeting agents. Their established pharmacokinetics and safety in humans greatly decrease any translational risk. Furthermore, the fully humanized panitumumab offers a decreased likelihood of eliciting an immune response and the development of anti-panitumumab antibodies. Lastly, although there is an increase in background 24 h following administration, the longer circulating half-life of antibodies allows for prolonged exposure and cellular incorporation, which may improve tumor-to-background ratio. High sensitivity in optical imaging is linked to a probe’s ability to accumulate and be retained in a targeted area [53]. Though structural and binding mechanism differences do exist between the two antibodies [54, 55], this did not seem to contribute to overall differences in imaging abilities, and both were highly effective.
Conclusion
The further development of molecularly targeted antibodies for cancer treatment and the increased interest in fluorescent optical imaging probes and devices will eventually lead to significant improvements in the intraoperative surgical techniques and identification of residual disease. Identifying the most sensitive and specific probes available will be important in the translatability of this new form of disease detection. The methodology in this investigation is repeatable and applicable to other antibodies. In vivo, neither antibody–dye conjugate proved significantly better than the other. Both antibodies labeled to IRDye800CW demonstrated good contrast in this preclinical murine model for HNSCC.
Acknowledgments
The authors would like to thank Yolanda Hartman for running the rEGFR assay and Dr. Andra Frost for assistance in pathologic examination of tissue samples.
Footnotes
Conflict of interest. The authors have no financial disclosures or conflicts of interest.
References
- 1.Woolgar JA, Triantafyllou A. A histopathological appraisal of surgical margins in oral and oropharyngeal cancer resection specimens. Oral Oncol. 2005;41:1034–1043. doi: 10.1016/j.oraloncology.2005.06.008. [DOI] [PubMed] [Google Scholar]
- 2.Ravasz LA, Slootweg PJ, Hordijk GJ, Smit F, van der Tweel I. The status of the resection margin as a prognostic factor in the treatment of head and neck carcinoma. J Craniomaxillofac Surg. 1991;19:314–318. doi: 10.1016/s1010-5182(05)80339-7. [DOI] [PubMed] [Google Scholar]
- 3.Gleysteen JP, Newman JR, Chhieng D, Frost A, Zinn KR, Rosenthal EL. Fluorescent labeled anti-EGFR antibody for identification of regional and distant metastasis in a preclinical xenograft model. Head Neck. 2008;30:782–789. doi: 10.1002/hed.20782. [DOI] [PMC free article] [PubMed] [Google Scholar]
- 4.Kulbersh BD, Duncan RD, Magnuson JS, Skipper JB, Zinn K, Rosenthal EL. Sensitivity and specificity of fluorescent immunoguided neoplasm detection in head and neck cancer xenografts. Arch Otolaryngol Head Neck Surg. 2007;133:511–515. doi: 10.1001/archotol.133.5.511. [DOI] [PubMed] [Google Scholar]
- 5.Keereweer S, Mieog JS, Mol IM, et al. Detection of oral squamous cell carcinoma and cervical lymph node metastasis using activatable near-infrared fluorescence agents. Archives of otolaryngology–head & neck surgery. 2011;137:609–615. doi: 10.1001/archoto.2011.89. [DOI] [PubMed] [Google Scholar]
- 6.Terwisscha van Scheltinga AG, van Dam GM, Nagengast WB, et al. Intraoperative near-infrared fluorescence tumor imaging with vascular endothelial growth factor and human epidermal growth factor receptor 2 targeting antibodies. J Nucl Med. 2011;52:1778–1785. doi: 10.2967/jnumed.111.092833. [DOI] [PubMed] [Google Scholar]
- 7.van Dam GM, Themelis G, Crane LM, et al. Intraoperative tumor-specific fluorescence imaging in ovarian cancer by folate receptor-alpha targeting: first in-human results. Nat Med. 2011;17:1315–1319. doi: 10.1038/nm.2472. [DOI] [PubMed] [Google Scholar]
- 8.Hilderbrand SA, Weissleder R. Near-infrared fluorescence: application to in vivo molecular imaging. Curr Opin Chem Biol. 2010;14:71–79. doi: 10.1016/j.cbpa.2009.09.029. [DOI] [PubMed] [Google Scholar]
- 9.Ogawa M, Kosaka N, Choyke PL, Kobayashi H. In vivo molecular imaging of cancer with a quenching near-infrared fluorescent probe using conjugates of monoclonal antibodies and indocyanine green. Cancer Res. 2009;69:1268–1272. doi: 10.1158/0008-5472.CAN-08-3116. [DOI] [PMC free article] [PubMed] [Google Scholar]
- 10.Pleijhuis RG, Langhout GC, Helfrich W, et al. Near-infrared fluorescence (NIRF) imaging in breast-conserving surgery: assessing intraoperative techniques in tissue-simulating breast phantoms. Eur J Surg Oncol. 2011;37:32–39. doi: 10.1016/j.ejso.2010.10.006. [DOI] [PubMed] [Google Scholar]
- 11.Themelis G, Harlaar NJ, Kelder W, et al. Enhancing surgical vision by using real-time imaging of alphavbeta3-integrin targeted near-infrared fluorescent agent. Ann Surg Oncol. 2011;18:3506–3513. doi: 10.1245/s10434-011-1664-9. [DOI] [PubMed] [Google Scholar]
- 12.Frangioni JV. New technologies for human cancer imaging. J Clin Oncol. 2008;26:4012–4021. doi: 10.1200/JCO.2007.14.3065. [DOI] [PMC free article] [PubMed] [Google Scholar]
- 13.Sampath L, Kwon S, Ke S, et al. Dual-labeled trastuzumab-based imaging agent for the detection of human epidermal growth factor receptor 2 overexpression in breast cancer. J Nucl Med. 2007;48:1501–1510. doi: 10.2967/jnumed.107.042234. [DOI] [PubMed] [Google Scholar]
- 14.Foersch S, Kiesslich R, Waldner MJ, et al. Molecular imaging of VEGF in gastrointestinal cancer in vivo using confocal laser endomicroscopy. Gut. 2010;59:1046–1055. doi: 10.1136/gut.2009.202986. [DOI] [PubMed] [Google Scholar]
- 15.Gao J, Chen K, Miao Z, et al. Affibody-based nanoprobes for HER2-expressing cell and tumor imaging. Biomaterials. 2011;32:2141–2148. doi: 10.1016/j.biomaterials.2010.11.053. [DOI] [PMC free article] [PubMed] [Google Scholar]
- 16.Ogawa M, Regino CA, Seidel J, et al. Dual-modality molecular imaging using antibodies labeled with activatable fluorescence and a radionuclide for specific and quantitative targeted cancer detection. Bioconjug Chem. 2009;20:2177–2184. doi: 10.1021/bc900362k. [DOI] [PMC free article] [PubMed] [Google Scholar]
- 17.von Burstin J, Eser S, Seidler B, et al. Highly sensitive detection of early-stage pancreatic cancer by multimodal near-infrared molecular imaging in living mice. Int J Cancer. 2008;123:2138–2147. doi: 10.1002/ijc.23780. [DOI] [PubMed] [Google Scholar]
- 18.Soltesz EG, Kim S, Laurence RG, et al. Intraoperative sentinel lymph node mapping of the lung using near-infrared fluorescent quantum dots. Ann Thorac Surg. 2005;79:269–277. doi: 10.1016/j.athoracsur.2004.06.055. discussion 269–277. [DOI] [PMC free article] [PubMed] [Google Scholar]
- 19.Nimura H, Narimiya N, Mitsumori N, Yamazaki Y, Yanaga K, Urashima M. Infrared ray electronic endoscopy combined with indocyanine green injection for detection of sentinel nodes of patients with gastric cancer. Br J Surg. 2004;91:575–579. doi: 10.1002/bjs.4470. [DOI] [PubMed] [Google Scholar]
- 20.Parungo CP, Ohnishi S, De Grand AM, et al. In vivo optical imaging of pleural space drainage to lymph nodes of prognostic significance. Ann Surg Oncol. 2004;11:1085–1092. doi: 10.1245/ASO.2004.03.054. [DOI] [PubMed] [Google Scholar]
- 21.Crane LM, Themelis G, Arts HJ, et al. Intraoperative near-infrared fluorescence imaging for sentinel lymph node detection in vulvar cancer: first clinical results. Gynecol Oncol. 2011;120:291–295. doi: 10.1016/j.ygyno.2010.10.009. [DOI] [PubMed] [Google Scholar]
- 22.Crane LM, Themelis G, Pleijhuis RG, et al. Intraoperative multispectral fluorescence imaging for the detection of the sentinel lymph node in cervical cancer: a novel concept. Mol Imaging Biol. 2011;13:1043–1049. doi: 10.1007/s11307-010-0425-7. [DOI] [PMC free article] [PubMed] [Google Scholar]
- 23.van de Ven S, Wiethoff A, Nielsen T, et al. A novel fluorescent imaging agent for diffuse optical tomography of the breast: first clinical experience in patients. Mol Imaging Biol. 2010;12:343–348. doi: 10.1007/s11307-009-0269-1. [DOI] [PMC free article] [PubMed] [Google Scholar]
- 24.Pomerantz RG, Grandis JR. The role of epidermal growth factor receptor in head and neck squamous cell carcinoma. Curr Oncol Rep. 2003;5:140–146. doi: 10.1007/s11912-003-0101-z. [DOI] [PubMed] [Google Scholar]
- 25.Bonner JA, Harari PM, Giralt J, et al. Radiotherapy plus cetuximab for squamous-cell carcinoma of the head and neck. N Engl J Med. 2006;354:567–578. doi: 10.1056/NEJMoa053422. [DOI] [PubMed] [Google Scholar]
- 26.Lofgren JA, Dhandapani S, Pennucci JJ, et al. Comparing ELISA and surface plasmon resonance for assessing clinical immunogenicity of panitumumab. J Immunol. 2007;178:7467–7472. doi: 10.4049/jimmunol.178.11.7467. [DOI] [PubMed] [Google Scholar]
- 27.Yang XD, Jia XC, Corvalan JR, Wang P, Davis CG. Development of ABX-EGF, a fully human anti-EGF receptor monoclonal antibody, for cancer therapy. Crit Rev Oncol Hematol. 2001;38:17–23. doi: 10.1016/s1040-8428(00)00134-7. [DOI] [PubMed] [Google Scholar]
- 28.Yan L, Hsu K, Beckman RA. Antibody-based therapy for solid tumors. Cancer J. 2008;14:178–183. doi: 10.1097/PPO.0b013e318172d71a. [DOI] [PubMed] [Google Scholar]
- 29.Ray GL, Baidoo KE, Wong KJ, et al. Preclinical evaluation of a monoclonal antibody targeting the epidermal growth factor receptor as a radioimmunodiagnostic and radioimmunotherapeutic agent. Br J Pharmacol. 2009;157:1541–1548. doi: 10.1111/j.1476-5381.2009.00327.x. [DOI] [PMC free article] [PubMed] [Google Scholar]
- 30.Nayak TK, Garmestani K, Milenic DE, Baidoo KE, Brechbiel MW. HER1-targeted 86Y-panitumumab possesses superior targeting characteristics than 86Y-cetuximab for PET imaging of human malignant mesothelioma tumors xenografts. PLoS One. 2011;6:e18198. doi: 10.1371/journal.pone.0018198. [DOI] [PMC free article] [PubMed] [Google Scholar]
- 31.Rosenthal EL, Kulbersh BD, Duncan RD, et al. In vivo detection of head and neck cancer orthotopic xenografts by immunofluorescence. Laryngoscope. 2006;116:1636–1641. doi: 10.1097/01.mlg.0000232513.19873.da. [DOI] [PubMed] [Google Scholar]
- 32.Rosenthal EL, Kulbersh BD, King T, Chaudhuri TR, Zinn KR. Use of fluorescent labeled anti-epidermal growth factor receptor antibody to image head and neck squamous cell carcinoma xenografts. Mol Cancer Ther. 2007;6:1230–1238. doi: 10.1158/1535-7163.MCT-06-0741. [DOI] [PubMed] [Google Scholar]
- 33.Leung K. In Molecular Imaging and Contrast Agent Database (MICAD) National Center for Biotechnology Information; Bethesda: 2004. BODIPY-FL-neutravidin-biotin-Cetuximab. [PubMed] [Google Scholar]
- 34.Biosciences L-C. IRDye(R) 800CW Protein Labeling Kit–High MW. LI-COR Biosciences; Lincoln: 2007. pp. 1–9. [Google Scholar]
- 35.Reuthebuch O, Haussler A, Genoni M, et al. Novadaq SPY: intraoperative quality assessment in off-pump coronary artery bypass grafting. Chest. 2004;125:418–424. doi: 10.1378/chest.125.2.418. [DOI] [PubMed] [Google Scholar]
- 36.Schneider CA, Rasband WS, Eliceiri KW. NIH Image to ImageJ: 25 years of image analysis. Nat Methods. 2012;9:671–675. doi: 10.1038/nmeth.2089. [DOI] [PMC free article] [PubMed] [Google Scholar]
- 37.Chung KY, Shia J, Kemeny NE, et al. Cetuximab shows activity in colorectal cancer patients with tumors that do not express the epidermal growth factor receptor by immunohistochemistry. J Clin Oncol. 2005;23:1803–1810. doi: 10.1200/JCO.2005.08.037. [DOI] [PubMed] [Google Scholar]
- 38.Milano G, Etienne-Grimaldi MC, Dahan L, et al. Epidermal growth factor receptor (EGFR) status and K-Ras mutations in colorectal cancer. Ann Oncol. 2008;19:2033–2038. doi: 10.1093/annonc/mdn416. [DOI] [PMC free article] [PubMed] [Google Scholar]
- 39.Heath CH, Deep NL, Sweeny L, Zinn KR, Rosenthal EL. Use of Panitumumab-IRDye800 to image microscopic head and neck cancer in an orthotopic surgical model. Ann Surg Oncol. 2012;19:3879–3887. doi: 10.1245/s10434-012-2435-y. [DOI] [PMC free article] [PubMed] [Google Scholar]
- 40.Leemans CR, Braakhuis BJ, Brakenhoff RH. The molecular biology of head and neck cancer. Nat Rev Cancer. 2011;11:9–22. doi: 10.1038/nrc2982. [DOI] [PubMed] [Google Scholar]
- 41.Perez-Ordonez B, Beauchemin M, Jordan RC. Molecular biology of squamous cell carcinoma of the head and neck. J Clin Pathol. 2006;59:445–453. doi: 10.1136/jcp.2003.007641. [DOI] [PMC free article] [PubMed] [Google Scholar]
- 42.Kim ES, Khuri FR, Herbst RS. Epidermal growth factor receptor biology (IMC-C225) Curr Opin Oncol. 2001;13:506–513. doi: 10.1097/00001622-200111000-00014. [DOI] [PubMed] [Google Scholar]
- 43.Helman EE, Newman JR, Dean NR, Zhang W, Zinn KR, Rosenthal EL. Optical imaging predicts tumor response to anti-EGFR therapy. Cancer Biol Ther. 2010;10:166–171. doi: 10.4161/cbt.10.2.12164. [DOI] [PMC free article] [PubMed] [Google Scholar]
- 44.Sharafinski ME, Ferris RL, Ferrone S, Grandis JR. Epidermal growth factor receptor targeted therapy of squamous cell carcinoma of the head and neck. Head Neck. 2010;32:1412–1421. doi: 10.1002/hed.21365. [DOI] [PMC free article] [PubMed] [Google Scholar]
- 45.Gleysteen JP, Duncan RD, Magnuson JS, Skipper JB, Zinn K, Rosenthal EL. Fluorescently labeled cetuximab to evaluate head and neck cancer response to treatment. Cancer Biol Ther. 2007;6:1181–1185. doi: 10.4161/cbt.6.8.4379. [DOI] [PubMed] [Google Scholar]
- 46.Keereweer S, Mol IM, Kerrebijn JD, et al. Targeting integrins and enhanced permeability and retention (EPR) effect for optical imaging of oral cancer. J Surg Oncol. 2012;105:714–718. doi: 10.1002/jso.22102. [DOI] [PubMed] [Google Scholar]
- 47.Day KE, Beck LN, Deep NL, Kovar J, Zinn KR, Rosenthal EL. Fluorescently labeled therapeutic antibodies for detection of microscopic melanoma. Laryngoscope. 2013 doi: 10.1002/lary.24102. doi:. doi:10.1002/lary.24102. [DOI] [PMC free article] [PubMed] [Google Scholar]
- 48.Lipsky MS, Sharp LK. From idea to market: the drug approval process. J Am Board Fam Pract. 2001;14:362–367. [PubMed] [Google Scholar]
- 49.Newman JR, Gleysteen JP, Baranano CF, et al. Stereomicroscopic fluorescence imaging of head and neck cancer xenografts targeting CD147. Cancer Biol Ther. 2008;7:1063–1070. doi: 10.4161/cbt.7.7.6109. [DOI] [PMC free article] [PubMed] [Google Scholar]
- 50.Withrow KP, Newman JR, Skipper JB, et al. Assessment of bevacizumab conjugated to Cy5.5 for detection of head and neck cancer xenografts. Technol Cancer Res Treat. 2008;7:61–66. doi: 10.1177/153303460800700108. [DOI] [PubMed] [Google Scholar]
- 51.Keereweer S, Kerrebijn JD, Mol IM, et al. Optical imaging of oral squamous cell carcinoma and cervical lymph node metastasis. Head Neck. 2012;34:1002–1008. doi: 10.1002/hed.21861. [DOI] [PubMed] [Google Scholar]
- 52.Shan L, Hao Y, Wang S, et al. Visualizing head and neck tumors in vivo using near-infrared fluorescent transferrin conjugate. Mol Imaging. 2008;7:42–49. [PubMed] [Google Scholar]
- 53.Hadjipanayis CG, Jiang H, Roberts DW, Yang L. Current and future clinical applications for optical imaging of cancer: from intraoperative surgical guidance to cancer screening. Semin Oncol. 2011;38:109–118. doi: 10.1053/j.seminoncol.2010.11.008. [DOI] [PMC free article] [PubMed] [Google Scholar]
- 54.Calabi F, Neuberger MS. Molecular genetics of immunoglobulin. Elsevier; Amsterdam: 1987. [Google Scholar]
- 55.Alvarenga ML, Kikhney J, Hannewald J, et al. In-depth biophysical analysis of interactions between therapeutic antibodies and the extracellular domain of the epidermal growth factor receptor. Anal Biochem. 2012;421:138–151. doi: 10.1016/j.ab.2011.10.039. [DOI] [PubMed] [Google Scholar]