Abstract
The balance between nephron progenitor cell (NPC) renewal, survival and differentiation ultimately determines nephron endowment and thus susceptibility to chronic kidney disease and hypertension. Embryos lacking the p53-E3 ubiquitin ligase, Murine double minute 2 (Mdm2), die secondary to p53-mediated apoptosis and growth arrest, demonstrating the absolute requirement of Mdm2 in embryogenesis. Although Mdm2 is required in maintenance of hematopoietic stem cells, its role in renewal and differentiation of stem/progenitor cells during kidney organogenesis is not well defined. Here we examine the role of the Mdm2-p53 pathway in NPC renewal and fate in mice. The Six2-GFP::Cretg/+ mediated inactivation of Mdm2 in the NPC (NPCMdm2−/−) results in perinatal lethality. NPCMdm2−/− neonates have hypodysplastic kidneys, patchy depletion of the nephrogenic zone and pockets of superficially placed, ectopic, well-differentiated proximal tubules. NPCMdm2−/− metanephroi exhibit thinning of the progenitor GFP+/Six2+ population and a marked reduction or loss of progenitor markers Amphiphysin, Cited1, Sall1 and Pax2. This is accompanied by aberrant accumulation of phospho-γH2AX and p53, and elevated apoptosis together with reduced cell proliferation. E13.5–E15.5 NPCMdm2−/− kidneys show reduced expression of Eya1, Pax2 and Bmp7 while the few surviving nephron precursors maintain expression of Wnt4, Lhx1, Pax2, and Pax8. Lineage fate analysis and section immunofluorescence revealed that NPCMdm2−/− kidneys have severely reduced renal parenchyma embedded in an expanded stroma. Six2-GFP::Cretg/+;Mdm2f/f mice bred into a p53 null background ensures survival of the GFP-positive, self-renewing progenitor mesenchyme and therefore restores normal renal development and postnatal survival of mice. In conclusion, the Mdm2-p53 pathway is essential to the maintenance of the nephron progenitor niche.
Keywords: Metanephric kidney, Nephron progenitor cells, cap mesenchyme, Mdm2, p53
Introduction
The total endowment of nephrons is species specific and is completed either before or around birth (Hendry et al., 2011). Renal hypodysplasia (RHD) involving reduced nephron numbers and smaller disorganized kidneys is a congenital anomaly accounting for 20% of pediatric end-stage renal disease. The resulting renal insufficiency predisposes individuals to hypertension, glomerulosclerosis and chronic kidney disease (Keller et al., 2003; Myrie et al., 2011; Walker and Bertram, 2011). Mutations in some of the prominent renal development genes such as TCF2, PAX2, EYA1, SALL1 and SIX1 have been linked to RHD associated chronic renal insufficiency (Weber et al., 2006).
In the definitive mouse kidney, the metanephric mesenchyme becomes specified into the stromal mesenchyme and the non-homogenous cap mesenchyme (CM) between E11.0–E11.5 (Kobayashi et al., 2008). The nephron progenitor cells (NPCs) are Six2+/Cited1+ and reside exclusively within the CM on the dorsal/cortical aspect of the branching UB tips. The NPCs within this niche although self-renewing, stay poised for differentiation/epithelialization when exposed to appropriate inducing factors such as the Wnts. Cited1 expression is downregulated with epithelial differentiation and formation of small mesenchymal aggregates (PTA, pre-tubular aggregates) ventro-lateral to the UB tips. The PTAs continue to express low levels of Six2 in addition to Wnt4. The process of mesenchymal to epithelial transition converts the PTA into a renal vesicle (RV) which begins to express other epithelial markers in addition to Wnt4, among them Lef1, and Pea3 (Mugford et al., 2009; Park et al., 2007). Each RV ‘transforms’ sequentially into comma-shaped and s-shaped bodies via the processes of elongation, segmentation, and patterning and ultimately forms a nephron. Multiple secreted factors (e.g., Fgf20, Fgf9, Fgf2, Bmp7, Wnt9b) and transcription factors (such as Osr1, Eya1, Pax2, Six1/4/2, Sall1) act coordinately to ensure the survival and renewal of the NPCs long enough to establish the full complement of nephrons by birth (Barak et al., 2012; Blank et al., 2009; Brown et al., 2011; Denner and Rauchman, 2013; Hendry et al., 2011; Oxburgh et al., 2011). This is achieved by balancing self-renewal and commitment/differentiation processes to form the requisite nephron numbers prior to the depletion of the NPCs within the niche.
Mdm2 is an E3 ubiquitin ligase which targets the tumor suppressor protein p53 for proteosomal degradation. The pro-survival role of Mdm2 has been reported in the context of both normal tissue development and in malignancies. Das et al. (Das et al., 2012) reported that elevated Mdm2 coupled to low p53 is permissive to maintaining the ‘stemness’ of human embryonic stem cells following oxidative stress. The corollary being that elevated levels of p53 following oxidative stress/hypoxia results in cell death or differentiation. Negative regulation of p53 function was also important to ensure the survival of neuronal progenitors (Francoz et al., 2006). It was demonstrated that the suppression of p53 functions by Mdm2 is necessary for the self-renewal and proliferation of intestinal progenitor cells in mouse neonates (Valentin-Vega et al., 2008). In this study we examine the role of Mdm2 in NPC renewal and commitment to differentiation within the developing mouse kidney.
Materials and Methods
Animals
All experiments involving mice were conducted in compliance with guidelines outlined by the institutional IACUC. Mice harboring the Six2-GFP::Cretg/+ transgene were a kind gift from Dr. A. P. McMahon. The Mdm2f/f mice (01XH9, Dr. Mary Ellen Perry) and the p53f/f mice (008462, generated by Dr. Anton Berns) were obtained from the NCI mouse repository (Frederick, MD), while the conventional p53−/− mice as well as the R26-tdTomato reporter strain ((007909 Hongkui Zeng) was purchased from the Jackson Laboratory (Maine, USA). The specifications for genotyping were furnished by the respective contributors of animals. All animals in this study were maintained on a mixed background. The Six2-GFP::Cretg/+;Mdm2flox/+ mice were bred to Mdm2flox/flox mice in the experimental breedings. The age of embryos in timed matings were approximated by designating noon of the day the vaginal plug was detected as embryonic (E) day 0.5. For the rescue experiments we bred Six2-GFP::Cretg/+; p53flox/+;Mdm2flox/+ mice to p53+/−;Mdm2flox/flox mice.
Gross morphology
Phase images of the kidneys were captured with a SMZ1000 stereomicroscope fitted with DS-Fi1 camera enabled by the NIS-Elements F2.20 software.
Histology
Routine Hematoxylin and Eosin staining (Richard Allan Scientific) was performed on age matched wild type and mutant kidney sections (4 microns thick). The protocol used was as per the manufacturer’s instructions.
Quantitative reverse transcriptase–PCR
Quantitative reverse transcriptase–PCR was performed on total RNA isolated from E14.5 kidneys from littermate embryos representing the genotypes_ NPCMdm2+/+, NPCMdm2+/−, NPCMdm2−/− using the RNeasy Mini Kit (Qiagen). Real-time primer-probe mixes were ordered from Applied Biosystems (Table 1). qRT-PCR was done using the Taqman RNA-to-CT 1step kit (4392938; Applied Biosystems, New York, U.S.A). The thermal profile used was as follows: 48 °C for 15 min, 95 °C for 10min and 40 cycles of 95 °C for 15 s, 55 °C for 1 min and 72 °C for 1 min. The reactions were performed in triplicate. The relative transcript levels were calculated using the ΔΔCt method with GAPDH as the endogenous normalizing gene. Three independent experiments using total RNA from kidneys of representative genotypes from age-matched litters were used in our assays. The scale bars represent the standard error of mean of average values. P value was calculated using the two-tailed Student’s T test with p<0.05 considered as significant.
Table 1.
List of primer-probe mix used for QRT-PCR:
| Gene Name | Catalog number | Exon boundary |
|---|---|---|
| Pax2 | Mm01217939_m1 | exons 8–9 |
| Wnt4 | Mm01194003_m1 | exons 1–2 |
| Fgf8 | Mm00438922_m1 | exons 5–6 /4–5 |
| Fgf9 | Mm01319105_m1 | exons 2–3 |
| Wnt9b | Mm00457102_m1 | exons 3–4 |
| Fgf7 | Mm00433291_m1 | exons 2–3 |
| Bmp7 | Mm00432102_m1 | exons 3–4 |
| Eya1 | Mm00438796_m1 | exons 8–9/9–10 |
| Gdnf | Mm00599849_m1 | exons 1–2 |
| 60XGAPDH VIC PL | 99999915_g1 |
Immunostaining
Tissues were fixed in 10% formalin at 4°C and dehydrated prior to paraffin embedding. Four micron tissue sections were cleared in xylene and rehydrated in a graded series of ethanol prior to antigen retrieval in 10mM Sodium Citrate (pH6.0). Endogenous peroxidase was quenched by incubating slides in 3% hydrogen peroxide at room temperature. Sections were blocked for 90min at room temperature in 0.5% blocking reagent (Perkin-Elmer FP1012) in Tris-buffered saline supplemented with 10% normal donkey serum together with unconjugated, monovalent donkey anti-Rabbit Fab (711-007-003 Jackson immunoresearch laboratories, Inc., PA) and donkey anti-Mouse Fab (715-007-003) fragments at 15ul/ml each. The primary antibodies used are listed in Table 2.
Table 2.
List of antibodies used in the immunostaining assays
| Primary Antibody | Cat# | Source | Working Dilution | Method |
|---|---|---|---|---|
| Mouse anti-E-cadherin | 610181 | BD Biosciences | 1:100 | IF |
| Rabbit anti Six2 | 11562-1-AP | Proteintech group | 1:200 | IF |
| DAPI | D1306 | Invitrogen | 1:400 | IF |
| LTA | FL-1321 | Vector Laboratories | 1:100 | IF |
| Rabbit anti- Cleaved PARP (D214) | 9544S | Cell Signaling | 1:200 | IF withTSA |
| Rabbit mAb to Beta-catenin (6B3) | 9582S | Cell Signaling | 1:800 | IF withTSA |
| Rabbit anti AGT | Gift:Dr. John Chan | Univ. of Montreal; Quebec, Canada | 1:100 | IF |
| Chicken anti GFP | ab13970 | Abcam | 1:400 | IF |
| Rabbit anti-p53 | NCl-p53-CM5p | Leica Novacastra | 1:200 | DAB |
| Rabbit anti-CITED1 | RB-9219-P | Thermo Scientific | 1:50(30' RT) | DAB and IF |
| Rabbit anti-Pax2 | 716000 | Invitrogen | 1:100 | IF |
| Goat anti-AQP2 (C17) | sc-9882 | Santa Cruz | 1:100 | IF |
| Rabbit anti WT1 (C-19) | sc-192 | Santa Cruz | 1:100 | IF |
| Mouse mAb to MEIS1/2/3 (Clone9.2.7) | 39795 | Active Motif | 1:100 | IF withTSA |
| Mosue anti-Lhx1 | 4F2-c | DHB | 1:100 | IF withTSA |
| Rabbit anti-pHistone H3 (S10) | 9701S | Cell Signaling | 1:100 | IF |
| Rabbit anti Cleaved Caspase3 (D175) | 9661s | Cell Signaling | 1:100 | IF |
| Rabbit anti Laminin | L9393 | Sigma | 1:100 dil | IF |
| Goat polyclonal anti-DsRed (C-20) | sc-33354 | Santa Cruz | 1:200 | IF |
| Rabbit anti-amphiphysin | 13379-1-AP | Proteintech | 1:200 dil | IF |
| Mouse Anti-Six2 mAb (0.1mg) | H00010736-M01 | Abnova | 1:100 | IF withTSA |
| Rabbit anti-WT1 | ab15249 | Abcam | (1:100) | IF |
| Rabbit anti-Sal 1 | Gift: Dr. M. Rauchman/Susan Kiefer | St. Louis Univ. HSC, Missouri, U.S. A | 1:1000 dil | IF |
| Mouse anti-NCAM | C9672 | Sigma | 1:200 | IF |
| Rabbit anti-H2AX gamma (pS139) | ab11174 | Abcam | 1:100 | IF |
| Mouse anti-Six2 Mab | H00010736-M01 | Abnova | 1:100 | IF |
For secondary detection we used donkey anti-rabbit, donkey anti-mouse, donkey antigoat or goat anti-chicken as was required and conjugated to one of the following Alexafluor dyes_ AlexaFluor555, AlexaFluor488 or AlexaFluor 647 (Molecular Probes, Invitrogen). For IF using Tyramide Signal Amplification we used the TSA fluorescence kit (Perkin Elmer NEL760001KT) as per the manufacturer’s recommendations.
Images were captured using the deconvolution Olympus (IX51) microscope using the Metamorph software version 7.0 (Molecular Devices Corporation, U.S.A). For DAB detection we used the peroxidase based Vectastain ABC elite kit (Vector laboratories, Inc.CA) or peroxidase conjugated ImmPRESS REAGENT anti-Rabbit Ig (MP-7401, Vector Labs) and the chromagen kit Vector NovaRed Substrate Kit (SK4800, Vector Labs).
TUNEL assay
Recombinant Terminal Deoxynucleotidyl transferase (rTdT) mediated nick-end labeling (TUNEL) was performed using the Dead End Fluorometric Tunel System (Promega) according to the manufacturer's guidelines. Briefly, four-micron paraffin sections were incubated in proteinase K at 20 µg/ml for 8–10 min at room temperature. The sections were pre and post-fixed in paraformaldehyde. The sections were incubated with the nucleotide mixture which included fluorescein-tagged dUTP and rTdT enzyme for an hour at 37 °C. The slides were incubated in DAPI (Vector Laboratories,Inc) at 1:500 working dilution for 15 min at room temperature. Quantitative analysis of apoptotic foci to area ratio was determined using Slidebook 4.1 (Digital Microscopy Software).
In situ hybridization
The protocol used was described previously (Hilliard et al., 2011; Saifudeen et al., 2009). The samples were fixed overnight in 4% PFA/PBS and then dehydrated through a graded alcohol series before paraffin embedding. Sections were cut to 10-micron thickness. The non-radioactive RNA probes carried a digoxigenin label which was detected using anti-digoxigenin Fab fragments coupled to alkaline phosphatase (Roche Diagnostics). BM purple was used as the chromogenic substrate for Alkaline Phosphatase.
Results
Metanephric development requires functional Mdm2
As is detailed in our earlier publication (Hilliard et al., 2011), Mdm2, is expressed ubiquitously in the embryonic kidney at E14.5. Accordingly, it is detected in the branching ureteric bud (UB), the cap mesenchyme (CM), nephron intermediates, as well as in the stroma ((Hilliard et al., 2011) and Supplemental Fig. 1). Previously, we showed that Mdm2 regulation of p53 is indispensable for the formation of the renal collecting duct in the embryonic kidney (Hilliard et al., 2011).
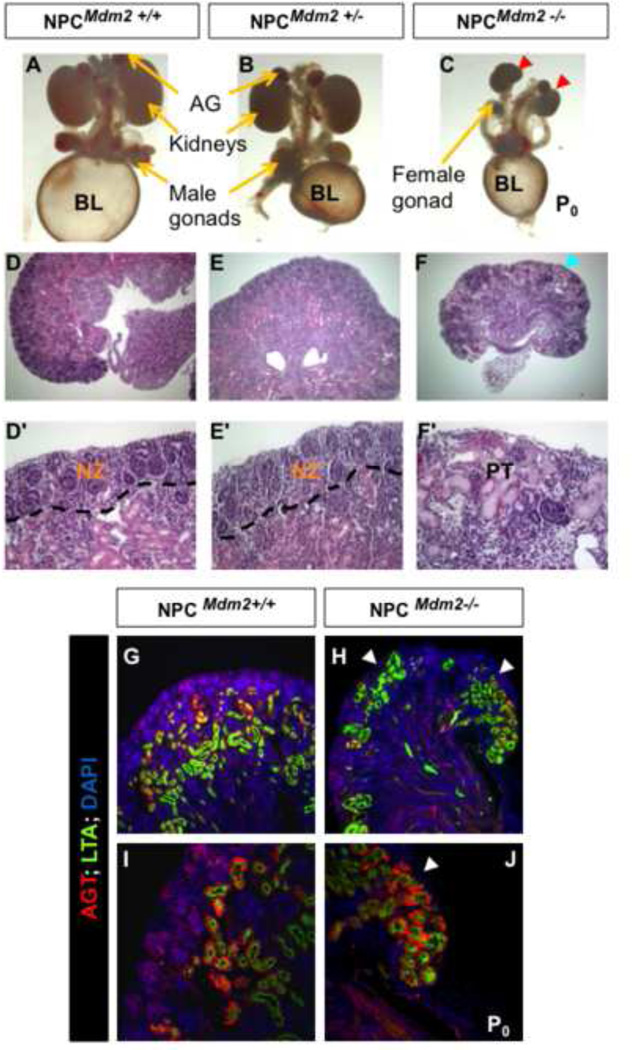
In the present study, we examined the functional contribution of Mdm2 to the process of nephrogenesis. This was accomplished by a Six2-GFP::Cretg (Park et al., 2007) mediated inactivation of floxed Mdm2 alleles in the Six2+ nephrogenic niche. The Six2-GFP::Cretg; Mdm2F/F mice (hereafter referred to as NPCMdm2−/−) were born at normal Mendelian ratios but died within the first few days of birth owing to severe renal malformation. The NPCMdm2−/− kidneys were small and hypo-dysplastic with an undulating contour (with crests and troughs) compared to wild type littermate controls (NPCMdm2+/+) (Fig. 1 A–F, D'-F'). Assessment of their histology revealed that these undulations coincided with pronounced, precocious depletion of the nephrogenic zone in the ‘trough-like’ regions of the mutant kidneys (Fig. 1 F, F’). This is reminiscent of the renal phenotype reported in Fgf9+/−; Fgf20βgalβgal compound mutant mice (Barak et al., 2012). Secondarily, the proximal tubules (LTA+, AGT+) were superficially displaced in the neonatal NPCMdm2−/− kidneys (Fig. 1H, J). Normally, this occurs postnatally around P3 -P4 in the mouse following the cessation of nephrogenesis and the depletion of all nephrogenic progenitors (Rumballe et al., 2011). These proximal tubules acquire some segmental maturation since they are AGT positive but occur as disorganized clusters in the conditionally null mutant kidneys (Fig. 1 G–J).
Figure 1. Loss of Mdm2 function in the Six2 expressing nephron precursor cells (NPCs) cause bilateral renal hypodysplasia.
(A–C) Gross morphology of the urogenital system from control NPCMdm2+/+ (A), NPCMdm2+/− (B), and NPCMdm2−/− embryos (C). Note the much smaller kidneys (red arrow heads) in C. (D–F, D'–F') H & E staining of kidney sections from control (D, D'), NPCMdm2+/− (E, E'), and NPCMdm2−/− (F, F') embryos reveals regionalized loss of the nephrogenic zone in the NPCMdm2−/− mutant kidneys (arrowhead in panel F). BL, urinary bladder; NZ, Nephrongenic zone; PT, proximal tubules.
G–J Cortical displacement of proximal tubules in the NPCMdm2−/− newborn kidneys. (G, I) NPCMdm2+/+ and (H, J) NPCMdm2−/− kidneys at P0. Co-staining for LTA and angiotensinogen (AGT) both markers of the proximal tubules reveals their ectopic distribution (white arrowheads in H, J) in the mutant kidneys. Differentiation and maturation of proximal tubules do not appear to be affected in the mutants.
Mdm2 supports the survival of NPCs within the cap mesenchyme
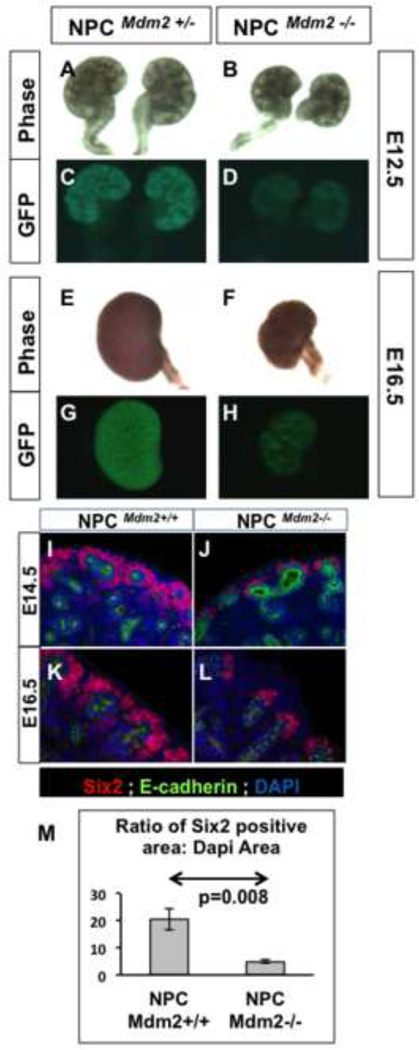
To better understand the basis for premature depletion of the nephrogenic zone in NPCMdm2−/− kidneys, we examined the mutant kidneys during organogenesis. Kobayashi et al (2008) have reported that the Six2-GFP::Cretg transgene is expressed in the CM from the onset of metanephric development at E10.5. We found strong GFP fluorescence confined to the CM in the heterozygous mutant kidneys (NPCMdm2+/−) at E12.5, E13.5 (not shown), and E16.5 (Fig. 2 C, G). By contrast, the GFP expression in the NPCMdm2−/− kidneys appeared weak and patchy, reminiscent of a smaller CM (Fig. 2 D, H). This apparent reduction of the CM was evident in the mutant kidneys at E11.75 and E12.5 by Six2 and Pax2 immuno-staining (Supplemental Fig. 2). By E14.5 there is a four-fold reduction in the Six2+ NPCs in the mutants compared to wild type kidneys (Fig. 2 I–M). The few surviving Six2+ cap cells form a thin layer on the dorsal aspect of the UB tips, failing to extend more ventrally as in Bmp7−/− mutant kidneys (Blank et al., 2009; Brown et al., 2013).
Figure 2. (A–H) Expression of the transgene, Six2-GFP::Cre at representative stages.
Phase and GFP fluorescence images of heterozygous (A, C, E, G) and homozygous mutant kidneys (B, D, F, H) at E12.5 (A–D) and E16.5 (E–H). The GFP fluorescence is detectable in the cap mesenchyme. The NPCMdm2−/− kidneys show much weaker GFP expression (D, H).
(I–M) NPCMdm2−/− kidneys show a noticeable reduction in the Six2-positive cells of the cap mesenchyme. Control and mutant kidney sections at E14.5 (I, J) and E16.5 (K, L) respectively, were stained for E-cadherin (green) and Six2 (red). Nuclei were stained with DAPI (blue). The Six2-positive cap mesenchyme was several layers thick and more robust in the controls (I, K) unlike the NPCMdm2−/− mutant kidneys which show a thinner cap, reduced to 1–2 cell layers in thickness. (M) A graph showing a four-fold difference in the Six2-staining area (normalized to the DAPI area) between control and mutant kidneys (p=0.008).
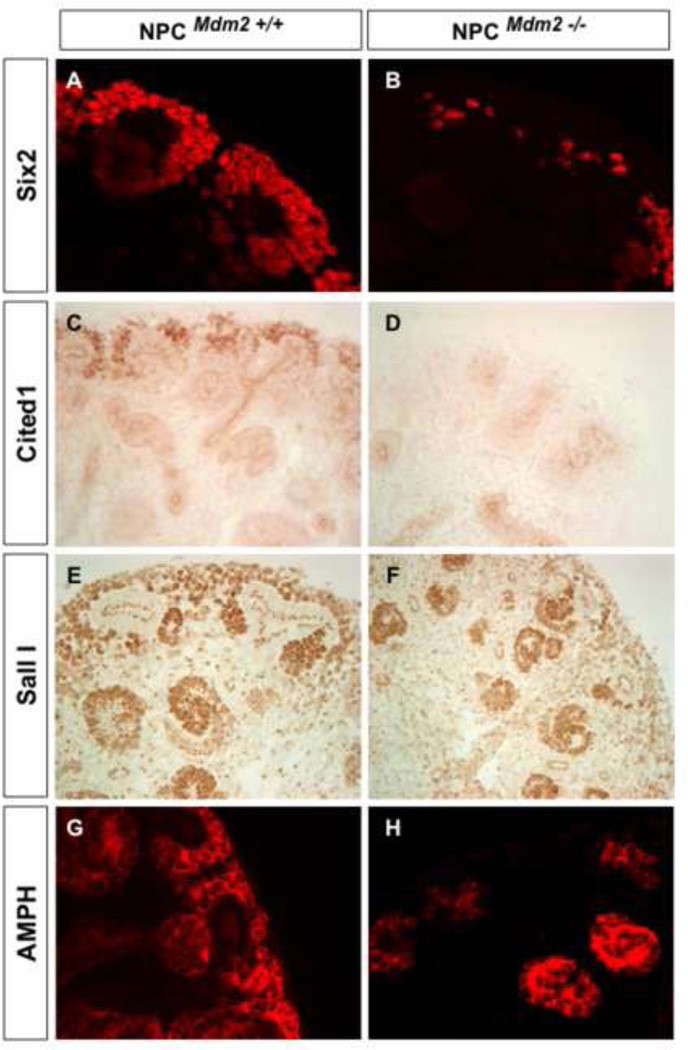
To determine if the loss of Six2 reflects a true depletion of the NPCs, we compared Cited1 expression in wild type and NPCMdm2−/− kidneys. The combined expression of Six2 and Cited1 marks the NPCs. Immuno-staining revealed a dramatic reduction of Cited1 expression in NPCMdm2−/− kidneys at E14.5 (Fig. 3C and 3D). Thus the NPCMdm2−/− kidneys showed a significant loss of the Six2+ Cited+ NPC subpopulation within the CM. Staining for other markers of the metanephric mesenchyme such as Amphiphysin (Karner et al., 2011), and Sall1 (Nishinakamura et al., 2001) corroborated the regionalized depletion of the dorsal cap mesenchyme cell population at E14.5 (Fig. 3E–3H).
Figure 3. Significant loss of key molecular markers of the self-renewing nephron progenitor population in NPCMdm2−/− kidneys at E14.5.
Comparison of Six2 (A, B), Cited1 (C, D), Sall I (E, F), and Amphiphysin (G, H) staining in NPCMdm2+/+ (A, C, E, G) and NPCMdm2−/− (B, D, F, H) littermate kidneys.
Conditional inactivation of Mdm2 upregulates p53 and DNA damage in the NPCs
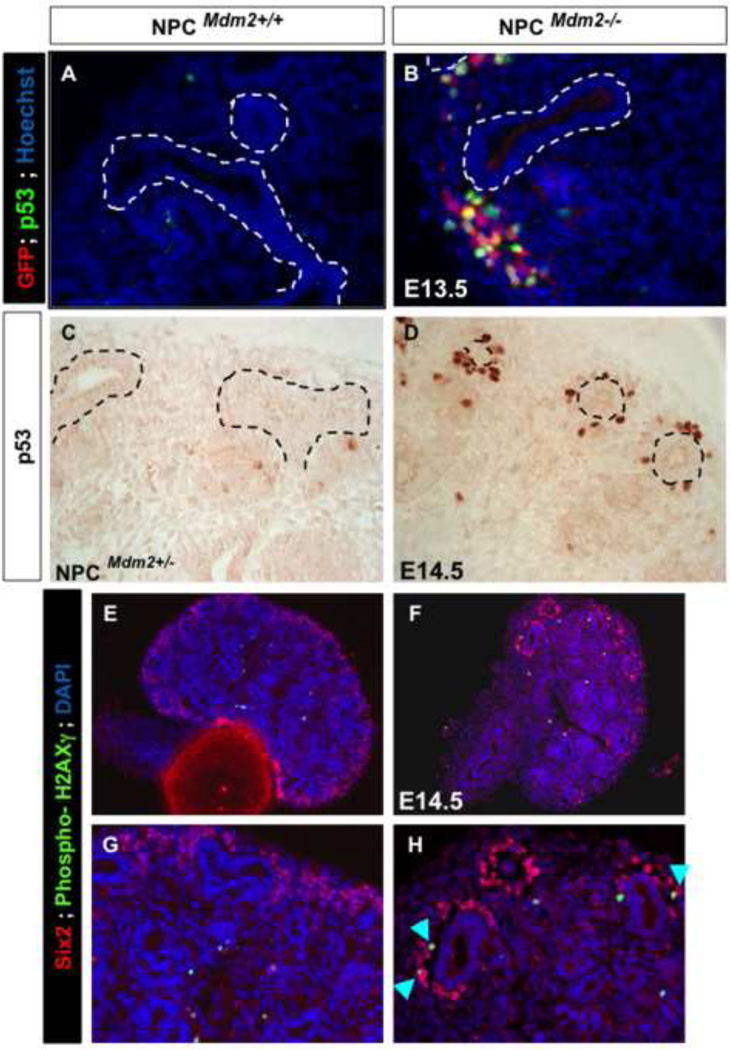
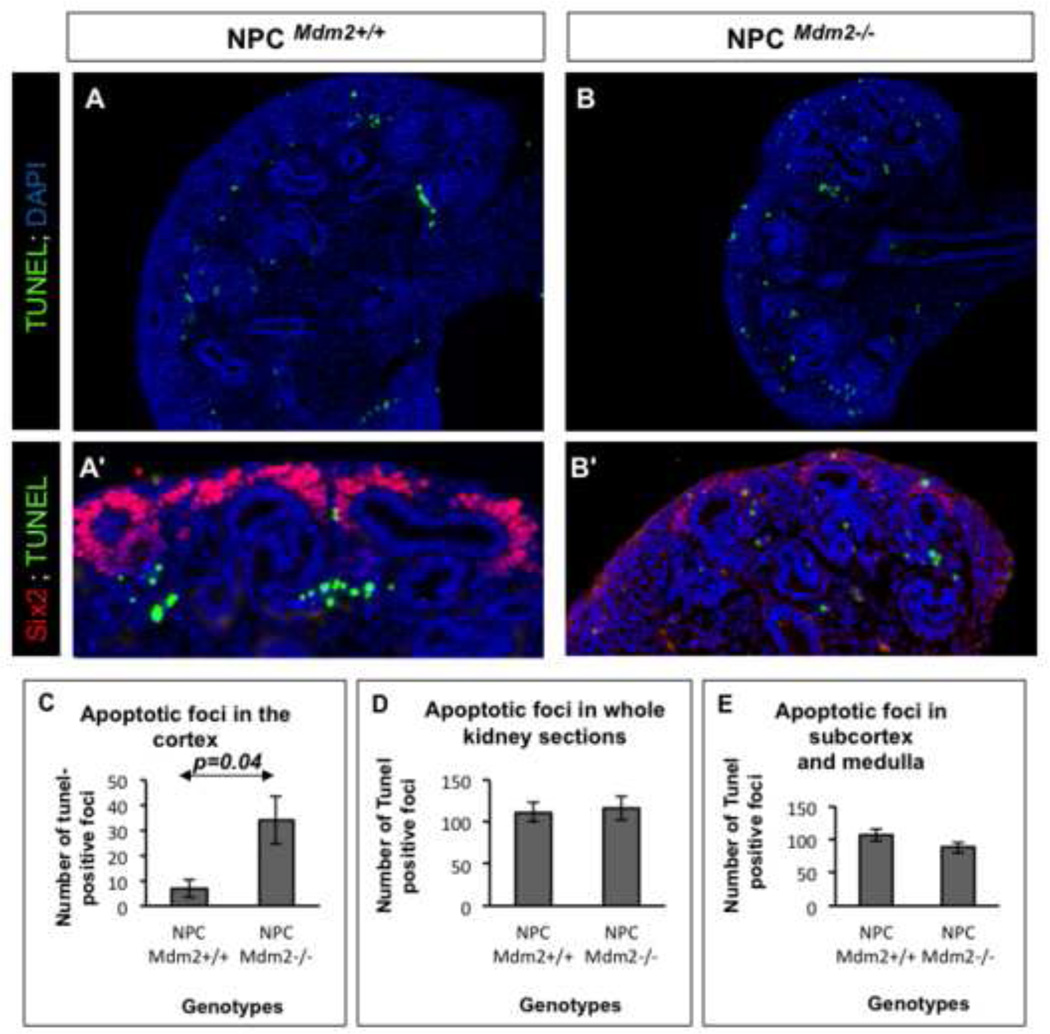
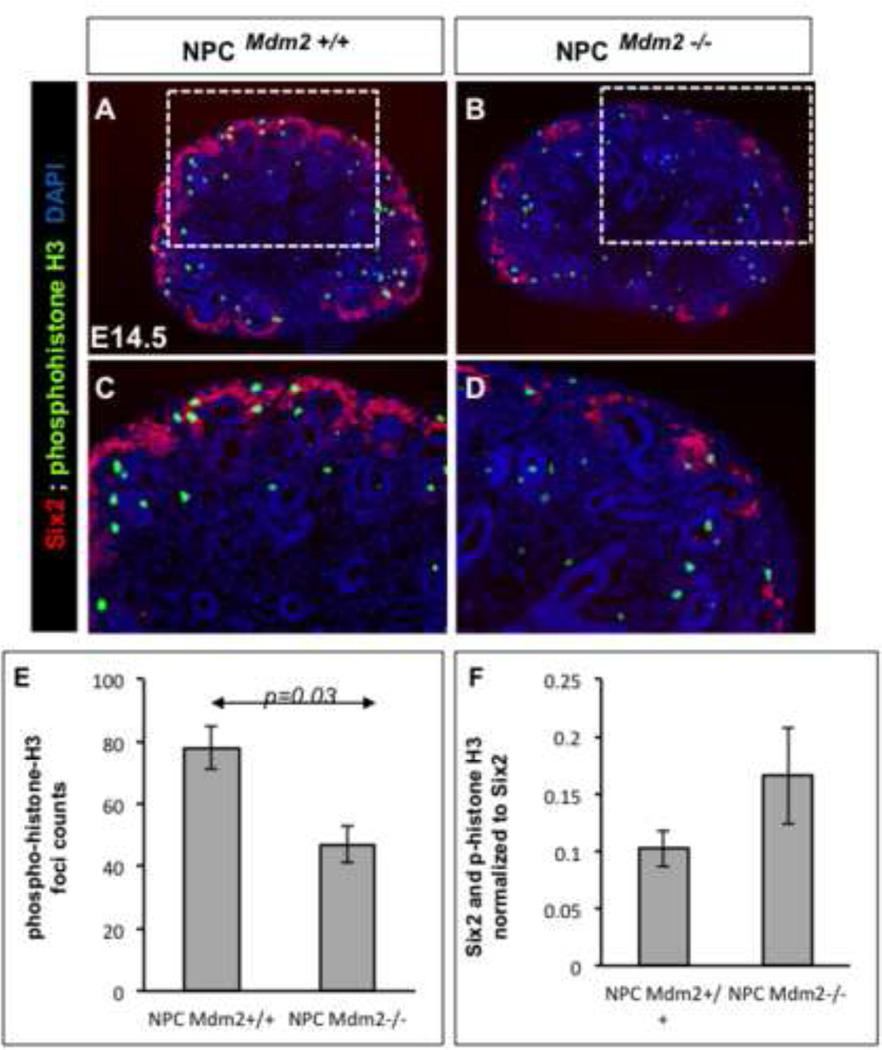
Mdm2, an E3 ubiquitin ligase, has a prominent role in the regulation of p53 stability and half-life by targeting it for proteosomal degradation. Therefore, we examined the impact of CM-specific loss of Mdm2 on p53 expression levels. We observed a notable elevation in p53 immunoreactivity in the Six2 promoter driven GFP+ CM surrounding the UB branch tips at E13.5 (Fig. 4 A, B). Unlike the GFP expression which was confined to the CM, p53 was up-regulated in the CM as well as in the cells of the nascent nephrons derived from the cap (not shown). Thus the functional ablation of Mdm2 in the NPCs resulted in stabilization of p53 levels. Surprisingly, although Mdm2 is ubiquitously expressed (Supplemental Fig. 1) the elevation in p53 was punctate at E13.5 and at E14.5 (Fig 4A–D). This could be attributed to either the chimeric expression of the Six-GFP:: Cre transgene, or could be reflective of differences in p53 oscillations within the non-homogeneous CM. Next, we examined the cellular outcomes of persistent p53 levels. First, we looked for any evidence of double-stranded DNA breaks in the CM cells of mutant kidneys by staining for phosphorylated H2AXγ alongside Six2. Notably the mutant kidneys revealed cells that are Six2+ and phospo-H2AXγ+ indicative of cells that have sustained DNA damage (Fig. 4 E–H). Stabilization of p53 in response to genotoxic stress is known to result in cell cycle arrest, apoptosis or cellular senescence. Therefore, we examined the levels of cell apoptosis and cell proliferation in the mutant kidneys relative to littermate wild type controls at E14.5 (Figs. 5 and 6). Quantitation of TUNEL positive foci in whole kidney sections was similar in NPCMdm2+/+ and NPCMdm2−/− mice (Fig. 5 D). However, the spatial distribution of apoptotic foci was remarkably different between the two (Fig. 5 A–E)). In mutant kidneys, the apoptotic cells were primarily distributed in the cortical, nephrogenic zone; the NPCMdm2−/− kidney sections have 4.9 fold more apoptotic cells in the cortex relative to the NPCMdm2+/+ kidneys, p=0.04 (Fig. 5E). In comparison, subcortical and medullary regions showed no significant differences in apoptosis in mutants and controls. Our observation on cell apoptosis was further corroborated by co-staining for Six2 or pan-cytokeratin and cleaved Parp-1, another marker of apoptosis (Supplemental Fig. 3). Immuno-staining for the mitotic cell marker, phospho-histone H3 (pHH3) revealed that Mdm2 loss in the Six2+ NPCs also resulted in reduced cell proliferation in the kidney as a whole (1.7 fold, Fig. 6). It should be noted that the combined pHH3- and Six2-positive foci when normalized to Six2-positive cells revealed no change in mitotic rates between the wild type control and mutant kidney.
Figure 4. The NPCMdm2−/− kidneys show accumulation of p53 protein as well as phospho-H2AXγ in the CM.
(A, B) E13.5 kidney sections from NPCMdm2−/− mice show elevated expression of p53 specifically in the CM cells which stain positively for GFP. Compared to NPCMdm2+/+ (not shown) and NPCMdm2+/− kidneys (C), the NPCMdm2−/− kidneys (D) continue to show a marked increase in p53 expression levels at E14.5. There is co-localization of Six2 and phospho-H2AXγ in NPCMdm2−/− but not in the control NPCMdm2+/+ kidneys (E–H, arrow heads in H).
Figure 5. (A–E). The NPCMdm2−/− kidneys show significant elevation in apoptosis by TUNEL assay.
Sections of E14.5 NPCMdm2+/+ kidneys (A) show largely subcortical apoptotic foci. By contrast, in the NPCMdm2−/− kidneys (B) there are numerous apoptotic foci in the cortical, nephrogenic zone including the dorsal aspect of ureteric bud tips. (A', B') Panels showing wild type and mutant kidney sections co-stained for Six2 following TUNEL assay to highlight the presence of apoptotic cells in the cap mesenchyme of only the latter. (C) A graph showing a significant increase (4.9 fold, p=0.04) in TUNEL-positive apoptotic foci in the cortical regions of NPCMdm2−/− kidneys relative to control kidneys. (D) Counts of apoptotic foci in complete kidney sections (cortex, sub-cortex, and medulla) or in regions interior to the cortex remain unchanged or show an insignificant drop in apoptosis. (n= 7 animals per genotype)
Figure 6. Co-staining for Six2 and phospho-histoneH3 (pHH3) reveals fewer mitotic cells in the NPCMdm2−/− kidneys when compared to wild type controls.
Representative sections from control (A) and mutant (B) kidneys at E14.5. The boxed area in A and B are shown enlarged in C and D respectively. (E) A graph showing the average number of pHH3-positive foci in control and mutant kidney sections at E14.5 (1.7 fold change; T-test, p value=0.03). (F) Comparison of mitotic rates with respect to the Six2-positive cap mesenchyme shows no significant difference between control and mutant kidneys. (n=4 for NPCMdm2+/+ ; n=5 for NPCMdm2−/−).
Mdm2 ensures the survival and timely differentiation of NPCs and nephron lineage cells
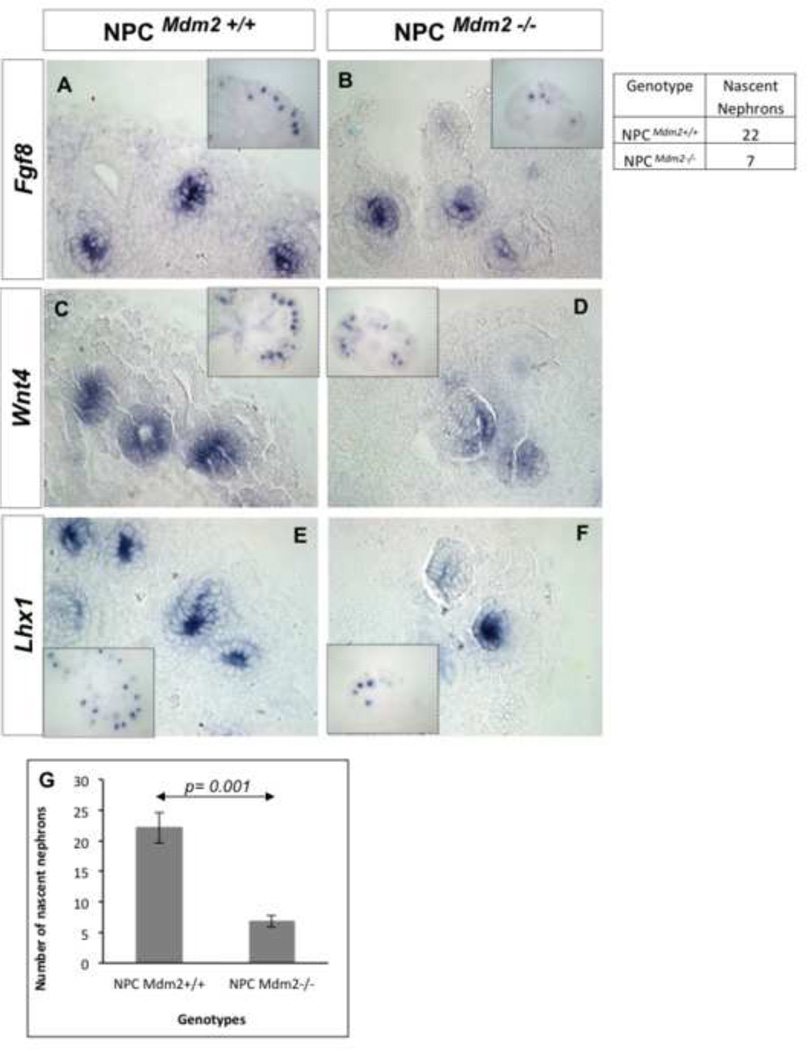
Using whole mount and section in situ hybridization we assayed for key molecular markers of nephron progenitors and the differentiating nascent nephrons originating from them. At E13.5 and E14.0, the expression of Eya1 and Pax2 was significantly lower in the CM of the mutant kidneys (Supplemental Fig. 4 A–D). Wnt4 expression was not affected (Supp. Fig. 4 E, F), while Gdnf expression was slightly lower (Supp. Fig. 4Fig. G, H), and, the stromal marker Foxd1 showed strong up-regulation in the cortical aspect of NPCMdm2−/− kidneys (Supp. Fig. 4 I, J). There were far fewer nascent nephrons (control kidneys have 3-fold more over the mutant kidneys) expressing Fgf8, Pax8, Pax2, Wnt4, and Lhx1 in the E14.5–E15.5 NPCMdm2−/− kidneys (Fig. 7). Next we examined the secondary effects of Mdm2 loss from the CM on the UB lineage. The expression of UB markers c-Ret, Wnt9b, and Wnt11 were comparable between the wild type controls and NPCMdm2−/− kidneys at E13.5 (Supplemental Fig. 5). However, there were large areas in the E15.5 NPCMdm2−/− kidneys, which probably correspond to regions with premature depletion of the nephrogenic zone, that were devoid of cRet-, Wnt9b- and Wnt11-positive structures (Supplemental Fig. 5).
Figure 7. Paucity of nascent nephrons in the NPCMdm2−/− kidneys at E14.5.
ISH for the early markers of nephrons_ Fgf8 (A, B), Wnt4 (C, D) and Lhx1 (E, F) reveals far fewer nephron precursors in NPCMdm2−/− kidneys (B, D, F) relative to the littermate NPCMdm2+/+ kidneys (A, C, E). (G) A graph showing a 3-fold difference in the average number of nascent nephrons between control and mutant kidneys at this stage. (n=3 per genotype)
To obtain further corroboration of our in situ data we performed qRT-PCR on E14.5 total RNA from NPCMdm2+/+ and NPCMdm2−/− kidneys from age matched embryos (Supplemental Fig. 6). While Gdnf expression was not altered Eya1 levels were much lower in the NPCMdm2−/− kidneys. The reduction in Pax2, Fgf8, and Bmp7 and the elevated levels of Fgf7 and Wnt9b were statistically significant. Although we did not detect a significant drop in Fgf9 levels in NPCMdm2−/− kidneys at E14.5 it may exert some synergistic effects when coupled to low Bmp7 in our model. It should be noted that we observed enhanced Wnt9b expression by qRT-PCR but not by ISH.
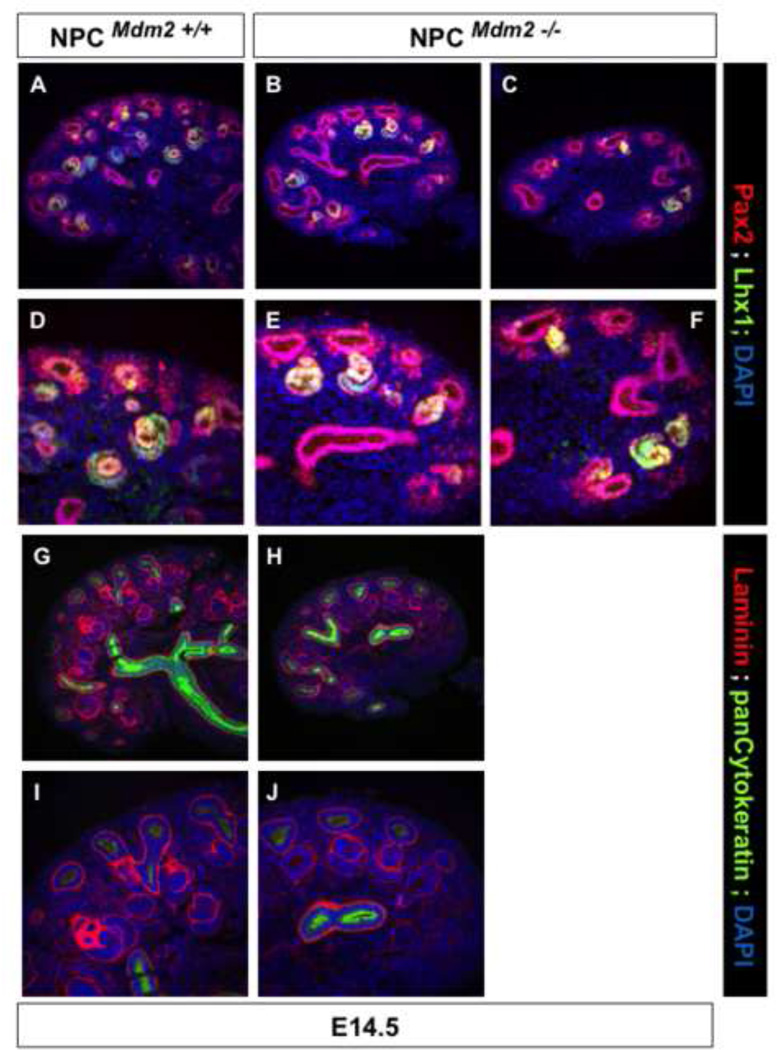
By immunostaining for the definitive markers of nephrogenesis we were able to better characterize the defects in NPCMdm2−/− kidneys at E14.5 (Fig. 8). There were fewer Lhx1+ and Pax2+, nephron intermediates evident at E14.5 (Fig. 8 A–F). The presence of some nephron precursors in the mutant kidneys can be attributed to the normal differentiation of a small population of Six2+ progenitors that escape Six2-Cre mediated recombination. The absence of ectopic/dorsal renal vesicles (Laminin + and pan cytokeratin negative) in the NPCMdm2−/− kidneys discounts the possibility that the Six2+ NPC population undergoes precocious differentiation en masse (Fig. 8 G–J).
Figure 8. NPCMdm2−/− kidneys do not show any ectopically forming nephrons at E14.5. (A–F).
Pax2 (red) and Lhx1 (green) co-staining highlight phenotypes ranging between mild (B shown enlarged in E) and severe (C shown enlarged in F) in the mutant kidneys. (G–J) Laminin (red) and pan cytokeratin (green) co-staining show that there are no ectopic nascent nephrons on the dorsal aspect of the Ub tips in NPCMdm2−/− E14.5 kidneys as with the control littermate kidneys. Panels I and J are enlarged views of G and H respectively.
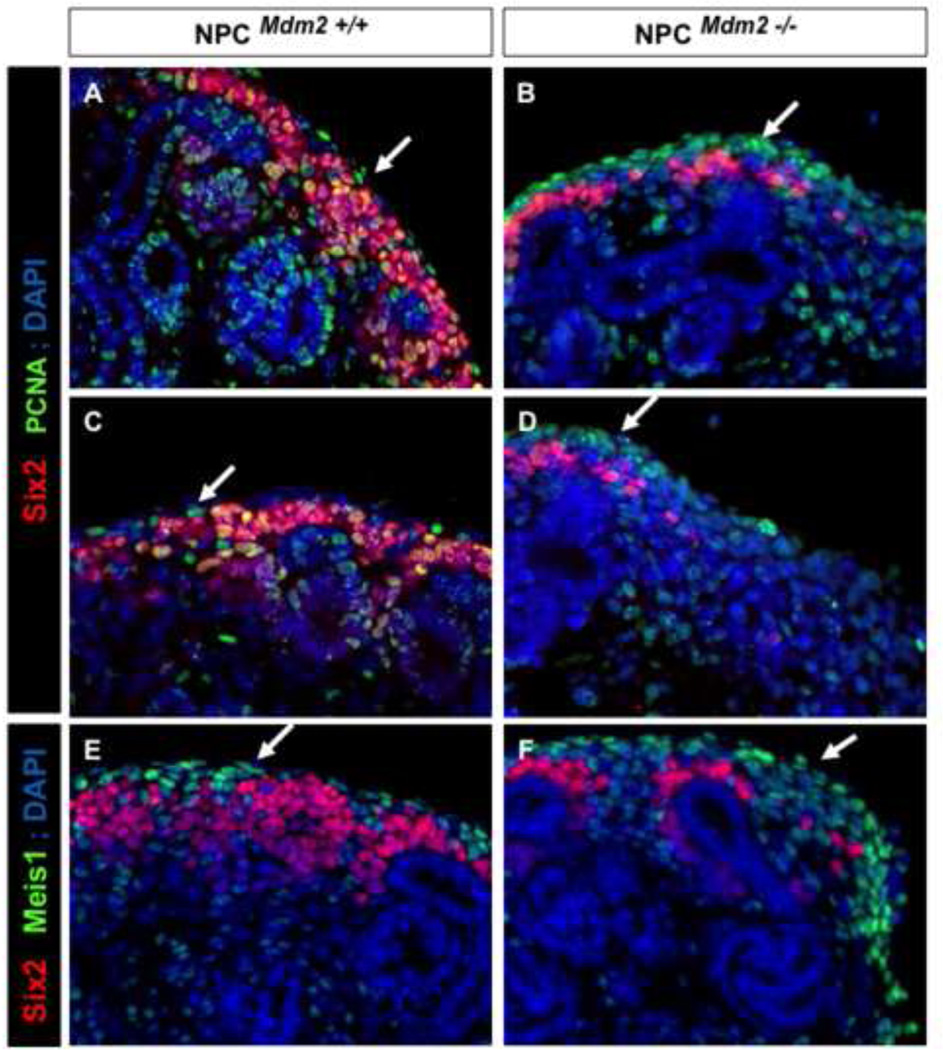
By breeding the R26-tdTomato reporter mice with the Six2-GFP::Cretg; Mdm2F/F mice, we found that despite the inactivation of Mdm2, dsRed+ nephron precursors representing all the morphogenetic steps were being specified at E13.5 (not shown) and E14.5 (Supplemental Fig. 7). Lef1, a marker of the nephron precursors, appeared lower in the nephron intermediates of the NPCMdm2−/− kidneys. The recovery of Lef1+, dsRed+ nascent nephrons in the mutant kidneys suggest that the NPCs retain their potential to differentiate into all stages of the nephrogenic lineage despite the inactivation of Mdm2 in these cells. Furthermore, by co-staining for Six2, dsRed, and Meis1 at E13.5 and P0 (data not shown) we were able to confirm that the Six2+ cells do not undergo a fate change into stromal cells. This is further borne out by the co-localization of the Lef1 and ds-Red staining at E14.5 (Supplemental Fig. 7). Nonetheless, we do observe localized cortical expansion of the Meis1+ stroma dorsal to the thinning cap in the mutant kidneys. Dual staining with PCNA and Meis1 confirms that the stroma undergoes increased proliferation regionally in the mutant kidneys (Figure 9).
Figure 9. The cortical stroma of NPCMdm2−/− mice is multilayered and shows an increase in PCNA expression.
(A, C, E) Sections through NPCMdm2+/+ and (B, D, F) NPCMdm2−/− kidneys at E14.5. Regionalized elevation in PCNA staining is observed in the cortical stromal cell population of NPCMdm2−/− kidneys (B, D). (E, F) The cortical stroma (white arrows) of the mutant kidney is several cell layers thick unlike the wild type littermate control kidneys (compare Meis1 expression in panels E and F).
Taken together, Mdm2 is essential to the maintenance of both the NPCs as well as the nephron precursors being specified from them. Increased p53 levels in the wake of Mdm2 loss within the NPC lineage results in elevated apoptosis of the nephron progenitors and precursors causing premature cessation of nephrogenesis.
Inhibition of p53 by Mdm2 is essential to maintain the nephrogenic niche
We see accumulation of p53 protein following Six2 Cre-mediated recombination of both Mdm2 floxed alleles in the NPCs (Fig. 4 B, D). To determine if the poor survival of the NPCs and the resulting renal hypodysplasia can be circumvented by the elimination of p53 function, we bred these mice into a p53 null background. The combined loss of Mdm2 and p53 in the NPCs is able to rescue kidney development. These compound mutant mice survive to adulthood and are fertile (Table 3).
Table 3.
Rescue of NPCMdm2−/− mice against a p53 null background
| Postnatal day 21 n=71 |
Mdm2F/+ | Mdm2F/F | Cre+ Mdm2F/+ |
Cre+ Mdm2F/F |
|---|---|---|---|---|
| p53 F/− | 4 | 3 | 5 | 6 |
| p53 F/+ | 5 | 11 | 5 | 0 |
| p53 +/− | 8 | 6 | 5 | 0 |
| p53 −/− | 4 | 2 | 1 | 2 |
| p53+/+ | 1 | 2 | 1 | 0 |
All genotypes expected at 1:20 ratio
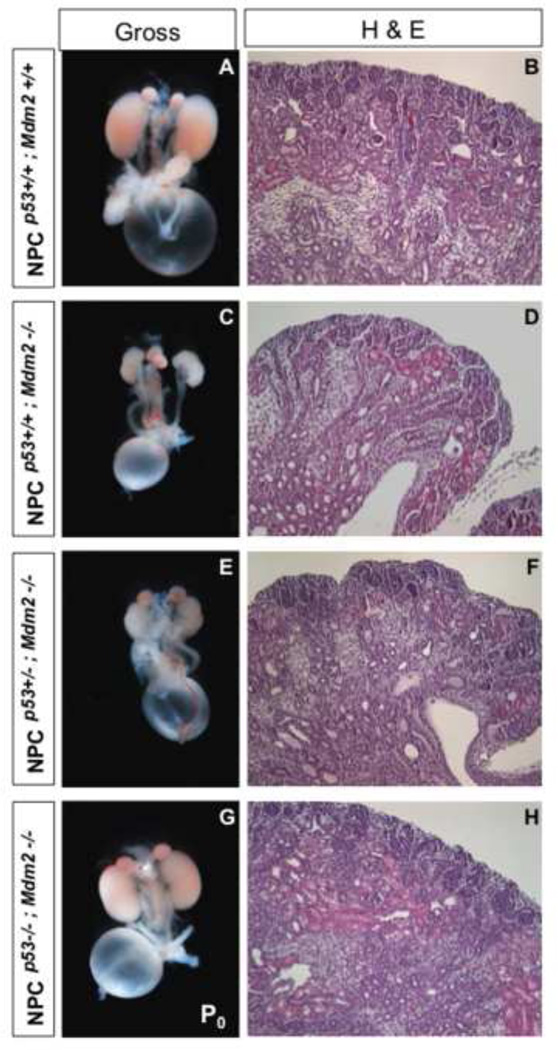
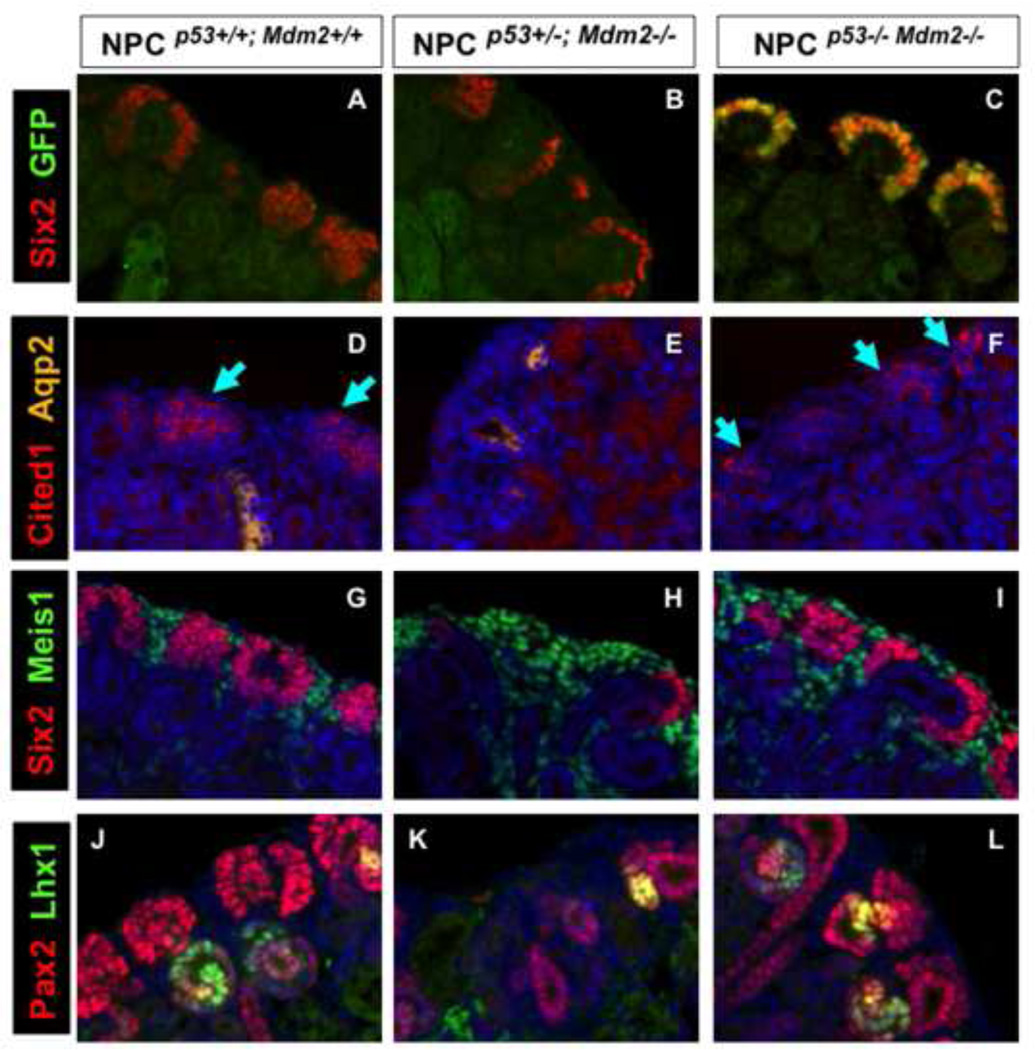
Gross as well as histological analyses of the NPCMdm2−/−p53−/− kidneys reveal a near complete rescue (Fig. 10). Accordingly, the nephrogenic zone with its nascent ureteric tips, multi-layered cap, and nascent nephrons was maintained and the differentiated epithelia tubules were sub-cortical to it as in the control wild type littermates. Notably, Six2Cre+ NPCs that stain positive for GFP were recovered in NPCMdm2−/−, p53−/− kidneys but not in the homozygous mutant or heterozygous kidneys at birth (Fig. 11 A–C and data not shown). The recovery of GFP expressing CM cells attests to the survival role of Mdm2 in the niche. Also noteworthy was the recovery of the Cited1+, Six2+ and Pax2+ NPC subpopulation in the CM of compound mutants (Fig. 11 D–L). In addition, the Meis1-staining stroma and nephron intermediates being specified (Lhx1+ structures) were restored to wild type levels (Fig. 11 J–L and data not shown). Therefore, the suppression of p53 function by Mdm2 is necessary to maintain the NPC population.
Figure 10. Loss of p53 from NPCMdm2−/− kidneys can rescue metanephrogenesis. (A, C, E, G).
Gross morphology of kidneys at P0 ; (B, D, F, H) H & E staining of kidney sections from corresponding genotypes. (A, B) NPCp53+/+; Mdm2+/+ wild type control; (C, D) NPCp53+/+; Mdm2−/− homozygous null mutant for Mdm2 but wild type for p53; (E, F) NPCp53+/−; Mdm2−/− homozygous null mutant for Mdm2 but heterozgyous for p53; (G, H) NPCp53−/−; Mdm2−/− compound homozygous null mutant for Mdm2 and p53.
Figure 11. Restoration of nephrogenesis in compound, homozygous mutant NPCp53−/−;Mdm2−/− newborn kidneys.
P0 control kidneys NPCp53+/+;Mdm2+/+ (A, D, G, J); conditional Mdm2 mutants, NPCp53+/+; Mdm2−/− (B, E, H, K); compound homozygous mutants NPCp53−/−; Mdm2−/− (C, F, I, L). (A–C) Six2 (red) and GFP (green) co-staining underscores the recovery of GFP+ cap mesenchyme cells absent from NPCp53+/+;Mdm2−/− kidneys (Compare B and C). (D–F) Cited1 (red, blue arrows) expressing subpopulation within the cap mesenchyme is lost in NPCp53+/+;Mdm2−/− kidneys but is maintained in a p53 null background (Compare E and F). (G–I) The proportion of cap mesenchyme (Six2+, red) to cortical stroma (Meis1+, green) is re-established in the compound mutant kidneys as shown in panel I. (J–L) Pax2 (red) and Lhx1 (green) immunostaining reveal that Ub branching and renal tubule differentiation and survival can be supported in NPCp53−/−; Mdm2−/− kidneys unlike the single mutants NPCp53+/+; Mdm2−/−. The rescued kidneys show a well developed nephrogenic zone (NZ) with normally patterned cortical parenchyma and interstitium.
Discussion
The nephrogenic niche houses the progenitor population that gives rise to the full complement of nephrons in a given species. Deficit in the final nephron number is seen as a major contributor of renal diseases in adult life (Keller et al., 2003; Myrie et al., 2011; Walker and Bertram, 2011). The ‘stemness’ of this population is maintained by factors that sustain self-renewal capacity in some cells while rendering others competent to differentiate under the influence of appropriate cues. Fgf20, Fgf9, Bmp7, Six2 and Sall1 each have essential roles either in the proliferation, survival, or the continual replenishment of the nephrogenic niche (Barak et al., 2012; Blank et al., 2009; Brown et al., 2011; Brown et al., 2013; Denner and Rauchman, 2013; Kobayashi et al., 2008; Oxburgh et al., 2011; Self et al., 2006). Our study examines the functional contribution of Mdm2 in the nephrogenic progenitor niche. We found that the loss of Mdm2 has a significant impact on the survival and maintenance of the NPC population. In the absence of Mdm2 function, elevated p53 and apoptosis within the NPC population causes their premature depletion. The epithelial nephron precursors that are specified show poor survival owing to oscillations in p53 levels in the NPCMdm2−/− kidneys. Consequently, the number of identifiable immature nephron intermediates was dramatically reduced in the NPCMdm2−/− kidneys and there is localized premature cessation of nephrogeneis at birth.
Liu et al. (Liu et al., 2007) have ascribed a role for the Mdm2-p53 network in sustaining progenitor cell expansion during postnatal mouse development. In that study mice lacking Mdm2 coupled to an apoptosis-deficient, hypomorphic p53 allele (p53515C) showed widespread defects in progenitor expansion within both the neural and hematopoietic lineages. Renal failure in these mice was attributed to delayed nephron development, which resulted in fewer glomeruli that were poorly developed. Later, Abbas et al (Abbas et al., 2010) demonstrated that Mdm2 keeps reactive oxygen species (ROS)-induced p53 levels in check to allow hematopoiesis to proceed postnatally in the same mouse model. In the absence of Mdm2, there is stabilization of p53 in the hematopoietic progenitors within the bone marrow. Stabilized, p53 transactivates ROS-inducing genes (also known as p53-induced genes, PIG) that cause death of the hematopoietic cells (Donald et al., 2001; Li et al., 1999; Polyak et al., 1997). In our study, we find phospho-H2AXγ-positive cells in the surviving CM cells of NPCMdm2−/− kidneys but not in the wild type control kidneys. Phospho-H2AXγ-positive staining is indicative of double-stranded DNA breaks possibly triggered by p53-induced ROS. Therefore, in the absence of the protective influence of Mdm2 there is stabilization of p53, p53-mediated induction of the pro-oxidant state leading up to stress-induced double-stranded DNA breaks and ultimately apoptosis of cells. Taken together, we conclude that Mdm2 is important for the survival and expansion of the nephrogenic progenitor population during metanephrogenesis similar to its role in the neural and hematopoietic lineages postnatally.
The renal phenotype resulting from the conditional loss of Mdm2 from the NPCs is strongly reminiscent of Fgf9+/−; Fgf20βGal/βGal compound mutant kidneys described by Barak et al. (2012). Similar to the Fgf9+/−; Fgf20βGal/βGal kidneys, the NPCMdm2−/− kidneys were reduced in size with large regions that are devoid of the nephrogenic zone with few functional glomeruli. It is likely that the NPCs were prematurely depleted, through elevated p53 and apoptosis, and therefore made fewer nephrons.
An important aspect of the renal phenotype in NPCMdm2−/− kidneys is the expanded stromal cell population. Although the precise reasons for cortical stroma expansion in mutant Mdm2 kidneys are unknown, our lineage fate studies (Supplemental Fig. 7) suggest that the extra stroma is not derived from “Six2-Cre” cells. Rather, increased PCNA staining in the cortical stroma of NPCMdm2−/− kidneys argues that proliferation accounts for the observed expansion of the stromal population. Recent research has demonstrated the importance of signals originating in the cortical stroma that oppose NPC renewal but promote its differentiation (Das et al., 2013). In the absence of cortical stroma they observed an expansion of the nephron progenitors. The NPCMdm2−/− kidneys show regionalized expansion rather than loss of the cortical stroma. It is possible that the expanded stroma in our model opposes NPC renewal while elevation in p53 mediated apoptosis reduces NPC survival within the nephrogenic niche.
A recent report revealed an essential role for Bmp7/Smad signaling in the spatio-temporal transition of Cited 1-positive NPC cells into Six2-positive cells, which represents a cell population committed to nephron formation upon induction by canonical Wnts (Brown et al., 2013). In agreement with this observation, Bmp7−/− mice have small, hypomorphic kidneys owing to the premature cessation of nephrogenesis stemming from the survival of only a few Cited1+ cells and greatly reduced Six2+ cell population. The conditional loss of Mdm2 from the NPCs also results in small, hypoplastic kidneys that are severely deficient in Cited1, Six2, Sall1 and Amphiphysin. The pronounced loss of Cited1+ cells in our model could be indicative of poor survival of the NPCs and/or their premature commitment to the process of epithelialization preceding nephron differentiation.
The association between Mdm2-p53 signaling and ‘stemness’ has been reported previously. Human embryonic stem cells rely on high MDM2 and low p53 levels to maintain stemness and regenerative capacity (Das et al., 2012). Suppression of p53 levels allows cytoprotection while maintaining an undifferentiated state. On the other hand, high p53 levels promote apoptosis and differentiation of human embryonic stem cells following oxidative stress. In our model Mdm2 may function to maintain low p53 levels in the nephrogenic niche to ensure ‘stemness’ and prevent precocious depletion of the CM. Immuno-detection of the Cre reporter tdTomato using DsRed revealed that Cre was active in the CM and their differentiated epithelial derivatives. In other words, the loss of the Six2+ cap mesenchyme could not be attributed to a fate change to Meis1+ stromal population.
A previous study shows that several tissues deficient in Mdm2 function exhibit spontaneous activation of p53 in the absence of post-translational modification (Ringshausen et al., 2006). Recently, Pant et al (2013) using a genetic mouse model demonstrated that basal levels of Mdm2 can sufficiently regulate p53 levels to ensure normal tissue homeostasis. In our study, the elimination of Mdm2 from the NPCs of the embryonic kidney led to p53 accumulation and widespread apoptosis in the nephrogenic zone cells predominantly in the mesenchyme capping the UB. Curiously, we did not detect enhanced acetylation of p53 in the absence of Mdm2 function in the NPCs (data not shown). Normally Mdm2 recruits HDAC1 to facilitate the deacetylation of p53 which makes it susceptible to ubiquitin-mediated proteosomal degradation (Ito et al., 2002). Therefore, our findings support the idea that elevation of unmodified tissue p53 levels is sufficient to cause apoptosis in vivo.
In summary, Mdm2 through its regulation of the pro-apoptotic, growth-suppressive protein, p53, is essential for the renewal/survival of NPCs. Without functional Mdm2, there is stabilization of p53 levels accompanied by elevated apoptosis and premature depletion of the Six2+ cap cells accounting for premature cessation of nephrogenesis.
Supplementary Material
Highlights.
We examine the role of ubiquitin ligase Mdm2 in nephrogenesis.
Mdm2 mutant kidneys have precocious depletion of nephron progenitors.
The defect is multifactorial: cell cycle, apoptosis, and gene expression.
Conditional deletion of p53 rescues nephrogenesis in Mdm2 mutants.
Tight regulation of p53 by Mdm2 is required for nephrogenesis.
Acknowledgements
This work was supported by the NIH RO1-DK66250 grant. We acknowledge the Tulane Renal and Hypertension Center of Excellence and the Tulane Center for Gene Therapy for use of their imaging resources. We thank Dr. Zubaida Saifudeen for insightful contribution to the project. We thank Drs. Andrew McMahon, Cathy Mendelsohn, Gail Martin, Greg Dressler, Thomas Carroll, and Zubaida Saifudeen for the probes used in the in situ hybridization assays.
Footnotes
Publisher's Disclaimer: This is a PDF file of an unedited manuscript that has been accepted for publication. As a service to our customers we are providing this early version of the manuscript. The manuscript will undergo copyediting, typesetting, and review of the resulting proof before it is published in its final citable form. Please note that during the production process errors may be discovered which could affect the content, and all legal disclaimers that apply to the journal pertain.
References
- Abbas HA, Maccio DR, Coskun S, Jackson JG, Hazen AL, Sills TM, You MJ, Hirschi KK, Lozano G. Mdm2 is required for survival of hematopoietic stem cells/progenitors via dampening of ROS-induced p53 activity. Cell Stem Cell. 2010;7:606–617. doi: 10.1016/j.stem.2010.09.013. [DOI] [PMC free article] [PubMed] [Google Scholar]
- Barak H, Huh SH, Chen S, Jeanpierre C, Martinovic J, Parisot M, Bole-Feysot C, Nitschke P, Salomon R, Antignac C, Ornitz DM, Kopan R. FGF9 and FGF20 Maintain the Stemness of Nephron Progenitors in Mice and Man. Developmental cell. 2012;22:1191–1207. doi: 10.1016/j.devcel.2012.04.018. [DOI] [PMC free article] [PubMed] [Google Scholar]
- Blank U, Brown A, Adams DC, Karolak MJ, Oxburgh L. BMP7 promotes proliferation of nephron progenitor cells via a JNK-dependent mechanism. Development. 2009;136:3557–3566. doi: 10.1242/dev.036335. [DOI] [PMC free article] [PubMed] [Google Scholar]
- Brown AC, Adams D, de Caestecker M, Yang X, Friesel R, Oxburgh L. FGF/EGF signaling regulates the renewal of early nephron progenitors during embryonic development. Development. 2011;138:5099–5112. doi: 10.1242/dev.065995. [DOI] [PMC free article] [PubMed] [Google Scholar]
- Brown AC, Muthukrishnan SD, Guay JA, Adams DC, Schafer DA, Fetting JL, Oxburgh L. Role for compartmentalization in nephron progenitor differentiation. Proc Natl Acad Sci U S A. 2013;110:4640–4645. doi: 10.1073/pnas.1213971110. [DOI] [PMC free article] [PubMed] [Google Scholar]
- Das A, Tanigawa S, Karner CM, Xin M, Lum L, Chen C, Olsen EN, Perantoni AO, Carroll TJ. Stromal-epithelial crosstalk regulates kidney progenitor cell differentiation. Nature cell biology. 2013;15:1035–1046. doi: 10.1038/ncb2828. [DOI] [PMC free article] [PubMed] [Google Scholar]
- Das B, Bayat-Mokhtari R, Tsui M, Lotfi S, Tsuchida R, Felsher DW, Yeger H. HIF-2alpha suppresses p53 to enhance the stemness and regenerative potential of human embryonic stem cells. Stem Cells. 2012;30:1685–1695. doi: 10.1002/stem.1142. [DOI] [PMC free article] [PubMed] [Google Scholar]
- Denner DR, Rauchman M. Mi-2/NuRD is required in renal progenitor cells during embryonic kidney development. Dev Biol. 2013;375:105–116. doi: 10.1016/j.ydbio.2012.11.018. [DOI] [PMC free article] [PubMed] [Google Scholar]
- Donald SP, Sun XY, Hu CA, Yu J, Mei JM, Valle D, Phang JM. Proline oxidase, encoded by p53-induced gene-6, catalyzes the generation of proline-dependent reactive oxygen species. Cancer Res. 2001;61:1810–1815. [PubMed] [Google Scholar]
- Francoz S, Froment P, Bogaerts S, De Clercq S, Maetens M, Doumont G, Bellefroid E, Marine JC. Mdm4 and Mdm2 cooperate to inhibit p53 activity in proliferating and quiescent cells in vivo. Proc Natl Acad Sci U S A. 2006;103:3232–3237. doi: 10.1073/pnas.0508476103. [DOI] [PMC free article] [PubMed] [Google Scholar]
- Hendry C, Rumballe B, Moritz K, Little MH. Defining and redefining the nephron progenitor population. Pediatr Nephrol. 2011;26:1395–1406. doi: 10.1007/s00467-010-1750-4. [DOI] [PMC free article] [PubMed] [Google Scholar]
- Hilliard S, Aboudehen K, Yao X, El-Dahr SS. Tight regulation of p53 activity by Mdm2 is required for ureteric bud growth and branching. Developmental biology. 2011;353:354–366. doi: 10.1016/j.ydbio.2011.03.017. [DOI] [PMC free article] [PubMed] [Google Scholar]
- Ito A, Kawaguchi Y, Lai CH, Kovacs JJ, Higashimoto Y, Appella E, Yao TP. MDM2-HDAC1-mediated deacetylation of p53 is required for its degradation. EMBO J. 2002;21:6236–6245. doi: 10.1093/emboj/cdf616. [DOI] [PMC free article] [PubMed] [Google Scholar]
- Karner CM, Das A, Ma Z, Self M, Chen C, Lum L, Oliver G, Carroll TJ. Canonical Wnt9b signaling balances progenitor cell expansion and differentiation during kidney development. Development. 2011;138:1247–1257. doi: 10.1242/dev.057646. [DOI] [PMC free article] [PubMed] [Google Scholar]
- Keller G, Zimmer G, Mall G, Ritz E, Amann K. Nephron number in patients with primary hypertension. N Engl J Med. 2003;348:101–108. doi: 10.1056/NEJMoa020549. [DOI] [PubMed] [Google Scholar]
- Kobayashi A, Valerius MT, Mugford JW, Carroll TJ, Self M, Oliver G, McMahon AP. Six2 defines and regulates a multipotent self-renewing nephron progenitor population throughout mammalian kidney development. Cell Stem Cell. 2008;3:169–181. doi: 10.1016/j.stem.2008.05.020. [DOI] [PMC free article] [PubMed] [Google Scholar]
- Li PF, Dietz R, von Harsdorf R. p53 regulates mitochondrial membrane potential through reactive oxygen species and induces cytochrome c-independent apoptosis blocked by Bcl-2. EMBO J. 1999;18:6027–6036. doi: 10.1093/emboj/18.21.6027. [DOI] [PMC free article] [PubMed] [Google Scholar]
- Liu G, Terzian T, Xiong S, Van Pelt CS, Audiffred A, Box NF, Lozano G. The p53-Mdm2 network in progenitor cell expansion during mouse postnatal development. J Pathol. 2007;213:360–368. doi: 10.1002/path.2238. [DOI] [PubMed] [Google Scholar]
- Mugford JW, Yu J, Kobayashi A, McMahon AP. High-resolution gene expression analysis of the developing mouse kidney defines novel cellular compartments within the nephron progenitor population. Developmental biology. 2009;333:312–323. doi: 10.1016/j.ydbio.2009.06.043. [DOI] [PMC free article] [PubMed] [Google Scholar]
- Myrie SB, McKnight LL, Van Vliet BN, Bertolo RF. Low birth weight is associated with reduced nephron number and increased blood pressure in adulthood in a novel spontaneous intrauterine growth-restricted model in Yucatan miniature Swine. Neonatology. 2011;100:380–386. doi: 10.1159/000326341. [DOI] [PubMed] [Google Scholar]
- Nishinakamura R, Matsumoto Y, Nakao K, Nakamura K, Sato A, Copeland NG, Gilbert DJ, Jenkins NA, Scully S, Lacey DL, Katsuki M, Asashima M, Yokota T. Murine homolog of SALLI is essential for ureteric bud invasion in kidney development. Development. 2001;128:3105–3115. doi: 10.1242/dev.128.16.3105. [DOI] [PubMed] [Google Scholar]
- Oxburgh L, Brown AC, Fetting J, Hill B. BMP signaling in the nephron progenitor niche. Pediatr Nephrol. 2011;26:1491–1497. doi: 10.1007/s00467-011-1819-8. [DOI] [PMC free article] [PubMed] [Google Scholar]
- Pant V, Xiong S, Jackson JG, Post SM, Abbas HA, Quintás-Cardama A, Hamir AN, Lozano G. The p53-Mdm2 feedback loop protects against DNA damage by inhibiting p53 activity but is dispensable for p53 stability, development, and longevity. Genes and Development. 2013;27:1857–1867. doi: 10.1101/gad.227249.113. [DOI] [PMC free article] [PubMed] [Google Scholar]
- Park JS, Valerius MT, McMahon AP. Wnt/beta-catenin signaling regulates nephron induction during mouse kidney development. Development. 2007;134:2533–2539. doi: 10.1242/dev.006155. [DOI] [PubMed] [Google Scholar]
- Polyak K, Xia Y, Zweier JL, Kinzler KW, Vogelstein B. A model for p53-induced apoptosis. Nature. 1997;389:300–305. doi: 10.1038/38525. [DOI] [PubMed] [Google Scholar]
- Ringshausen I, O'Shea CC, Finch AJ, Swigart LB, Evan GI. Mdm2 is critically and continuously required to suppress lethal p53 activity in vivo. Cancer Cell. 2006;10:501–514. doi: 10.1016/j.ccr.2006.10.010. [DOI] [PubMed] [Google Scholar]
- Rumballe BA, Georgas KM, Combes AN, Ju AL, Gilbert T, Little MH. Nephron formation adopts a novel spatial topology at cessation of nephrogenesis. Dev Biol. 2011;360:110–122. doi: 10.1016/j.ydbio.2011.09.011. [DOI] [PMC free article] [PubMed] [Google Scholar]
- Saifudeen Z, Dipp S, Stefkova J, Yao X, Lookabaugh S, El-Dahr SS. p53 regulates metanephric development. J Am Soc Nephrol. 2009;20:2328–2337. doi: 10.1681/ASN.2008121224. [DOI] [PMC free article] [PubMed] [Google Scholar]
- Self M, Lagutin OV, Bowling B, Hendrix J, Cai Y, Dressler GR, Oliver G. Six2 is required for suppression of nephrogenesis and progenitor renewal in the developing kidney. Embo J. 2006;25:5214–5228. doi: 10.1038/sj.emboj.7601381. [DOI] [PMC free article] [PubMed] [Google Scholar]
- Valentin-Vega YA, Okano H, Lozano G. The intestinal epithelium compensates for p53-mediated cell death and guarantees organismal survival. Cell Death Differ. 2008;15:1772–1781. doi: 10.1038/cdd.2008.109. [DOI] [PMC free article] [PubMed] [Google Scholar]
- Walker KA, Bertram JF. Kidney development: core curriculum 2011. American journal of kidney diseases : the official journal of the National Kidney Foundation. 2011;57:948–958. doi: 10.1053/j.ajkd.2011.03.009. [DOI] [PubMed] [Google Scholar]
- Weber S, Moriniere V, Knuppel T, Charbit M, Dusek J, Ghiggeri GM, Jankauskiene A, Mir S, Montini G, Peco-Antic A, Wuhl E, Zurowska AM, Mehls O, Antignac C, Schaefer F, Salomon R. Prevalence of mutations in renal developmental genes in children with renal hypodysplasia: results of the ESCAPE study. J Am Soc Nephrol. 2006;17:2864–2870. doi: 10.1681/ASN.2006030277. [DOI] [PubMed] [Google Scholar]
Associated Data
This section collects any data citations, data availability statements, or supplementary materials included in this article.


