

Abstract.
Optical microangiography based on optical coherence tomography (OCT) is prone to noise that arises from a static tissue region. Here, we propose a method that can significantly reduce this noise. The method is developed based on an approach that uses the magnitude information of OCT signals to produce tissue microangiograms, especially suitable for the case where a swept-source OCT system is deployed. By combined use of two existing OCT microangiography methods—ultrahigh-sensitive optical microangiography (UHS-OMAG) and correlation mapping OCT (cmOCT)—the final tissue microangiogram is generated by masking UHS-OMAG image using the binary representation of cmOCT image. We find that this process masks the residual static artifacts while preserving the vessel structures. The noise rejection capability of the masked approach (termed as mOMAG) is tested on a tissue-like flow phantom as well as an in vivo human skin tissue. Compared to UHS-OMAG and cmOCT, we demonstrate that the proposed method is capable of achieving improved signal-to-noise ratio in providing microcirculation images. Finally, we show its clinical potential by quantitatively assessing the vascular difference between a burn scar and a normal skin of human subject in vivo.
Keywords: optical coherence tomography, optical microangiography, correlation mapping optical coherence tomography, human skin vasculature
1. Introduction
Fourier-domain optical coherence tomography (FD-OCT) is a well-established optical modality for noninvasive three-dimensional (3-D) imaging of biological tissues.1 Real-time, high-sensitivity, micrometer-resolution imaging of FD-OCT has extended its application to various biomedical research fields.2–4 Recently, a functional variation of FD-OCT has allowed for tissue microangiography, i.e., optical microangiography (OMAG) or OCT microangiography.5 The OCT microangiography measures the changes in amplitude (or intensity),6–9 phase,10–13 or complex value5,14–17 of the OCT signals resulting from the dynamic scattering of the red blood cells in functional vessels relative to the static scattering of surrounding tissues, which serves as an endogenous contrast to decouple the moving blood from the static tissues. This approach is able to provide depth-resolved microangiograms with a capillary-level resolution (), delineating the 3-D microvessel network in the tissue bed.14
One of the intense research activities using OCT microangiography is to image blood flow within microcirculatory tissue bed of human skin. Since vascular involvement in pathogenesis of diseases in human has been reported,18–20 cutaneous microcirculation has become of much interest as a desirable target for identifying microcirculatory dysfunction due to its easy access for examination.21 Thus, the assessment of skin microvasculature may be useful for the prognosis and diagnosis of vascular diseases. Several intensity-based interframe (IB-IF) OCT microangiography techniques have been proposed for the vascular imaging of the human skin due to their immunity to phase noise artifacts compared to the phase-based techniques.22–33 This magnitude-based analysis has been mainly implemented to swept-source OCT (SS-OCT)/FD-OCT24–27 because SS-OCT is susceptible to phase stability, albeit with the advantages of, e.g., longer imaging range, better sensitivity along imaging depth (less depth-dependent signal roll off), and higher detection efficiencies over spectral/Fourier domain OCT.7 These attributes of SS-OCT are beneficial for the functional imaging of human skin. The method for microcirculation imaging processes successive OCT B-scan frames acquired along the slow scanning axis (C-scan). Ultrahigh-sensitive optical microangiography (UHS-OMAG)22,23 and speckle variance OCT (svOCT)24,25 have identified the human skin microvasculature by calculating difference between inter B-scan spectral interferograms22,23 or speckle intensity variance between a series of B-scan structure frames.24,25 Other IB-IF OCT microangiography techniques, such as correlation mapping OCT (cmOCT)26–29 and intensity-based Doppler variance (IBDV),30–32 have been recently utilized for the microvascular imaging of the human skin in vivo. These methods estimate speckle decorrelation between adjacent B-scan structure frames to obtain blood flow information.
Although the mentioned OCT angiographic algorithms have provided the high-sensitive microvascular images of human skin tissues, we found that their contrast can still be hindered by residual signals seen in the static tissue regions. In the UHS-OMAG and the svOCT, the residuals may be due to pixel intensity difference between the inter B-scan frames for the static region. In particular, the signal strength of the high-intensity structural region may be comparable to or stronger than the blood vessel signals, which can occlude the blood vessels when visualizing the vasculature with en face maximum intensity projection (MIP) view. The static artifacts can be reduced by a simple contrast thresholding on the vascular image, but this accompanies a loss of small vessels due to their weak signal appearance, leading to discontinuities of the vasculature.33
cmOCT is relatively insensitive to such noises compared to UHS-OMAG or svOCT because this technique employs normalized cross-correlation (NCC) using subimages to evaluate the degree of similarity (or dissimilarity) between inter B-scan frames.27 Assuming that reflectivity for static tissue is time invariant, the changes in amplitude between adjacent subimages ( and ) for static tissue are proportional to one common scaling factor, and thus, can be represented as ( is a scaling factor). For this reason, the NCC equation in Ref. 27 always yields 1, meaning that the static signals in the subimages are considered totally correlated, despite of their amplitude difference. However, the reflectivity of the moving blood is random variable, leading to the changes in amplitudes between adjacent subimages. Thus, each pixel in the image possesses different scaling factors, giving their NCC much lower than 1 (weak correlation). Under this circumstance, the high correlation values of static tissues can be picked up from the final correlation map by setting a proper threshold. Subsequently, the cmOCT image is relatively free from the static artifacts. Unfortunately, the background region or the static tissue area with low backscatter, which should have high correlation, tends to have lower correlation comparable to the vessel due to large influence of the noise, inducing decorrelation artifacts in the cmOCT image. On the other hand, UHS-OMAG has benefits of being insensitive to the noise in these low structural intensity areas compared to its cmOCT counterpart. Enfield et al.26 removed this noise by overlaying a binary mask of the OCT structural image to the correlation map in the cmOCT imaging. However, the selection of the binary threshold value is rather arbitrary, still leaving the strong static signals in the cmOCT image.
To overcome these issues, in this paper, we propose to work with a combination of the IB-IF OCT angiographies for high-contrast vascular imaging of the human skin in vivo. Specifically, this is achieved by masking a UHS-OMAG image with a binarized cmOCT image obtained with the same OCT structural data. This enables the reduction of both static artifacts on each OCT microangiogram, leading to improved signal contrast in the resulting microangiogram. For brevity, we term this method as masked UHS-OMAG (mOMAG) in this work. The performance of the mOMAG is demonstrated on high scattering samples, such as a tissue-like flow phantom and an in vivo human skin tissue (human palm). The flow images are compared with those by the individual UHS-OMAG and cmOCT. Further, we demonstrate its potential as a clinical tool with quantitative assessment of the microvasculature in a human skin injury in vivo.
2. Material and Method
2.1. Imaging System
In this study, we used a commercial high-speed SS-OCT system with a wavelength-tunable vertical cavity surface-emitting laser (VCSEL) (OCS1310V1, Thorlabs Inc., Newton, New Jersey) for FD-OCT imaging. This VCSEL light source features a wide wavelength-tuning range and a long coherence length over 50 mm, providing an extended imaging range ().33 The tunable laser has a center wavelength of 1300 nm with a spectral bandwidth of 100 nm ( cut-off) and is operated at an axial scan rate of 100 kHz, giving an axial resolution of 16 μm in air (specified by the vendor). The output of the light source (20 mW) is launched into a fiber-based Mach Zehnder interferometer, splitting the beam into a reference arm and a sample arm using a broadband coupler. In the sample arm, a stand-alone imaging probe containing a fiber collimator, an galvanometer, and a microscope objective (LSM03, , , Thorlabs Inc.) was used for the sample scan with an incident optical power of upon the sample surface, achieving a lateral resolution of 25 μm in air. For human skin imaging, an adjustable spacer was affixed to the probe head and was in contact with the skin to minimize the involuntary tissue motion. A-line interference fringe signals were detected by a gain-balanced detector and further digitized using a data acquisition board with a 12-bit analog-to-digital converter. The resulting fringe signals with 4096 pixels were recorded and saved to a 64-bit operating computer system, which controlled the OCT system.
2.2. Imaging Protocol
For 3-D OCT volume imaging, a typical raster scanning protocol was implemented with the system. Along the X-scanning direction (fast B-scan), 256 A-lines were captured with a scan range of 2.0 mm, forming a cross-sectional B-scan image at a frame rate of 100 frames per second. The spatial interval between adjacent A-lines was . In the Y-scanning direction (slow C-scan), 2560 adjacent B-scans were captured over 2.0 mm on the sample, which gave a spatial separation of between the adjacent B-scan frames, indicating a sampling density of 16. Because the spatial interval between the frames is much smaller than the spot size of the laser beam (), good correlation for the static regions over the successive tomograms can be ensured. We note that direct scan control was not available in the commercial OCT system to be utilized in this work, which prevents us from using a stepped-scan protocol to acquire the repeated B-scans at the same location,34 which would allow strong correlation for the static tissues. Accordingly, we elected the use of dense sampling in the slow axis with the given continuous scan pattern.23 The total acquisition time to record 2560 B-frames was , forming a 3-D volume OCT data consisting of a field of view of [].
2.3. Vascular Mapping Process in mOMAG
We extracted vascular images with the collected OCT 3-D spectral interferograms. Figure 1 schematically presents a flow diagram of the vascular reconstruction procedure using mOMAG. First, the background components in the interferograms were eliminated by subtracting a reference spectrum, which was obtained by averaging the whole volumetric OCT fringe data.35 Depth-resolved OCT structure frames were obtained after applying fast Fourier transformation (FFT) on the background-free fringe signals, (step 1 in Fig. 1). Note that the OCT structural images in Fig. 1 are displayed as a logarithmic form for illustration purpose. To reduce axial motion noise due to respiration or pulsation, each pair of adjacent B-scan structure frames were aligned using a cross-correlation-based image registration algorithm before vascular mapping.36 UHS-OMAG images were obtained by calculating intensity differences between the interframes with 10 successive B-scan structure frames as described in Eq. (1), which was modified from the original UHS-OMAG algorithm where the subtraction between complex OCT signals was performed37 (step 2 in Fig. 1).
| (1) |
where is an intensity value at ’th B-scan structure frame in the slow scan (C-scan) direction, and is the wavenumber. The calculated nine UHS-OMAG data were averaged to increase signal sensitivity in the flow region. The spatial scan of the averaged frame has an interval of , which is smaller than the spot size (12.5 μm) of the laser beam, and can be almost treated as if the 10 B-scans were collected at the same location. The averaged UHS-OMAG data were presented in logarithmic scale and thresholded by a value equivalent to the background noise level, forming one UHS-OMAG image. We note that the logarithm was not necessary during the mOMAG mapping.
Fig. 1.
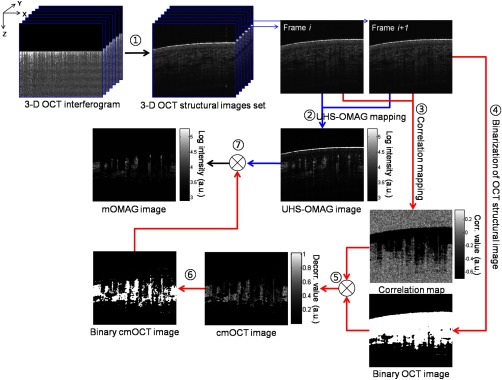
Illustration of processing steps for reconstruction of a flow image using the proposed method.
Another vascular image was obtained using the cmOCT algorithm on the same 3-D OCT structural data. From the 10 successive B-scan structure frames, nine correlation maps were obtained by calculating the NCC between each pair of adjacent B-scan structure frames using the following equation 27 (step 3 in Fig. 1):
| (2) |
where is a subimage in ’th B-scan structure frame with window and is the mean value of the subimage . and are pixel sizes of the window. The correlation between the adjacent subimages was determined using Eq. (2), and its value was located at the central pixel of the window. A cross-sectional () correlation map was obtained by sliding the window across the entire image of which the degree of correlation ranges from to 1, where large positive value indicates high correlation or static tissue. The size of the window was properly chosen to be () in our study. A larger window size makes the image blur, leading to a loss of the small vessels.26 The calculated nine correlation maps were averaged to improve the flow signal-to-noise ratio. In step 3, the averaged correlation map was sign-inverted and thresholded above with the assumption that the static region gives a correlation value .26 Because the background of the correlation map is highly decorrelated, it must be suppressed. For this, the OCT structural image was binarized (step 4 in Fig. 1) and applied as a structural mask on the correlation map (step 5 in Fig. 1), forming one cmOCT image. The binary threshold value was arbitrarily set at 0.4 dB above the OCT background noise floor. Finally, the cmOCT image was binarized (step 6 in Fig. 1) and used as a mask on the averaged UHS-OMAG data. By multiplying the binary cmOCT mask with the UHS-OMAG image (step 7 in Fig. 1), we can remove the high-intensity artifact signal (which is the advantage of cmOCT) as well as reduce the low-intensity noise (which is the advantage of UHS-OMAG). As a result, the mOMAG image can have enhanced visibility in the vascular structure. The mOMAG image is presented in the logarithmic scale with same dynamic range as the UHS-OMAG image. Eventually, a total of 256 mOMAG images could be obtained with the 2560 OCT B-scan structure frames, and an en face MIP view image [] could be extracted from the 3-D microangiogram. Total processing time for the 3-D angiographic volume [] was using a personal computer (2.9 GHz, 8 GB RAM).
3. Experimental Results
3.1. Flow Phantom Imaging
To test the noise rejection ability of the proposed method, we built a scattering flow phantom. The flow phantom was made of an agarose gel mixed with milk to mimic optically scattering tissue background. A translucent 400-μm-inner-diameter tube was submerged into the phantom and a 2% milk solution was pumped into the tube at a constant flow rate () using a high-precision infusion syringe pump (Fusion 100, Chemyx Inc., Stafford, Texas) to simulate a blood flow within the stationary tissue. Figure 2 shows a representative cross-sectional OCT structural image [] of the tissue-like flow phantom [Fig. 2(a)] and the corresponding cross-sectional flow images obtained from UHS-OMAG [Fig. 2(b)], cmOCT [Fig. 2(c)], and mOMAG [Fig. 2(e)], respectively. In the UHS-OMAG image [Fig. 2(b)], the signals from the solid gel are visible surrounding the tube. Also, the strong reflection signal at the outer layer of the tube is still observed in the UHS-OMAG image. The noise and reflection are less pronounced in the cmOCT image [Fig. 2(c)], whereas the decorrelation signals due to the low structural intensity region are observed in the image. In the mOMAG image [Fig. 2(e)], the combination of the binary cmOCT mask [Fig. 2(d)] with the USH-OMAG image [Fig. 2(b)] eliminates most artifacts, and what remains is mostly the flow signal. This is much clear by seeing normalized A-line profiles extracted from the middle of each flow phantom image as Figs. 2(f) to 2(h). In Fig. 2(g), the UHS-OMAG profile (pink line) has strong artifacts (1,2,3) at the structural boundaries. In the cmOCT profile [black line in Fig. 2(f)], these artifacts are not visible. However, strong decorrelation signals (4,5,6) comparable to the flow signal in the tube are evident at the low-intensity structural regions in the cmOCT profile, whereas the signals at these regions are much weaker than the flow signal in the tube in the UHS-OMAG profile [Fig. 2(g)]. The binary cmOCT mask [red dotted line in Fig. 2(f)] is overlaid onto the UHS-OMAG profile as Fig. 2(g). It is obvious that the mOMAG profile [blue line in Fig. 2(h)] is isolated from all static signals on the original UHS-OMAG and cmOCT profiles while keeping the flow signal in the tube intact.
Fig. 2.
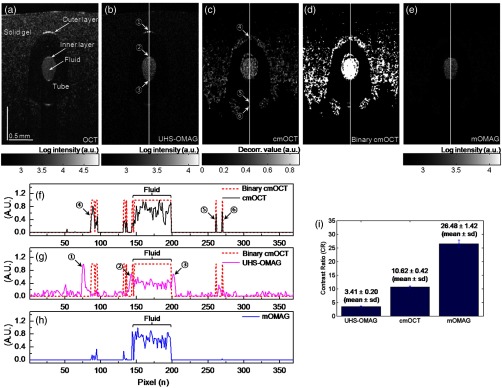
(a) Representative cross-sectional optical coherence tomography (OCT) structural image [] of a tissue-like flow phantom and corresponding cross-sectional flow images: (b) ultrahigh-sensitive optical microangiography (UHS-OMAG), (c) correlation mapping OCT (cmOCT), and (e) masked UHS-OMAG (mOMAG), respectively. (d) Binary representation of the cmOCT image (c). (f) to (h) Normalized A-line signal profiles extracted from the middle of each flow image. (i) Error bar graph representing mean and standard deviation of the contrast ratios for each 256 flow images obtained from UHS-OMAG, cmOCT, and mOMAG.
For quantitative comparison of the flow contrast, we calculated contrast ratios (CRs) of the 256 flow images of the tissue phantom obtained with UHS-OMAG, cmOCT, and mOMAG, respectively. Here, CR is defined as ratio of the mean value for the fluid region () in the tube and for the entire region of the solid gel. Figure 2(i) represents the CRs of the UHS-OMAG, the cmOCT, and the mOMAG images with the error bars [ (sd)], showing that the mean CR of the mOMAG image is 7 times and 2.5 times greater than those of the UHS-OMAG image and the cmOCT image in our work.
3.2. In Vivo Microcirculation Imaging of Human Skin Tissue
In vivo microcirculation imaging of human skin was demonstrated with the proposed method. We imaged the vasculature in the human palm of a healthy male volunteer. A 3-D OCT data set was acquired with the imaging protocol mentioned in Sec. 2.2. The results from the UHS-OMAG, cmOCT, and mOMAG algorithms were compared. A photograph of the human palm is shown in Fig. 3(a), where the imaging area [] is indicated with a white box in the picture. Figure 3(b) is a representative cross-sectional OCT structural image [], where the morphology of several cutaneous layers, such as stratum corneum (SC), viable epidermis (VE), papillary dermis (PD), and reticular dermis (RD), are clearly observed.33,38 The cutaneous vessels of the human skin are located at the dermis (D), consisting of two planar vascular networks: the superficial vascular plexus at the interface between the PD and the RD and a lower vascular plexus at the dermal-hyperdermal junction.23 Figures 3(c) to 3(e) present the cross-sectional vascular images obtained using UHS-OMAG, cmOCT, and mOMAG, respectively. In the UHS-OMAG image [Fig. 3(c)], we can observe static signals at the epidermis (E) and the dermis (D), which makes it difficult to clearly identify the blood vessels. On the other hand, cmOCT [Fig. 3(d)] and mOMAG [Fig. 3(e)] were relatively immune to the static artifacts, which fully revealed the presence of the superficial vessels at the junction of the VE and the PD (arrows in each figure). In the cmOCT image, we can observe large decorrelation signals in the deeper structures, which may be due to (1) shadowing artifacts below the RD vessels and (2) the static regions with low OCT signals, more sensitive to the noise [dotted circles in Fig. 3(d)]. These artifacts can cause significant degradation of the vascular image on its en face MIP view.
Fig. 3.

In vivo microcirculation imaging of a healthy human palm skin []. (a) Photograph of the human palm with an imaged area (a white solid box). (b) Representative cross-sectional (XZ) OCT structural image and the corresponding cross-sectional microvascular images: (c) UHS-OMAG, (d) cmOCT, and (e) mOMAG, respectively. SC, stratum corneum; VE, viable epidermis; E, epidermis; PD, papillary dermis; RD, reticular dermis; D, dermis. The axial scale bar was considered with the average refractive index of the human skin () (Ref. 39).
Figure 4 shows en face MIP views at different depths in the 3-D vasculatures of the human palm. The MIPs were calculated over three different depth ranges indicated as (1 to 3) in the OCT structure image [Fig. 4(a)] and displayed for each depth range in Fig. 4(b). In the depth range (1) (61 to 105 μm below the surface), the UHS-OMAG image showed large bright spots in the SC, corresponding to sweat ducts. This region is avascular and should not have any signal as presented in the cmOCT and the mOMAG images. The reasons for the sweat ducts to appear as bright spots in the UHS-OMAG image are not clear. One possible reason could be that the sweat ducts generate high-reflection OCT signals due to the large refractive index difference between the wall of the spiral lumen and the keratinous epidermal tissue, leading to static artifacts in the UHS-OMAG image. At the depth range (2), which includes the VE and the junction between the VE and the PD (149 to 268 μm below the surface), the vessels appeared as small bright spots or short lines, which could be clearly observed in the cmOCT and the mOMAG images. These vessels are vertically oriented capillary loops feeding the epidermis that connects to the underlying superficial vascular plexus.23,31,33 However, the vessel networks were quite noisy in the UHS-OMAG image. At the depth of range (3) (324 to 588 μm below the surface) corresponding to the RD layer, the superficial vascular plexus with dense planar capillaries was visible in all of the MIP views.23,31,33 The cmOCT image showed the poorest contrast and the lowest spatial resolution in the vasculature. The image degradation was due to the larger decorrelation noises arising from the low static signals below the RD vessels as shown in Fig. 3(d). From the depth-resolved projection views, we can see that the proposed mOMAG provided the cleanest and highly resolved microvascular networks of the human palm skin. The merged images of the en face MIP views at the three different depth ranges for each method are shown in Fig. 4(c), where the projection views at the depth ranges (1), (2), and (3) are colored as blue, green, and red, respectively.
Fig. 4.

En face (XY) maximum intensity projection (MIP) view images [] of the human palm vasculature at different depths. The imaging area is indicated in Fig. 3(a). (a) Three-dimensional rendering of the human palm OCT structure. (b) En face MIP views of the vasculatures obtained with the UHS-OMAG, cmOCT, and mOMAG over different depth ranges in the skin—top: 61 to 105 μm, middle: 149 to 268 μm, bottom: 324 to 588 μm. Each depth range is marked as numbers (1 to 3) in (a). (c) Merged images of the MIP views at the three different depth ranges for each method. The projection views at the depth ranges (1), (2), and (3) are colored as blue, green, and red, respectively.
3.3. In Vivo Microangiographic Assessment of Scarred Human Skin
With the proposed method, we further demonstrated in vivo assessment of tissue injury on human skin. In this pilot study, vasculature of the cutaneous burn scar of a human subject was evaluated with the mOMAG microangiograms. Compared to a standard visual inspection of the burn scar,40 the scar vascularity would be a potential indicator to assess the scar progression, providing early diagnosis and proper treatment of pathological scarring.27 Vascular imaging was carried out over a 10-month-old scar resulting from an accident radiation burn with a laser on a left dorsal hand of a 34-year-old male subject. Figure 5(a) is a photograph of the left dorsal hand, where the imaging areas () are located in a solid box (scar) and a dashed box (normal) on the skin surface. En face (XY) MIP views of 3-D mOMAG vasculatures of the normal skin and the burn scar over depth of from the surface are shown in Figs. 5(b) and 5(c), respectively. Visually, most of the vessels in the burn scar were much larger in diameter and abundant than those in the normal skin. The scar vessel diameters ranged from 30 to 70 μm, whereas the normal skin had vessel diameters . For quantitative assessment of the vasculatures, vessel area density (VAD) was calculated within a small window () and mapped by sliding the window across the whole image.41 The window size of 32 pixels () was large enough to include one or more vessels in our experiment. Figures 5(d) and 5(e) show the color-coded VAD maps of the normal skin and the burn scar, respectively. Several reddish areas () are apparent in the scar vasculature [Fig. 5(e)] compared to the normal one [Fig. 5(d)], meaning the burn scar exhibits larger portion of the vessel area per unit area of the tissue compared to the normal skin. Mean and sd of each VAD map was determined to be (normal skin) and (burn scar), as shown in Fig. 5(f). The vessel dilation and proliferation in the scar tissue were well correlated with results of previous studies.27,42 This demonstration indicates that the proposed approach may be effective in the assessment of the microvasculatures of human skin lesions in vivo.
Fig. 5.

(a) Photograph of a 10-month-old scar due to a laser burn (a solid box) and an adjacent normal skin (a dashed box) on the left dorsal hand of a human subject. (b) and (c) En face (XY) MIP view images [] of the vasculatures over a physical depth of 719 μm below the surface of the normal skin tissue and the scarred tissue. (d) and (e) Color-coded vessel density area maps of the normal skin and the scarred tissue, respectively, and their mean and standard deviation values are represented as error bars in (f).
4. Conclusion
In summary, we have presented a method capable of providing improved blood-flow images of highly scattering human skin tissue using a modified OCT microangiography technique that utilizes the VCSEL SS-OCT system. The method consists of masking UHS-OMAG image with a binary representation of cmOCT image, leading to reduction of the residual static artifacts. The technique has been tested with a tissue-like flow phantom and compared with the conventional UHS-OMAG and cmOCT methods, showing that it delivered higher contrast in the flow image. From the vascular imaging results obtained from human subject, it was found that the proposed method (mOMAG) delineated the cleanest microvessel networks for the skin tissue compared to the other two methods. Further, the clinical potential of mOMAG was investigated with quantitative assessment of vasculature in a human burn scar in vivo. Significant vascular difference was found between normal and scarred skin regions. Therefore, we believe that our proposed method is of clinical value, which may help evaluate skin microvasculature and its related diseases.
Acknowledgments
This work was supported in part by NIH R01EB009682, R01HL093140, the Coulter Translational Research Partnership Program, Research to Prevent Blindness, and the Department of Bioengineering at the University of Washington.
Biography
Biographies of the authors are not available.
References
- 1.Bouma B. E., et al. , “Fourier-domain optical coherence tomography: recent advances toward clinical utility,” Curr. Opin. Biotechnol. 20(1), 111–118 (2009). 10.1016/j.copbio.2009.02.007 [DOI] [PMC free article] [PubMed] [Google Scholar]
- 2.Zysk A. M., et al. , “Optical coherence tomography: a review of clinical development from bench to bedside,” J. Biomed. Opt. 12(5), 051403 (2007). 10.1117/1.2793736 [DOI] [PubMed] [Google Scholar]
- 3.Nguyen F. T., et al. , “Intraoperative evaluation of breast tumor margins with optical coherence tomography,” Cancer Res. 69(22), 8790–8796 (2009). 10.1158/0008-5472.CAN-08-4340 [DOI] [PMC free article] [PubMed] [Google Scholar]
- 4.Liu L., et al. , “Imaging the subcellular structure of human coronary atherosclerosis using micro-optical coherence tomography,” Nat. Med. 17(8), 1010–1015 (2011). 10.1038/nm.2409 [DOI] [PMC free article] [PubMed] [Google Scholar]
- 5.Wang R. K., et al. , “Three dimensional optical angiography,” Opt. Express 15(7), 4083–4097 (2007). 10.1364/OE.15.004083 [DOI] [PubMed] [Google Scholar]
- 6.Barton J. K., Stromski S., “Flow measurement without phase information in optical coherence tomography images,” Opt. Express 13(14), 5234–5239 (2005). 10.1364/OPEX.13.005234 [DOI] [PubMed] [Google Scholar]
- 7.Jia Y., et al. , “Split-spectrum amplitude-decorrelation angiography with optical coherence tomography,” Opt. Express 20(4), 4710–4725 (2012). 10.1364/OE.20.004710 [DOI] [PMC free article] [PubMed] [Google Scholar]
- 8.Blatter C., et al. , “Ultrahigh-speed non-invasive widefield angiography,” J. Biomed. Opt. 17(7), 070505 (2012). 10.1117/1.JBO.17.7.070505 [DOI] [PubMed] [Google Scholar]
- 9.Mariampillai A., et al. , “Speckle variance detection of microvasculature using swept-source optical coherence tomography,” Opt. Lett. 33(13), 1530–1532 (2008). 10.1364/OL.33.001530 [DOI] [PubMed] [Google Scholar]
- 10.Mahmud M. S., et al. , “Review of speckle and phase variance optical coherence tomography to visualize microvascular networks,” J. Biomed. Opt. 18(5), 050901 (2013). 10.1117/1.JBO.18.5.050901 [DOI] [PubMed] [Google Scholar]
- 11.Motaghiannezam S. M. R., Koos D., Fraser S. E., “Differential phase-contrast, swept-source optical coherence tomography at 1060 nm for in vivo human retinal and choroidal vasculature visualization,” J. Biomed. Opt. 17(2), 026011 (2012). 10.1117/1.JBO.17.2.026011 [DOI] [PubMed] [Google Scholar]
- 12.Vakoc B. J., et al. , “Three-dimensional microscopy of the tumor microenvironment in vivo using optical frequency domain imaging,” Nat. Med. 15(10), 1219–1223 (2009). 10.1038/nm.1971 [DOI] [PMC free article] [PubMed] [Google Scholar]
- 13.Kim D. Y., et al. , “Noninvasive imaging of the foveal avascular zone with high-speed, phase-variance optical coherence tomography,” Invest. Ophthalmol. Vis. Sci. 53(1), 85–92 (2012). 10.1167/iovs.11-8249 [DOI] [PMC free article] [PubMed] [Google Scholar]
- 14.Jung Y., Zhi Z., Wang R. K., “Three-dimensional optical imaging of microvascular networks within intact lymph node in vivo,” J. Biomed. Opt. 15(5), 050501 (2010). 10.1117/1.3496301 [DOI] [PMC free article] [PubMed] [Google Scholar]
- 15.Zhi Z., et al. , “Supercontinuum light source enables in vivo optical microangiography of capillary vessels within tissue beds,” Opt. Lett. 36(16), 3169–3171 (2011). 10.1364/OL.36.003169 [DOI] [PMC free article] [PubMed] [Google Scholar]
- 16.An L., et al. , “High-resolution wide-field imaging of retinal and choroidal blood perfusion with optical microangiography,” J. Biomed. Opt. 15(2), 026011 (2010). 10.1117/1.3369811 [DOI] [PMC free article] [PubMed] [Google Scholar]
- 17.Wang R. K., et al. , “Optical microangiography provides depth-resolved images of directional ocular blood perfusion in posterior eye segment,” J. Biomed. Opt. 15(2), 020502 (2010). 10.1117/1.3353958 [DOI] [PMC free article] [PubMed] [Google Scholar]
- 18.den Uil C. A., et al. , “The microcirculation in health and critical disease,” Prog. Cardiovasc. Dis. 51(2), 161–170 (2008). 10.1016/j.pcad.2008.07.002 [DOI] [PubMed] [Google Scholar]
- 19.Chao C. Y. L., Cheing G. L. Y., “Microvascular dysfunction in diabetic foot disease and ulceration,” Diabetes Metab. Res. Rev. 25(7), 604–614 (2009). 10.1002/dmrr.v25:7 [DOI] [PubMed] [Google Scholar]
- 20.Ohtsuka T., “Quantitative analysis of nailfold capillary abnormalities in patients with connective tissue diseases,” Int. J. Dermatol. 38(10), 757–764 (1999). 10.1046/j.1365-4362.1999.00773.x [DOI] [PubMed] [Google Scholar]
- 21.Holowatz L. A., Thompson-Torgerson C. S., Kenney W. L., “The human cutaneous circulation as a model of generalized microvascular function,” J. Appl. Physiol. 105(1), 370–372 (2008). 10.1152/japplphysiol.00858.2007 [DOI] [PubMed] [Google Scholar]
- 22.Qin J., et al. , “In vivo volumetric imaging of microcirculation within human skin under psoriatic conditions using optical microangiography,” Laser Surg. Med. 43(2), 122–129 (2011). 10.1002/lsm.v43.2 [DOI] [PMC free article] [PubMed] [Google Scholar]
- 23.An L., Qin J., Wang R. K., “Ultrahigh sensitive optical microangiography for in vivo imaging of microcirculation within human skin tissue beds,” Opt. Express 18(8), 8220–8228 (2010). 10.1364/OE.18.008220 [DOI] [PMC free article] [PubMed] [Google Scholar]
- 24.Lee K. K. C., et al. , “Real-time speckle variance swept-source optical coherence tomography using a graphics processing unit,” Biomed. Opt. Express 3(7), 1557–1564 (2012). 10.1364/BOE.3.001557 [DOI] [PMC free article] [PubMed] [Google Scholar]
- 25.Mariampillai A., et al. , “Optimized speckle variance OCT imaging of microvasculature,” Opt. Lett. 35(8), 1257–1259 (2010). 10.1364/OL.35.001257 [DOI] [PubMed] [Google Scholar]
- 26.Enfield J., Jonathan E., Leahy M., “In vivo imaging of the microcirculation of the volar forearm using correlation mapping optical coherence tomography (cmOCT),” Biomed. Opt. Express 2(5), 1184–1193 (2011). 10.1364/BOE.2.001184 [DOI] [PMC free article] [PubMed] [Google Scholar]
- 27.Liew Y. M., et al. , “In vivo assessment of human burn scars through automated quantification of vascularity using optical coherence tomography,” J. Biomed. Opt. 18(6), 061213 (2013). 10.1117/1.JBO.18.6.061213 [DOI] [PubMed] [Google Scholar]
- 28.Subhash H. M., Leahy M. J., “Microcirculation imaging based on full-range high-speed spectral domain correlation mapping optical coherence tomography,” J. Biomed. Opt. 19(2), 021103 (2014). 10.1117/1.JBO.19.2.021103 [DOI] [PubMed] [Google Scholar]
- 29.Subhash H. M., Leahy M., “High-speed, high-sensitivity spectral-domain correlation mapping optical coherence tomography based modified scanning protocol,” Proc. SPIE 8571, 85712I (2013). 10.1117/12.2006055 [DOI] [Google Scholar]
- 30.Liu G., et al. , “High-resolution imaging of microvasculature in human skin in-vivo with optical coherence tomography,” Opt. Express 20(7), 7694–7705 (2012). 10.1364/OE.20.007694 [DOI] [PMC free article] [PubMed] [Google Scholar]
- 31.Liu G., et al. , “A comparison of Doppler optical coherence tomography methods,” Biomed. Opt. Express 3(10), 2669–2680 (2012). 10.1364/BOE.3.002669 [DOI] [PMC free article] [PubMed] [Google Scholar]
- 32.Watanabe Y., Takahashi Y., Numazawa H., “Graphics processing unit accelerated intensity-based optical coherence tomography angiography using differential frames with real-time motion correction,” J. Biomed. Opt. 19(2), 021105 (2014). 10.1117/1.JBO.19.2.021105 [DOI] [PubMed] [Google Scholar]
- 33.Blatter C., et al. , “In situ structural and microangiographic assessment of human skin lesions with high-speed OCT,” Biomed. Opt. Express 3(10), 2636–2646 (2012). 10.1364/BOE.3.002636 [DOI] [PMC free article] [PubMed] [Google Scholar]
- 34.Wang R. K., et al. , “Depth-resolved imaging of capillary networks in retina and choroid using ultrahigh sensitive optical microangiography,” Opt. Lett. 35(9), 1467–1469 (2010). 10.1364/OL.35.001467 [DOI] [PMC free article] [PubMed] [Google Scholar]
- 35.Wang R. K., Ma Z., “A practical approach to eliminate autocorrelation artefacts for volume-rate spectral domain optical coherence tomography,” Phys. Med. Biol. 51(12), 3231–3239 (2006). 10.1088/0031-9155/51/12/015 [DOI] [PubMed] [Google Scholar]
- 36.Fingler J., et al. , “Volumetric microvascular imaging of human retina using optical coherence tomography with a novel motion contrast technique,” Opt. Express 17(24), 22190–22200 (2009). 10.1364/OE.17.022190 [DOI] [PMC free article] [PubMed] [Google Scholar]
- 37.Subhash H. M., et al. , “Volumetric in vivo imaging of microvascular perfusion within the intact cochlea in mice using ultra-high sensitive optical microangiography,” IEEE Trans. Med. Imaging 30(2), 224–230 (2011). 10.1109/TMI.2010.2072934 [DOI] [PMC free article] [PubMed] [Google Scholar]
- 38.Alex A., et al. , “Multispectral in vivo three-dimensional optical coherence tomography of human skin,” J. Biomed. Opt. 15(2), 026025 (2010). 10.1117/1.3400665 [DOI] [PubMed] [Google Scholar]
- 39.Sand M., et al. , “Evaluation of the epidermal refractive index measured by optical coherence tomography,” Skin Res. Technol. 12(2), 114–118 (2006). 10.1111/srt.2006.12.issue-2 [DOI] [PubMed] [Google Scholar]
- 40.van Zuijlen P. P. M., et al. , “Scar assessment tools: implications for current research,” Plast. Reconstr. Surg. 109(3), 1108–1122 (2002). 10.1097/00006534-200203000-00052 [DOI] [PubMed] [Google Scholar]
- 41.Reif R., et al. , “Quantifying optical microangiography images obtained from a spectral domain optical coherence tomography system,” Int. J. Biomed. Imaging 2012, 509783 (2012). 10.1155/2012/509783 [DOI] [PMC free article] [PubMed] [Google Scholar]
- 42.Kurokawa N., Ueda K., Tsuji M., “Study of microvascular structure in keloid and hypertrophic scars: density of microvessels and the efficacy of three-dimensional vascular imaging,” J. Plast. Surg. Hand. Surg. 44(6), 272–277 (2010). 10.3109/2000656X.2010.532923 [DOI] [PubMed] [Google Scholar]