

Abstract
The early events in the retrovirus assembly pathway, particularly the timing and nature of Gag translocation from the site of protein translation to the inner leaflet of the plasma membrane, are poorly understood. We have investigated the interrelationship between cytoplasmic Gag concentration and plasma membrane association using complementary live-cell biophysical fluorescence techniques in real-time with both the human T-cell leukemia virus type 1 (HTLV-1) and human immunodeficiency virus type 1 (HIV-1) Gag proteins. In particular, dual-color, z-scan fluorescence fluctuation spectroscopy (dcz-FFS) in conjunction with total internal reflection fluorescence (TIRF) and conventional, epi-illumination imaging were utilized. Our results demonstrate that HTLV-1 Gag is capable of membrane targeting and particle assembly at low (i.e., nM) cytoplasmic concentrations, and that there is a critical threshold concentration (approaching μM) prior to the observation of HIV-1 Gag associated with the plasma membrane. These observations imply fundamental differences between HIV-1 and HTLV-1 Gag trafficking and membrane association.
Introduction
The late phase of the retrovirus life cycle involves the synthesis, trafficking and assembly of viral RNA and protein, which result in the release of virus particles from the plasma membrane of infected cells 1. The Gag polyprotein is the key structural protein in retrovirus assembly and release 2. Gag expression alone can result in the assembly and release of immature virus-like particles (VLPs), and serves as a model system for the virus assembly process 3. The retroviral protease cleaves Gag into three structural domains – matrix (MA), capsid (CA), and nucleocapsid (NC). These domains play critical roles in the assembly of immature virus particles. The matrix domain is the primary driver of Gag association with the inner leaflet of the plasma membrane 4; 5; 6; 7; 8, the capsid domain plays a critical role in Gag-Gag interactions which lead to the formation of the immature virus lattice 9; 10; 11, and the nucleocapsid domain is critical for genome recognition and Gag-Gag interactions 12; 13; 14.
There has been intense interest in the trafficking of Gag from the site of translation in the cytoplasm to its association at sites along the inner leaflet of the plasma membrane where viral particle assembly occurs (for a recent review, see 4). This interest has led to detailed studies, most notably with human immunodeficiency virus type 1 (HIV-1). Presently, the mechanistic understanding of HIV-1 Gag membrane targeting is often used as a model for other retroviruses. This approach is useful due to high structural homology between different retroviruses, particularly in the matrix domain 15; 16. In comparison of HIV-1 and human T-cell leukemia virus type 1 (HTLV-1) Gag, both matrix domains contain a bipartite membrane binding signal – i.e., positively charged amino acids which interact with negatively charged lipids, and a hydrophobic myristoyl moiety that can insert into the plasma membrane upon Gag binding.
Despite similarities in the translocation of HIV-1 and HTLV-1 Gag from the cytoplasm to the plasma membrane, distinct differences have been observed. First, previous studies have suggested that low-order HIV-1 Gag-Gag interactions (e.g., dimers, trimers) occurring in the cytoplasm of cells promote translocation of Gag in the cytoplasm to the inner leaflet of the plasma membrane 17; 18; 19. HIV-1 Gag-Gag interactions in the cytoplasm are driven by a concentration-dependent equilibrium 20; 21. Thus, at lower Gag expression levels, there is a lack of both Gag-Gag interactions as well as trafficking of Gag to the plasma membrane 22. Second, in contrast to HIV-1 Gag, studies of cytoplasmic HTLV-1 Gag provide evidence that Gag homo-interactions in the cytoplasm have lower affinity compared to that of HIV-1 Gag 20; 23; 24. A recent study found a general absence of HTLV-1 Gag-Gag interactions in the cytoplasm 20. In particular, an unbiased brightness characterization of cytoplasmic Gag was done by avoiding the membrane-bound fraction, which revealed previously unknown differences in Gag behavior – i.e., HIV-1 Gag exhibits concentration-dependent oligomerization in the cytoplasm, whereas HTLV-1 Gag lacks significant cytoplasmic Gag-Gag interactions.
The differences observed between the cytoplasmic self-association of HIV-1 and HTLV-1 Gag may imply differences in the initiation of Gag translocation from the cytoplasm to the plasma membrane. A recent study provides some support for this 25. In particular, no dependence of HTLV-1 Gag membrane targeting on specific interactions with P(4,5)IP2 was observed, in contrast to that of HIV-1. In addition, HTLV-1 Gag membrane targeting was not influenced by the presence of RNA, which is in contrast to that observed with HIV-1, where RNA binding to the HIV-1 MA domain of Gag inhibits interactions with the plasma membrane 26; 27; 28.
In the present study, we investigated the differences between HIV-1 and HTLV-1 Gag cytoplasmic oligomerization and membrane association. In particular, we investigated how differences in HIV-1 and HTLV-1 Gag cytoplasmic self-association behavior impact membrane association. Complementary biophysical fluorescence techniques capable of monitoring the various pools of Gag (i.e., membrane and cytoplasmic) were utilized in real-time in living cells 20. In particular, dual-color, z-scan fluorescence fluctuation spectroscopy (dcz-FFS) in conjunction with total internal reflection fluorescence (TIRF) and conventional, epi-illumination imaging were used in an integrated manner to monitor the Gag cytoplasmic oligomerization and Gag association with the plasma membrane, which extends upon previous studies 29; 30; 31; 32; 33; 34. Our results demonstrate that HTLV-1 Gag becomes associated with the plasma membrane and assembles particles at nanomolar concentrations, while HIV-1 Gag needs to reach a micromolar concentration threshold in order to associate with the plasma membrane and initiate virus assembly. This observation strongly suggests fundamental differences between HIV-1 and HTLV-1 Gag trafficking and membrane association.
Results
Experimental approach for studying Gag-membrane association
To correlate HTLV-1 and HIV-1 Gag-EYFP cytoplasmic concentrations with the presence of a membrane-bound Gag population, we used a binary classification system. When fluorescence measurements revealed evidence for membrane bound Gag-EYFP in a particular cell (e.g., fluorescent Gag puncta), the cell was designated as having a “membrane-positive” phenotype. Conversely, when Gag-EYFP was strictly cytoplasmic in the cell, the cell was designated as having a “membrane-negative” phenotype. Use of this classification system provided a quantitative assessment of Gag-membrane association depending on the relative abundance of cytoplasmic Gag protein. The presence of Gag-EYFP at the plasma membrane was assessed using three different fluorescence methodologies: dcz-FFS, epifluorescence and TIRF microscopy.
Every cell was initially assessed by epifluorescence microscopy to check for the presence or absence of bright fluorescent Gag puncta, which are putative sites of VLP assembly at the plasma membrane 30; 35. While visible puncta generally represent a membrane-positive phenotype when associated with the inner leaflet of the plasma membrane, the absence of puncta was not sufficient to establish a membrane-negative phenotype. A recent fluorescence study identified a second pool of membrane-bound Gag 20, which is relatively diffuse and not highly oligomerized (i.e. non-punctate). This population is dimly fluorescent and thus not apparent in typical epifluorescence images due to the abundance of cytoplasmic signal.
Detecting the presence of this dimly fluorescent population of membrane-bound Gag requires a dcz-FFS measurement of the living cell. This measurement is also required in order to determine the cytoplasmic concentration and oligomerization of Gag-EYFP 20. The dcz-FFS technique consists of two functionalities; a z-scan functionality, and an FFS functionality. Since detailed descriptions of FFS are available 36; 37; 38, a description is provided only for the z-scan component. Briefly, the two-photon focus of a laser beam is scanned axially through a cell expressing Gag-EYFP and mCherry to produce an intensity profile for each protein at the scan location. Comparison of the intensity profile of Gag-EYFP (Figure 1, solid line) and mCherry (Figure 1, asterisks) can be used to assess the presence of membrane-bound Gag, as illustrated in Figure 1 (see also Supplemental Section 1). Because mCherry is located in the cytoplasm, its profile serves to calibrate a purely cytoplasmic protein distribution. Thus, if the two intensity profiles overlap, as shown in panel A of Figure 1, Gag-EYFP is entirely cytoplasmic at the scanned location. However, if the two intensity profiles are statistically different (Figure 1, panels B and C), a population of EYFP-Gag bound to the membrane must be present at the scan location. Panel B clearly shows that the Gag-EYFP profile exhibits an increase in fluorescence intensity at z-positions corresponding to the top and bottom membranes. The scale of these intensity peaks relative to the cytoplasmic intensity recorded in the middle region indicates that the amount of Gag-EYFP at this membrane location is not much higher than the concentration in the cytoplasm, and thus the detected membrane-bound Gag-EYFP is dim and non-punctate. In contrast, panel C of Figure 1 illustrates the z-scan conducted at a site of a Gag-EYFP punctum. Because puncta contain hundreds to thousands of copies of Gag-EYFP, the intensity amplitude of Gag-EYFP at the membrane dwarfs the intensity signal from cytoplasmic Gag-EYFP.
Figure 1.

Dual-color, z-scan fluorescence fluctuation spectroscopy. In dual-color, z-scan fluorescence fluctuation spectroscopy, the z-scan fluorescence intensity profile is measured by scanning the two-photon focus vertically through a cytoplasmic section of a cell co-expressing mCherry and the protein of interest (i.e., HTLV-1 Gag-EYFP). The presence or absence of Gag-EYFP at the membrane is established by comparing the intensity profiles of mCherry and Gag-EYFP. A. Coincidence of mCherry and Gag-EYFP in the cytoplasm. Because the intensity profiles (normalized to an amplitude of one) of mCherry and Gag-EYFP coincide, Gag-EYFP is strictly cytoplasmic at the scan location. B. Non-punctate Gag-EYFP at the plasma membrane. The presence of non-punctate Gag-EYFP at the membrane leads to extra fluorescence signal when the focus passes through each membrane, giving rise to an intensity profile that departs from that of the strictly cytoplasmic mCherry. C. Punctate fluorescence of Gag-EYFP at the plasma membrane. The z-scan through a Gag-EYFP punctum results in a prominent intensity spike that is absent in the mCherry z-scan data. The representative intensity profiles shown are not normalized in order to best visualize the spike.
While Figure 1 only shows intensity profiles from representative cells expressing HTLV-1 Gag-EYFP and mCherry, dcz-FFS measurements were performed on all cells in this study (see Supplemental Section 1 for additional data). Since a dcz-FFS measurement only probes a specific location within a cell, a minimum of two-different positions within each cell were selected for dcz-FFS measurements. Analysis revealed that while the surface coverage and density of membrane-bound Gag was spatially heterogeneous, the cytoplasmic Gag concentration and degree of cytoplasmic oligomerization were consistent within individual cells.
In addition, we conducted objective-based TIRF imaging, where the laser light is directed to the cell through the objective, which also collects the emitted fluorescence light. Objective-based TIRF was used to image ~20% of cells investigated in this study in order to obtain an image-based characterization of the membrane-bound population of Gag within cells. The shallow excitation profile of TIRF mainly excites Gag-EYFP bound to the membrane, with minimal contributions from the cytoplasmic pool of Gag-EYFP. Thus, TIRF images will show puncta that are present at the ventral plasma membrane. Regions without a punctum display a dim and diffuse fluorescence signal due to cytoplasmic Gag-EYFP residing within the shallow excitation field as well as non-punctate Gag-EYFP bound to the plasma membrane. The fluorescence contribution from cytoplasmic Gag-EYFP scales with concentration, and therefore can be predicted for each TIRF image. Using this approach we compared the fluorescence intensity of a TIRF image with the value predicted from the cytoplasmic contribution. The additional presence of a membrane-bound Gag-EYFP population increased the TIRF signal, and thus led to an experimental TIRF intensity that exceeded the predicted value. We introduced the TIRF ratio as a quantitative measure of this excess intensity (see Material and Methods section and Supplemental Section 2 for a detailed description). Any TIRF experiment that indicated the presence of membrane-bound Gag-EYFP was independently verified by additional dcz-scan FFS experiments. Specifically, if epifluorescence, TIRF, or dcz-scan FFS revealed any evidence for membrane-bound Gag-EYFP in a particular cell, the cell was designated as having a “membrane-positive” phenotype. Conversely, if all measurements are consistent with Gag-EYFP being strictly cytoplasmic, the cell was designated as having a “membrane-negative” phenotype.
HIV-1 Gag-EYFP cytoplasmic concentration versus membrane association
Experiments were conducted in order to analyze the correlation between cytoplasmic HIV-1 Gag-EYFP concentration and Gag-membrane association. Figure 2A shows the results from the analysis of cells expressing HIV-1 Gag-EYFP. The x-axis depicts the Gag cytoplasmic concentration as measured by dcz-FFS. The y-axis identifies the positive or negative designation for membrane-bound Gag obtained using dcz-FFS (see also Supplemental Figure S1, panels A–D). The data indicates that the detection of HIV-1 Gag at the plasma membrane is concentration dependent, with a transition from a membrane-negative to a positive phenotype occurring at a cytoplasmic Gag concentration of ~500 nM.
Figure 2.
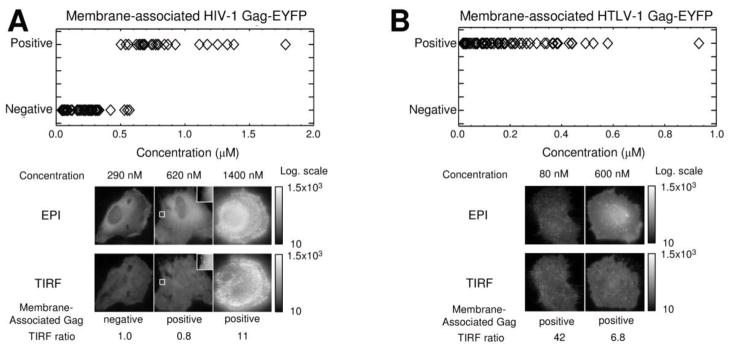
Analysis of the correlation between cytoplasmic Gag-EYFP concentration and Gag-membrane association. A. Concentration dependence of HIV-1 Gag-EYFP membrane association. Shown is a graph of HIV-1 Gag-EYFP cytoplasmic concentration versus the presence of membrane-associated Gag as determined by dcz-FFS. A transition from membrane-bound Gag negative to membrane-associated Gag positive occurs at ~500 nM. Epifluorescence (EPI)- and total internal reflection fluorescence (TIRF) images of representative cells expressing HIV-1 Gag-EYFP at varying cytoplasmic concentrations are displayed on a logarithmic intensity scale with a lower cutoff of 10 counts. Epifluorescence and TIRF image of a cell (c = 290 nM) with membrane-negative phenotype as determined by the TIRF ratio and additional dcz-FFS measurements (see Materials and Methods for details on methodologies). Epifluorescence and TIRF image of a cell (c = 620 nM) reveals puncta formation. The insets in both images show the magnified and intensity-rescaled region of interest to clearly visualize the nascent punctum. Epifluorescence and TIRF image of a cell (c = 1400 nM) with bright, punctate Gag fluorescence is identified as membrane positive. B. Association of HTLV-1 Gag-EYFP independent of cytosolic concentration. Shown is a graph of HTLV-1 Gag-EYFP cytoplasmic concentration versus membrane-associated Gag as determined by dcz-FFS. Epifluorescence and TIRF images of representative cells expressing HTLV-1 Gag-EYFP at varying cytoplasmic concentrations. Two cells (c = 80 nM and c = 600 nM, respectively) are shown with punctate Gag fluorescence readily visible.
Representative epifluorescence and TIRF images of cells are shown in Figures 2A to illustrate cell phenotype below, above and at the transition concentration identified in the dcz-FFS data. The intensities of the images are represented on a logarithmic scale so that relatively dim features were visualized alongside the intensely bright puncta. The left-hand images of figure 2A show the epifluorescence- and TIRF-image of a low-concentration cell (290 ± 9 nM), which exhibited diffuse fluorescence staining with no visible puncta. To determine whether the diffuse fluorescence of the TIRF image is consistent with purely cytoplasmic Gag-EGFP, we calculated the TIRF ratio rTIRF, which is defined as the actual maximum fluorescence signal (FmaxTIRF) divided by the cytoplasmic concentration c times a scaling factor s. If rTIRF for a cytoplasmic protein is ~1, then the TIRF image is consistent with the HIV-1 Gag-EYFP being cytoplasmic; a ratio that exceeds 2 is indicative of membrane-associated HIV-1 Gag-EYFP (Supplemental Section 2). The ratio rTIRF of the image was calculated and found to be close to 1 (Supplemental Figure S6A) as expected for a strictly cytoplasmic protein species. In addition, dcz-FFS z-scans indicated an absence of membrane-bound Gag. This cell was designated “membrane-negative”. Conversely, the high concentration cell (1380 ± 90 nM, right-side) features clear punctate staining, which is indicative of membrane-bound Gag complexes. This cell was designated as “membrane-positive.” Finally, the epifluorescence and TIRF image of a cell expressing Gag in the transition range (620 ± 10 nM, middle) is shown. A single, nascent punctum was observed in both images (see also Supplemental Figure S7), and the cell was designated as “membrane-positive”.
HTLV-1 Gag-EYFP cytoplasmic concentration versus membrane association
Figure 2B lists the phenotypes of cells expressing HTLV-1 Gag-EYFP versus cytoplasmic protein concentration as determined by dcz-FFS measurements. The data contrasts markedly to that of HIV-1 Gag-EYFP, as “membrane-positive” results were observed independent of HTLV-1 Gag-EYFP concentration (see also Supplemental Figure S1, panels E–G). This observation is supported by epifluorescence- and TIRF images of a cell expressing HTLV-1 Gag-EYFP at a lower (80 ± 5 nM, left) and a higher (600 ± 20 nM, right) concentration, as puncta are clearly visible in all images. All HTLV-1 Gag-EYFP measurements were found to be “membrane-positive”, implying that HTLV-1 Gag-EYFP associates with the inner leaflet of the plasma membrane, regardless of Gag expression level. The concentration-independence of HTLV-1 Gag membrane targeting implies that there is no membrane targeting dependence of HTLV-1 Gag on Gag-Gag interactions in the cytoplasm.
HIV-1 MA remains cytoplasmic, while HTLV-1 MA is associated with membrane
The data with the full-length HIV-1 and HTLV-1 Gag proteins revealed apparent differences in their membrane targeting behavior. To further investigate these differences, fluorescently-labeled HIV-1 and HTLV-1 MA domains were individually studied to determine their relative ability to associate with the plasma membrane. HIV-1 and HTLV-1 MA-EYFP were expressed in HeLa cells and investigated. The data for the HIV-1 and HTLV-1 MA proteins are shown in Figure 3.
Figure 3.
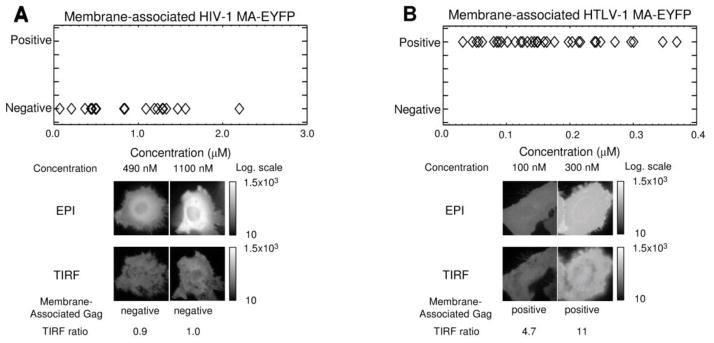
Correlation of HIV-1 and HTLV-1 MA-EYFP membrane-binding with cytoplasmic concentration. A. HIV-1 MA-EYP is a cytosolic protein. Shown is a graph of HIV-1 MA-EYFP cytoplasmic concentration versus the presence of membrane-associated MA as determined by dcz-FFS. Epifluorescence and TIRF images of representative cells expressing HIV-1 MA-EYFP at varying cytoplasmic concentrations are shown. Epifluorescence and TIRF images of two membrane-negative cell (c = 490 nM and c = 1100 nM) as determined by dcz-FFS and by the TIRF ratio are shown. B. HTLV-1 MA-EYFP is a membrane-associated protein. Shown is a graph of HTLV-1 MA-EYFP cytoplasmic concentration versus the presence of membrane-associated MA as determined by dcz-FFS. Epifluorescence and TIRF imaging of representative cells expressing HTLV-1 MA-EYFP at varying cytoplasmic concentrations. Epifluorescence and TIRF cell images are shown (c = 100 nM and c =300 nM, respectively), which were identified as membrane positive by dcz-FFS and by the TIRF ratio.
Figure 3A indicates the phenotype of cells expressing HIV-1 MA-EYFP versus cytoplasmic protein concentration as determined by dcz-FFS measurements. All z-scans indicated the absence of membrane-associated Gag (see also Supplemental Figure S2, panels A–C), and imaging confirmed these observations. Representative epifluorescence and TIRF images for cells expressing low (490 ± 10 nM, left) and high (1130 ± 30 nM, right) levels of protein revealed a diffuse, typically cytoplasmic distribution of the HIV-1 MA-EYFP. The ratio rTIRF for both images was calculated and found to be close to 1 (Supplemental Figure S6, panels F and G), a value that is consistent with a purely cytoplasmic protein population. The HIV-1 MA domain of Gag is important for Gag-membrane interactions. Previous observations have indicated that expression of HIV-1 MA does not result in a significant amount of homo-interactions at physiological concentrations 12; 39. This suggests that HIV-1 MA would remain cytoplasmic and not associate with the plasma membrane.
The dcz-FFS z-scans of cells expressing HTLV-1 MA-EYFP resulted in membrane-positive observations at all concentrations measured (Figure 3B and Supplemental Figure S2, panels D–F). Representative images of cells expressing HTLV-1 MA-EYFP at different concentrations (101 ± 5 nM, left; 300 ± 10 nM, right) do not reveal any punctate staining typical of membrane-bound protein. However, the intensity of TIRF images was higher than expected for a cytoplasmic protein. The ratio rTIRF was found to be > 2 (Supplemental Figure S6, panels H and I), indicating an elevated presence of HTLV-1 MA-EYFP at the plasma membrane. Therefore, both dcz-FFS and TIRF imaging confirmed that all cells expressing HTLV-1 MA-EYFP exhibited a membrane-positive phenotype. The lack of punctate fluorescence was not surprising since the CA and NC domains are thought to be responsible for the Gag-Gag interactions required for puncta formation. Taken together, the data with HIV-1 MA-EYFP and HTLV-1 MA-EYFP strongly suggests that while HIV-1 MA-EYFP exists as a cytoplasmic protein, HTLV-1 MA-EYFP stably associates with the inner leaflet of the plasma membrane.
HIV-1 G2A-Gag-EYFP remains cytoplasmic, while HTLV-1 G2A-Gag-EYFP maintains membrane association at high concentrations
The HTLV-1 and HIV-1 MA domains contain the bipartite membrane targeting myristoylation signal 15; 40. Specific interactions also play a role in HIV-1 Gag-membrane association and may also contribute to HTLV-1 Gag-membrane association 6; 41; 42; 43. To help further address how myristoylation affects Gag membrane targeting, we investigated unmyristoylated (G2A) HIV-1 and HTLV-1 Gag mutants, which have been previously shown to be membrane binding deficient for HIV-1 44 and HTLV-1 24; 45. Based upon available information, we speculated that these Gag G2A mutants would be cytoplasmic proteins at all concentrations measured, and typically have a membrane-negative phenotype.
The HIV-1 G2A Gag-EYFP was found by dcz-FFS z-scans to be membrane-negative at all concentrations (Figure 4A and Supplemental Figure S3, panels A–C). The normalized brightness, reported as stoichiometry, from the dcz-FFS measurements is shown in Figure 4A (middle panel) to identify Gag-Gag interactions in the cytoplasm. The normalized brightness measured by FFS is a direct measure of the average protein stoichiometry 36; 37. Specifically, a stoichiometry of 1 (dashed line) corresponds to monomeric G2A Gag-EYFP in the cytoplasm. The dcz-FFS data from G2A Gag-EYFP Gag in the cytoplasm is represented by asterisks, corresponding to new data, and diamonds are from previously published data 20.
Figure 4.

Correlation of HIV-1 and HTLV-1 G2A-Gag-EYFP membrane-binding with cytoplasmic concentration. A. HIV-1 G2A-Gag-EYFP is a cytoplasmic protein. Graph of HIV-1 G2A-Gag-EYFP cytoplasmic concentration versus the presence of membrane-bound G2A-Gag is shown as well as a graph of HIV-1 G2A-Gag-EYFP cytoplasmic concentration versus Gag cytoplasmic stoichiometry, as measured by dcz-FFS. The dashed line indicates a monomeric protein. Asterisks correspond to new data; diamonds represent data from 20. The black line depicts the general data trend. Epifluorescence and TIRF images of representative cells expressing HIV-1 G2A-Gag-EYFP at varying cytoplasmic concentrations (c = 560 nM, c = 1900 nM) are membrane-negative as identified by dcz-FFS and by the TIRF ratio. B. HTLV-1 G2A-Gag-EYFP associates with the plasma membrane only at very high cytoplasmic concentrations. The top graph shows HTLV-1 G2A-Gag-EYFP cytoplasmic concentration plotted against membrane-associated G2A-Gag as measured by dcz-FFS. The lower graph shows HTLV-1 G2AGag-EYFP cytoplasmic concentration plotted against Gag cytoplasmic stoichiometry. The dashed line indicates monomeric protein. Asterisks correspond to new data; diamonds represent data from 20. The black line represents the data trend. Epifluorescence and TIRF images of representative cells expressing HTLV-1 G2A-Gag-EYFP at varying cytoplasmic concentrations (c = 650 nM, membrane negative; c = 1900 nM, membrane positive).
As can be observed, increases in the cytoplasmic concentration of the G2A mutant resulted in Gag-Gag interactions and thus higher measured average Gag stoichiometries (Figure 4A, middle panel). This result indicates that Gag-Gag interactions in the cytoplasm become apparent at ~500 nM, because the measured stoichiometry increases above the monomer level. This concentration corresponds with the cytoplasmic concentration at which full-length, wild-type HIV-1 Gag-EYFP was observed to be associated with the membrane (Figure 2A). Fluorescence images of a cell having a low (560 ± 20 nM, left) or a high (1900 ± 200 nM, right) cytoplasmic concentration of HIV-1 G2A-Gag-EYFP exhibit the features predicted for a cytoplasmic protein as discussed earlier. The TIRF ratio for both images is less than 2 (Supplemental Figure S6, panels J and K), which is consistent with the membrane-bound negative designations determined by dcz-FFS. These observations support the hypothesis that the HIV-1 G2A-Gag-EYFP mutant exists only in the cytoplasm and is not associated with the inner leaflet of the plasma membrane.
Dcz-FFS data of HTLV-1 G2A-Gag-EYFP (Figure 4B and Supplemental Figure S3, panels D–F) reveals that the G2A mutation did not eliminate membrane association of HTLV-1 Gag. dcz-FFS z-scans at concentrations over ~ 1 μM exhibited fluorescence intensity profiles consistent with HTLV-1 G2A-Gag-EYFP expression resulting in a membrane-positive phenotype. In addition, the measured HTLV-1 G2A-Gag-EYFP stoichiometry started to trend above the monomer level (Figure 4B, dashed line, middle panel) at ~ 1 μM, suggesting that the membrane-association phenotype transition may be related to cytoplasmic Gag-Gag interactions. In addition, epifluorescence- and TIRF imaging of a HeLa cell expressing HTLV-1 G2A-Gag-EYFP at a lower (650 ± 20 nM, left) or a higher (1880 ± 60 nM, right) concentration exhibit differences in the fluorescence phenotype. The cell expressing higher levels of HTLV-1 G2A-Gag-EYFP exhibits a punctate, membrane-positive fluorescence phenotype. In particular, both TIRF and dcz-FFS data confirm the presence of fluorescent puncta at the plasma membrane, while the fluorescence observed in the cell expressing lower levels of HTLV-1 G2A-Gag-EYFP is more consistent with a cytoplasmic protein distribution (Supplemental Figure S6L). These results suggest a model in which cytoplasmic HTLV-1 Gag-Gag interactions occur principally at higher protein expression levels, and therefore are not likely to play a significant role in the membrane association of HTLV-1 Gag observed at low protein expression levels.
Investigation of Gag oligomerization and Gag-membrane association in the context of unlabeled Gag
A key advantage of our studies is that they are conducted in living cells, which helps extend from studies done in vitro with liposomal membranes 6; 25; 26; 39. While the quantitative capabilities of dcz-FFS allow for the accurate determination of Gag cytoplasmic concentration and stoichiometry in living cells, a potential caveat is the heavy reliance on a fluorescently-labeled Gag protein. To help address this concern, we conducted experiments in which the fluorescently-labeled Gag protein of either HIV-1 (or HTLV-1) was co-transfected with an unlabeled HIV-1 (or HTLV-1) Gag protein. The reasoning behind this experimental strategy was that if Gag-Gag or Gag-membrane interactions were not occurring or were occurring in an unnatural manner, then the mixing of the unlabeled Gag with that of its fluorescently-labeled derivative should further test whether the fluorescence label has an influence on Gag-Gag interactions or Gag-membrane interactions. Such an experimental strategy has accurately mimicked the behavior of unlabeled proteins 30; 33; 46. While the concentration dependence of membrane targeting cannot be directly investigated, due to the presence of unlabeled protein, a qualitative investigation of membrane association can be analyzed. Our results were consistent with the previous, fully-labeled model systems in that HIV-1 Gag exhibited both membrane negative and membrane positive phenotypes, while HTLV-1 Gag was only found in the membrane positive phenotype (data not shown).
Previous studies have shown that myristoylated Gag can rescue unmyristoylated Gag, leading to their incorporation into either VLPs or authentic particles 47; 48; 49. We tested if the HTLV-1 G2A-Gag-EYFP could be restored to a wt phenotype by co-expression with an unlabeled wt HTLV Gag. The experiments were conducted using dcz-FFS, and revealed a consistent membrane positive phenotype. This demonstrated consistently that rescue of the G2A mutant had occurred by the unlabeled wt HTLV-1 Gag (Figure 5 and Supplemental Figure S4), and was independent of the concentration of HTLV-1 G2A-Gag-EYFP in the cytoplasm. It should be noted that the measured cytoplasmic concentrations do not reflect the total Gag concentration, as dcz-FFS is unable to detect Gag that does not have a fluorescence tag. However, the data, along with epi-illumination and TIRF imaging (not shown) demonstrates that all cells expressing both HTLV-1 G2A-Gag-EYFP and unlabeled HTLV-1 Gag are membrane positive. This result contrasts with the observed behavior of expressing HTLV-1 G2A-Gag-EYFP alone, as high concentrations are required in order to observe a membrane positive phenotype (Figure 4B). Taken together, this data is consistent with a model in which the fluorescently labeled HTLV-1 G2A-Gag-EYFP interacts with unlabeled Gag protein already associated with the plasma membrane to rescue wt behavior. Thus, we hypothesize that the association of unlabeled HTLV-1 Gag protein with the plasma membrane results in a conformational change that allows for Gag-Gag interactions to occur in an efficient manner – and therefore the rescue of the HTLV-1 Gag G2A mutant, whereas cytoplasmic Gag-Gag interactions seem not to play a role in the rescue as cytoplasmic interactions only occur at high expression levels.
Figure 5.
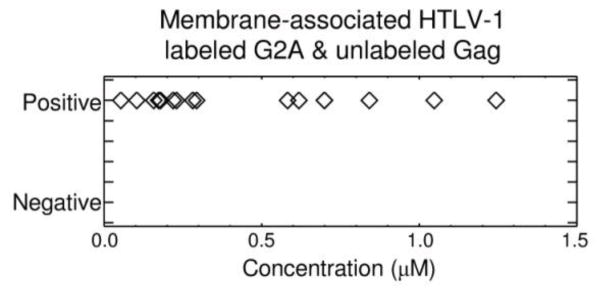
Complementation and rescue of HTLV-1 G2A-Gag-EYFP membrane association by wt Gag. The G2A-Gag-EYFP and unlabeled wt Gag expression constructs were cotransfected together into cells and subsequently analyzed by dcz-FFS. The cytoplasmic concentration of G2A-Gag-EYFP was plotted against membrane-associated G2A-Gag-EYFP.
Discussion
The goal of this study was to gain greater insight into the fundamental nature of how the concentration of Gag in the cytosol can influence Gag-Gag interactions as well as Gag-membrane interactions. In the cytosol, HIV-1 Gag-Gag interactions contribute to myristoyl exposure and membrane targeting 17; 18; 19. Previous studies by our group 20 and others 21 observed a concentration dependent HIV-1 Gag-Gag equilibrium in living cells, which was interpreted as stable Gag complex formation occurring at ~500 nM. This data provides evidence that cytoplasmic, concentration-dependent Gag-Gag equilibrium favors the formation of stable Gag homo-complexes required for membrane association. In contrast, work performed on HTLV-1 Gag assembly found low or no cytoplasmic Gag-Gag interactions 20; 23; 24. Therefore, HTLV-1 Gag translocates to the plasma membrane as a monomer in the absence of cytoplasmic Gag concentration dependence for membrane association.
To further investigate the relationship of cytoplasmic Gag concentration and Gag-membrane association, we used a combination of epi-illumination imaging, TIRF imaging and dcz-FFS. We found that HIV-1 Gag-EYFP membrane targeting required a concentration threshold of ~500 nM, which is also the concentration at which stable cytoplasmic Gag homo-complexes form (Figure 2A). HIV-1 Gag at cytoplasmic concentrations of ~500 nM or lower exhibited a membrane negative phenotype (i.e., Gag detectable only in cytoplasm). Above a concentration of ~500 nM, puncta become readily apparent, with TIRF and dcz-FFS confirming that the fluorescent puncta are associated with the plasma membrane. Therefore, above ~500 nM, HIV-1 Gag is associated with the plasma membrane and fluorescent puncta readily observed. For HTLV-1 Gag, membrane positive fluorescence with puncta is observed at the plasma membrane regardless of cytoplasmic Gag concentration (Figure 2B). These observations, coupled with previous observations that HTLV-1 Gag is primarily monomeric in the cytoplasm 20; 23; 24, supports the conclusion that HTLV-1 associates with the plasma membrane as a monomer.
Retroviral membrane targeting is thought to be associated with basic amino acids at the MA-membrane interface, and a post-translational myristoyl moiety modification at the N-terminus of the MA domain 7; 15; 16; 39; 40; 50. The myristoyl moiety of HIV-1 Gag is sequestered and requires both Gag-Gag interactions and specific interaction with P(4,5)IP2 to cause myristate exposure and subsequent membrane binding 6; 18; 19; 43. Previous studies have shown in vitro that HIV-1 MA does not associate with membrane unless multimers are formed by increasing MA concentration (> 1mM, 12) or by linking MA together 39. Our data independently confirms these observations, as HIV-1 MA was observed as a cytoplasmic monomer at all concentrations measured (Figure 3).
In contrast, HTLV-1 MA interacted as a monomer with the plasma membrane at all concentrations measured (Figure 3). This is consistent with a previous observation 41, and likely represents the behavior of full-length HTLV-1 Gag. There are several factors which could potentially contribute to the disparity between HIV-1 MA and HTLV-1 MA membrane association. The basic patch of amino acids in HIV-1 MA would be predicted to interact with membrane with greater affinity than the basic amino acid residues scattered throughout HTLV-1 MA 16, which would suggest behavior not consistent with our observations. The different behavior observed in our study of HTLV-1 MA-EYFP and HIV-1 MA-EYFP may be due in part to HIV-1 MA-RNA interactions, which has been implicated to interfere with membrane interactions 26; 27; 28, while such interference with HTLV-1 Gag-membrane interactions have not been observed 25. In addition, differential mechanisms for myristoyl-mediated interaction with the plasma membrane between HIV-1 and HTLV-1 Gag could help explain differences in their interaction with the plasma membrane 4; 45.
HIV-1 Gag with the G2A mutation did not interact with the plasma membrane (Figure 4A) 44. In contrast, HTLV-1 G2A-Gag was observed to associate with the plasma membrane at concentrations greater than 1 μM, coinciding with the concentration at which Gag homo-interactions is first observed in the cytoplasm (Figure 4B). These observed differences between the G2A mutants are likely due to differences in the properties of the two retroviral MA domains (e.g., MA-RNA interactions).
Gag forms high-order oligomers and an immature lattice at the inner leaflet of the plasma membrane 11; 30; 33; 51; 52; 53. While we have observed differences between HIV-1 and HTLV-1 Gag in regards to concentration dependence in membrane association, the locations along the plasma membrane where Gag targets (i.e., membrane microdomains) are conducive to virus particle formation 17; 41; 54; 55; 56. Specific interaction between HIV-1 Gag and P(4,5)IP2 promotes targeting of Gag to the plasma membrane 6; 43. For HTLV-1 Gag, P(4,5)IP2 has been excluded as playing a role in specific membrane binding 25. Unlike HIV-1 and bovine leukemia virus Gag, HTLV-1 Gag does not assemble into and bud VLPs from insect cells 57, implying that a host factor required for HTLV-1 particle assembly and release is absent in these cells.
Figure 6 summarizes the main observations of this study. In general, the data with HIV-1, as summarized in Figure 6A and 6B, is consistent with the literature (reviewed in4. For HTLV-1, Gag targets to the membrane as a monomer, arguably to membrane microdomains 41; 42, where oligomerization occurs (Figure 6C). The myristoyl moiety is a nonspecific membrane targeting motif, and exposure of this moiety would enhance Gag interactions with all membranes, which is inconsistent with the previously observed behavior of HTLV-1 Gag 45. While the HIV-1 Gag myristoyl moiety has both a sequestered and exposed state, our data would suggest that exposure of the HTLV-1 Gag myristoyl moiety proceeds by a different mechanism. In particular, a conformational change of HTLV-1 Gag may not be required for Gag-membrane association, but rather a conformational change occurs when HTLV-1 Gag is associated with the membrane to allow for efficient Gag-Gag interactions to occur.
Figure 6.

Models of HIV-1 and HTLV-1 Gag-membrane association. A. Dependence of HIV-1 Gag-membrane association on Gag cytoplasmic concentration. A critical threshold of HIV-1 Gag in the cytoplasm (~ 0.5 μM) must be reached prior to Gag-Gag dimer formation and subsequent Gag-membrane interactions. B. Complementation and rescue of HIV-1 G2A-Gag-EYFP by wt Gag. When a critical concentration of wt Gag is reached, interactions between G2A-Gag-EYFP and wt Gag occur and result in membrane association. C. Membrane association of monomeric HTLV-1 Gag-EYFP. HTLV-1 Gag-EYFP exists as a monomer in the cytoplasm, and exhibits membrane association at all timepoints observed. D. Complementation and rescue of HTLV-1 G2A-Gag-EYFP by wt Gag. Interaction between G2A-Gag-EYFP and wt Gag occurs at or near sites of Gag membrane association. Rescue of G2A-Gag-EYFP into membrane associated Gag complexes occurs over all concentrations and time points observed.
The rescue studies involving the two G2A mutants further demonstrate the different membrane-association pathways of the two viruses. HIV-1 G2A rescue by wild-type Gag (data not shown and Figure 6B) was consistent with the concentration threshold discussed previously. Conversely, HTLV-1 G2A mutants likely interact with wild-type Gag already associated with the plasma membrane (Figure 6D). Rescue of HTLV-1 G2A Gag mutant by wt HTLV-1 Gag was observed at all expression levels. This suggests a mechanism for membrane association that does not require initiation by cytoplasmic interaction, due to the relatively low affinity (~1μM) of HTLV-1 cytoplasmic Gag-Gag interactions. In particular, this suggests that the HTLV-1 G2A Gag mutant and wt HTLV-1 Gag target to proximal regions of the plasma membrane, and rescue occurs at sites of wt membrane association.
An important aspect in the early events in retroviral assembly is the interaction of the Gag protein with the genome-length viral RNA (i.e., genome recognition event); this is a crucial step to help ensure the selective packaging of two copies of the viral RNA into virus particles. Intriguingly, HTLV-1 Gag-membrane association has been shown to be independent of RNA inhibition 25, and HTLV-1 NC has been shown to be a poor nucleic acid chaperone, due to its unique C-terminal, acidic domain 58. The data presented here potentially impacts models of Gag-RNA interactions and their influence on early-stage virus assembly. HIV-1 Gag-RNA interactions initiate in the cytoplasm, and impact Gag self-association 14 and membrane association 26; 27; 28. The contrasting behavior of the cytoplasmic homo-interactions and membrane association of HTLV-1 Gag suggests a model in which the Gag-genome interaction may occur once Gag is already associated with the membrane.
The differing mechanisms of early assembly for the two retroviruses presented here may inform our understanding of virus pathology. Retroviruses can spread via cell-to-cell contacts 59; 60; 61; 62, and HTLV-1 spreads almost exclusively through this route 62 through Tax-mediated cell polarization 63, which likely aids in immune evasion 64 via high mutagenesis of the virus 65; 66. The unique capacity of HTLV-1 particle production at low Gag expression levels may also aid in immune evasion. In contrast, HIV-1 particle production requires approximately μM HIV-1 Gag protein expression levels, which may be important for ensuring efficient virus release and spread prior to virus-mediated cell death. In summary, our integrated approach of biophysical fluorescence techniques has provided important new insights into the interrelationship between cytoplasmic Gag concentration and Gag-membrane association 67, and significantly extends previous studies 21; 23; 24; 25; 41; 68.
Materials and Methods
Cells, HTLV-1 and HIV-1 vectors, and mutant derivative construction
The construction and validation of a HTLV-1-like particle production model system has been previously described 51. Briefly, this model system utilizes a genetically-engineered expression construct, pHTLV-1 Gag-EYFP, with the CMV promoter driving expression of a human codon-optimized HTLV-1 gag gene – designed using the UpGene program 69 and synthesized by GenScript Co. (Piscataway, NJ) – containing an optimal Kozak consensus sequence 70; 71 that was derived from the vector, pEYFP-N3 72. Site-directed mutant derivatives of HIV-1 Gag-EYFP 72 and HTLV-1 Gag-EYFP, i.e., G2A Gag-EYFP and MA-EYFP derivatives, were made using the QuikChange XL Site-Directed Mutagenesis Kit (Stratagene, La Jolla CA) per manufacturer’s instructions.
HeLa cells were obtained from American Type Culture Collection (ATCC) and maintained in DMEM media (Invitrogen Corporation, Carlsbad CA) with 10% fetal bovine serum (Hyclone Laboratories, Logan, UT). Transfections were done using the GenJet™ in vitro transfection reagent (SignaGen Laboratories, Gaithersburg, MD) according to the manufacturer’s instructions. FFS measurements were conducted 4–6 h after plasmid transfection of cells. Cells were subcultured into eight-well coverglass chamber slides (Nagle Nunc International, Rochester, NY). Approximately 1 hour prior to measurement, cells were transferred into Liebowitz’s L15 medium with 10% fetal bovine serum to allow for incubation in an open-air environment, and incubated at 37°C on-microscope. The incubation temperature control was achieved using an air stream incubator (Nevtek, Williamsville, VA).
FFS Instrumentation and Experimental Protocol
A mode-locked Ti:sapphire laser (Mai Tai, Spectra-Physics, Mountain View, CA) serves as a source for two-photon excitation of a modified Zeiss Axiovert 200 microscope (Thornwood, NY) as previously described 37. Cells reside in a chamber slide mounted on a motorized stage (PZ2000 piezo stage, ASI, Eugene, OR). Cells expressing both the Gag-EYFP construct and mCherry were identified and positioned using fluorescence epi-illumination. The microscope was subsequently switched to bright-field illumination to verify cell-health as well as to locate a measurement position which appeared free from organelles. Finally, fluorescence epi-illumination was used to ensure the absence of puncta at the chosen measurement location. Once a cell was selected, the excitation source was switched to the Ti:sapphire laser for FFS experiments. Excitation light is focused through a Zeiss 63× Plan Apochromat oil immersion objective (N.A. = 1.4). An excitation power of 0.3 mW or less was chosen to avoid saturation and photobleaching effects. Each FFS measurement lasts 82 s and uses two-photon excitation of the sample at 1000 nm. Intensity z-scans were obtained using the piezo stage to move the sample in the axial direction. Scan voltages were controlled by an Agilent 33250A arbitrary waveform generator (Agilent Technologies, Santa Clara, CA) running a linear ramp signal with a frequency of 30.5 mHz and a peak-to-peak amplitude of 1.4 V. This voltage corresponds to an axial travel of 14.2 μm. The fluorescence emission of the FFS and z-scan measurements was separated into two different detection channels with a 580 nm dichroic mirror (585DCXR, Chroma Technology). Photon counts were detected with avalanche photodiodes (APD) (Perkin-Elmer, SPCM-AQ-14) and recorded by a data acquisition card (ISS, Champaign, IL), which stores the complete sequence of photon counts using sampling frequencies ranging from 20 to 200 kHz. The photon counts were analyzed with programs written in IDL 6.0 (Research Systems, Boulder, CO). The determination of protein concentrations and brightness values from FFS experiments has been described previously 36; 37; 73. The analysis of z-scan intensity traces has been discussed in the literature20; 74. Although visual inspection of intensity traces is usually sufficient to identify a membrane-positive phenotype (Figure 1), we describe in Supplemental Section 1 a quantitative method to distinguish membrane-positive and membrane-negative z-scan traces along with representative z-scan profiles of all Gag proteins studied (Supplemental Figures S1–S4).
Epi-Illumination Imaging
Excitation light from a cold white, collimated LED (Model MCWHL2, Thorlabs, Newton, NJ) is focused through a Zeiss 100× α-Plan FLUAR oil immersion objective (N.A. = 1.45) onto the sample with an intensity of 200 μW. Either a GFP dichroic mirror set, with excitation centered at 470 nm and emission centered at 525 nm (41017 Endow GFP/EGFP, Chroma Technology) or a Texas Red filter set, with excitation centered at 560 nm and emission centered at 645 nm (41004 HQ: TXRD, Chroma Technology) was used for epifluorescence measurements of EYFP constructs or mCherry, respectively. Fluorescence of the sample was imaged onto an EMCCD (Ixon DV887, Andor Technology, South Windsor, CT). Exposure times were chosen to match cellular expression levels and typically were close to 1s. A dark frame was taken with the EMCCD shutter closed and subtracted from the measured intensity frame to correct for background. The corrected intensity frames were rescaled to correspond to an exposure time of 1 s.
TIRF Imaging
A 488 nm, 10 mW cyan laser (Model PC14135, Spectra-Physics) was coupled into a fiber-coupled Zeiss TIRF slider via a kineMATIX fiber coupler (Qioptiq, Rochester, NY). The TIRF excitation is guided towards the sample by the same 470 nm dichroic mirror used in epi-illumination and adjusted to minimize the depth of the evanescent field, which is ~100 nm in a typical TIRF experiment 75. TIRF laser power measured after the objective was found to be ~200 μW. Fluorescence from TIRF excitation was collected by the objective and imaged by the EMCCD using the same settings as for epi-illumination. Once again, images were normalized to correspond to an exposure time of 1s after dark-frame subtraction.
Two criteria were used to identify a membrane-positive phenotype from images. First, images that displayed puncta in the TIRF field were ruled as membrane-positive. If puncta were absent, we had to consider two additional contributions to the fluorescence signal. The TIRF field excites non-punctate fluorescently labeled proteins at the membrane as well as cytoplasmic proteins in the vicinity of the coverslip/sample interface. Thus, the presence of membrane-associated Gag is also revealed by a TIRF intensity that exceeds the signal expected for a purely cytoplasmic protein distribution. This served as our second criterion to identify a membrane-positive phenotype. The intensity from the cytoplasmic protein scales with its concentration c, FcytoTIRF = c·s, where s is the scaling factor. The scaling factor was determined by a calibration experiment (see Supplemental Section 2 and Supplemental Figure S5 for details), while the concentration c was measured for each cell by an independent FFS experiment.
Experimental TIRF images of a purely cytoplasmic protein show variations in the fluorescence intensity, which is mainly due to the fact that the plasma membrane of cells is not uniformly attached to the glass coverslip. Because cell regions in direct contact with the coverslip have the highest overlap with the excitation field and therefore the highest signal, we used the maximum fluorescence intensity FmaxTIRF of the image and compared it to the expected intensity FcytoTIRF from a purely cytoplasmic protein by introducing the TIRF ratio rTIRF = FmaxTIRF /FcytoTIRF. A TIRF ratio of ~1 indicates a purely cytoplasmic protein, while values that significantly exceed 1 reveal the presence of membrane-associated protein. Statistical analysis (Supplemental Section 2) showed that a TIRF ratio in excess of 2 identifies a membrane-positive phenotype, while values smaller than 2 are consistent with a purely cytoplasmic protein. Supplemental Figure S6 displays the TIRF fluorescence intensity, the expected cytoplasmic intensity FcytoTIRF, and the ratio rTIRF for each TIRF image in this study.
Supplementary Material
Highlights.
HTLV-1 Gag membrane association is independent of cytoplasmic concentration levels
A critical threshold (~ μM) exists prior to HIV-1 Gag-membrane association
Fundamental differences exist between HIV-1 and HTLV-1 Gag early assembly
Acknowledgments
This research was supported by NIH grants R01 GM098550 and R01GM064589 and the National Science Foundation (PHY-0346782). K.H.F. was supported from an American Cancer Society Postdoctoral Fellowship.
Footnotes
Publisher's Disclaimer: This is a PDF file of an unedited manuscript that has been accepted for publication. As a service to our customers we are providing this early version of the manuscript. The manuscript will undergo copyediting, typesetting, and review of the resulting proof before it is published in its final citable form. Please note that during the production process errorsmaybe discovered which could affect the content, and all legal disclaimers that apply to the journal pertain.
References
- 1.Swanstrom R, Wills JW. Synthesis, assembly, and processing of viral proteins. In: Coffin JM, Hughes SH, Varmus HE, editors. Retroviruses. Cold Spring Harbor Laboratory Press; Cold Spring Harbor (NY): 1997. pp. 263–334. [PubMed] [Google Scholar]
- 2.Wills JW, Craven RC. Form, Function, and Use of Retroviral Gag Proteins. Aids. 1991;5:639–654. doi: 10.1097/00002030-199106000-00002. [DOI] [PubMed] [Google Scholar]
- 3.Gheysen D, Jacobs E, Deforesta F, Thiriart C, Francotte M, Thines D, Dewilde M. Assembly and Release of Hiv-1 Precursor Pr55gag Virus-Like Particles from Recombinant Baculovirus Infected Insect Cells. Cell. 1989;59:103–112. doi: 10.1016/0092-8674(89)90873-8. [DOI] [PubMed] [Google Scholar]
- 4.Hamard-Peron E, Muriaux D. Retroviral matrix and lipids, the intimate interaction. Retrovirology. 2011;8 doi: 10.1186/1742-4690-8-15. [DOI] [PMC free article] [PubMed] [Google Scholar]
- 5.Ono A, Demirov D, Freed EO. Relationship between human immunodeficiency virus type 1 Gag multimerization and membrane binding. J Virol. 2000;74:5142–5150. doi: 10.1128/jvi.74.11.5142-5150.2000. [DOI] [PMC free article] [PubMed] [Google Scholar]
- 6.Ono A, Ablan SD, Lockett SJ, Nagashima K, Freed EO. Phosphatidylinositol (4,5) bisphosphate regulates HIV-1 gag targeting to the plasma membrane. Proc Natl Acad Sci U S A. 2004;101:14889–14894. doi: 10.1073/pnas.0405596101. [DOI] [PMC free article] [PubMed] [Google Scholar]
- 7.Saad JS, Miller J, Tai J, Kim A, Ghanam RH, Summers MF. Structural basis for targeting HIV-1 Gag proteins to the plasma membrane for virus assembly. Proc Natl Acad Sci U S A. 2006;103:11364–11369. doi: 10.1073/pnas.0602818103. [DOI] [PMC free article] [PubMed] [Google Scholar]
- 8.Bryant M, Ratner L. Myristoylation-dependent replication and assembly of human immunodeficiency virus 1. Proc Natl Acad Sci U S A. 1990;87:523–7. doi: 10.1073/pnas.87.2.523. [DOI] [PMC free article] [PubMed] [Google Scholar]
- 9.Ako-Adjei D, Johnson MC, Vogt VM. The retroviral capsid domain dictates virion size, morphology, and coassembly of Gag into virus-like particles. 2005;79:13463–13472. doi: 10.1128/JVI.79.21.13463-13472.2005. [DOI] [PMC free article] [PubMed] [Google Scholar]
- 10.Ganser-Pornillos BK, Yeager M, Sundquist WI. The structural biology of HIV assembly. Curr Opin Struct Biol. 2008;18:203–17. doi: 10.1016/j.sbi.2008.02.001. [DOI] [PMC free article] [PubMed] [Google Scholar]
- 11.Briggs JAG, Riches JD, Glass B, Bartonova V, Zanetti G, Krausslich HG. Structure and assembly of immature HIV. Proc Natl Acad Sci U S A. 2009;106:11090–11095. doi: 10.1073/pnas.0903535106. [DOI] [PMC free article] [PubMed] [Google Scholar]
- 12.Burniston MT, Cimarelli A, Colgan J, Curtis SP, Luban J. Human immunodeficiency virus type 1 Gag polyprotein multimerization requires the nucleocapsid domain and RNA and is promoted by the capsid-dimer interface and the basic region of matrix protein. J Virol. 1999;73:8527–8540. doi: 10.1128/jvi.73.10.8527-8540.1999. [DOI] [PMC free article] [PubMed] [Google Scholar]
- 13.Cimarelli A, Sandin S, Hoglund S, Luban J. Basic residues in human immunodeficiency virus type 1 nucleocapsid promote virion assembly via interaction with RNA. J Virol. 2000;74:3046–3057. doi: 10.1128/jvi.74.7.3046-3057.2000. [DOI] [PMC free article] [PubMed] [Google Scholar]
- 14.Muriaux D, Mirro J, Harvin D, Rein A. RNA is a structural element in retrovirus particles. Proc Natl Acad Sci U S A. 2001;98:5246–5251. doi: 10.1073/pnas.091000398. [DOI] [PMC free article] [PubMed] [Google Scholar]
- 15.Christensen AM, Massiah MA, Turner BG, Sundquist WI, Summers MF. Three-dimensional structure of the HTLV-II matrix protein and comparative analysis of matrix proteins from the different classes of pathogenic human retroviruses. J Mol Biol. 1996;264:1117–1131. doi: 10.1006/jmbi.1996.0700. [DOI] [PubMed] [Google Scholar]
- 16.Murray PS, Li ZH, Wang JY, Tang CL, Honig B, Murray D. Retroviral matrix domains share electrostatic homology: Models for membrane binding function throughout the viral life cycle. Structure. 2005;13:1521–1531. doi: 10.1016/j.str.2005.07.010. [DOI] [PubMed] [Google Scholar]
- 17.Lindwasser OW, Resh MD. Multimerization of human immunodeficiency virus type 1 gag promotes its localization to barges, raft-like membrane microdomains. Journal of Virology. 2001;75:7913–7924. doi: 10.1128/JVI.75.17.7913-7924.2001. [DOI] [PMC free article] [PubMed] [Google Scholar]
- 18.Sandefur S, Varthakavi V, Spearman P. The I domain is required for efficient plasma membrane binding of human immunodeficiency virus type 1 Pr55(Gag) Journal of Virology. 1998;72:2723–2732. doi: 10.1128/jvi.72.4.2723-2732.1998. [DOI] [PMC free article] [PubMed] [Google Scholar]
- 19.Perez-Caballero D, Hatziioannou T, Martin-Serrano J, Bieniasz PD. Human immunodeficiency virus type 1 matrix inhibits and confers cooperativity on Gag precursor-membrane interactions. Journal of Virology. 2004;78:9560–9563. doi: 10.1128/JVI.78.17.9560-9563.2004. [DOI] [PMC free article] [PubMed] [Google Scholar]
- 20.Fogarty Keir H, Chen Y, Grigsby Iwen F, Macdonald Patrick J, Smith Elizabeth M, Johnson Jolene L, Rawson Jonathan M, Mansky Louis M, Mueller Joachim D. Characterization of Cytoplasmic Gag-Gag Interactions by Dual-Color Z-Scan Fluorescence Fluctuation Spectroscopy. Biophys J. 2011;100:1587–1595. doi: 10.1016/j.bpj.2011.02.008. [DOI] [PMC free article] [PubMed] [Google Scholar]
- 21.Kutluay SB, Bieniasz PD. Analysis of the Initiating Events in HIV-1 Particle Assembly and Genome Packaging. PLoS Pathog. 2010;6:e1001200. doi: 10.1371/journal.ppat.1001200. [DOI] [PMC free article] [PubMed] [Google Scholar]
- 22.Hubner W, Chen P, Del Portillo A, Liu Y, Gordon RE, Chen BK. Sequence of human immunodeficiency virus type 1 (HIV-1) gag localization and oligomerization monitored with live Confocal Imaging of a replication-competent, fluorescently tagged EIV-1. J Virol. 2007;81:12596–12607. doi: 10.1128/JVI.01088-07. [DOI] [PMC free article] [PubMed] [Google Scholar]
- 23.Rayne F, Bouamr F, Lalanne J, Mamoun RZ. The NH2-terminal domain of the human T-cell leukemia virus type 1 capsid protein is involved in particle formation. J Virol. 2001;75:5277–5287. doi: 10.1128/JVI.75.11.5277-5287.2001. [DOI] [PMC free article] [PubMed] [Google Scholar]
- 24.Rayne F, Kajava AV, Lalanne J, Mamoun RZ. In vivo homodimerisation of HTLV-1 Gag and MA gives clues to the retroviral capsid and TM envelope protein arrangement. J Mol Biol. 2004;343:903–916. doi: 10.1016/j.jmb.2004.09.013. [DOI] [PubMed] [Google Scholar]
- 25.Inlora J, Chukkapalli V, Derse D, Ono A. Gag Localization and Virus-Like Particle Release Mediated by the Matrix Domain of Human T-Lymphotropic Virus Type 1 Gag Are Less Dependent on Phosphatidylinositol-(4,5)-Bisphosphate than Those Mediated by the Matrix Domain of HIV-1 Gag. Journal of Virology. 2011;85:3802–3810. doi: 10.1128/JVI.02383-10. [DOI] [PMC free article] [PubMed] [Google Scholar]
- 26.Chukkapalli V, Oh SJ, Ono A. Opposing mechanisms involving RNA and lipids regulate HIV-1 Gag membrane binding through the highly basic region of the matrix domain. Proceedings of the National Academy of Sciences of the United States of America. 2010;107:1600–1605. doi: 10.1073/pnas.0908661107. [DOI] [PMC free article] [PubMed] [Google Scholar]
- 27.Alfadhli A, Still A, Barklis E. Analysis of Human Immunodeficiency Virus Type 1 Matrix Binding to Membranes and Nucleic Acids. Journal of Virology. 2009;83:12196–12203. doi: 10.1128/JVI.01197-09. [DOI] [PMC free article] [PubMed] [Google Scholar]
- 28.Alfadhli A, McNett H, Tsagli S, Bachinger HP, Peyton DH, Barklis E. HIV-1 Matrix Protein Binding to RNA. J Mol Biol. 2011;410:653–666. doi: 10.1016/j.jmb.2011.04.063. [DOI] [PMC free article] [PubMed] [Google Scholar]
- 29.Jouvenet N, Neil SJD, Bess C, Johnson MC, Virgen CA, Simon SM, Bieniasz PD. Plasma membrane is the site of productive HIV-1 particle assembly. Plos Biology. 2006;4:2296–2310. doi: 10.1371/journal.pbio.0040435. [DOI] [PMC free article] [PubMed] [Google Scholar]
- 30.Jouvenet N, Bieniasz PD, Simon SM. Imaging the biogenesis of individual HIV-1 virions in live cells. Nature. 2008;454:236–240. doi: 10.1038/nature06998. [DOI] [PMC free article] [PubMed] [Google Scholar]
- 31.Jouvenet N, Simon SM, Bieniasz PD. Imaging the interaction of HIV-1 genomes and Gag during assembly of individual viral particles. Proc Natl Acad Sci U S A. 2009;106:19114–19119. doi: 10.1073/pnas.0907364106. [DOI] [PMC free article] [PubMed] [Google Scholar]
- 32.Jouvenet N, Zhadina M, Bieniasz PD, Simon SM. Dynamics of ESCRT protein recruitment during retroviral assembly. Nature Cell Biology. 2011;13:394–401. doi: 10.1038/ncb2207. [DOI] [PMC free article] [PubMed] [Google Scholar]
- 33.Ivanchenko S, Godinez WJ, Lampe M, Krausslich HG, Eils R, Rohr K, Brauchle C, Muller B, Lamb DC. Dynamics of HIV-1 Assembly and Release. PLoS Pathog. 2009;5 doi: 10.1371/journal.ppat.1000652. [DOI] [PMC free article] [PubMed] [Google Scholar]
- 34.Baumgartel V, Ivanchenko S, Dupont A, Sergeev M, Wiseman PW, Krausslich H-G, Brauchle C, Muller B, Lamb DC. Live-cell visualization of dynamics of HIV budding site interactions with an ESCRT component. Nat Cell Biol. 2011;13:469–474. doi: 10.1038/ncb2215. [DOI] [PubMed] [Google Scholar]
- 35.Resh MD. Intracellular trafficking of HIV-1 Gag: How Gag interacts with cell membranes and makes viral particles. Aids Rev. 2005;7:84–91. [PubMed] [Google Scholar]
- 36.Chen Y, Muller JD, Ruan QQ, Gratton E. Molecular brightness characterization of EGFP in vivo by fluorescence fluctuation spectroscopy. Biophys J. 2002;82:133–144. doi: 10.1016/S0006-3495(02)75380-0. [DOI] [PMC free article] [PubMed] [Google Scholar]
- 37.Chen Y, Wei LN, Muller JD. Probing protein oligomerization in living cells with fluorescence fluctuation spectroscopy. Proc Natl Acad Sci U S A. 2003;100:15492–15497. doi: 10.1073/pnas.2533045100. [DOI] [PMC free article] [PubMed] [Google Scholar]
- 38.Berland KM, So PTC, Gratton E. 2-Photon Fluorescence Correlation Spectroscopy - Method and Application to the Intracellular Environment. Biophys J. 1995;68:694–701. doi: 10.1016/S0006-3495(95)80230-4. [DOI] [PMC free article] [PubMed] [Google Scholar]
- 39.Dalton AK, Ako-Adjei D, Murray PS, Murray D, Vogt VM. Electrostatic interactions drive membrane association of the human immunodeficiency virus type 1 Gag MA domain. J Virol. 2007;81:6434–6445. doi: 10.1128/JVI.02757-06. [DOI] [PMC free article] [PubMed] [Google Scholar]
- 40.Massiah MA, Starich MR, Paschall C, Summers MF, Christensen AM, Sundquist WI. 3-Dimensional Structure of the Human-Immunodeficiency-Virus Type-1 Matrix Protein. J Mol Biol. 1994;244:198–223. doi: 10.1006/jmbi.1994.1719. [DOI] [PubMed] [Google Scholar]
- 41.Mazurov D, Heidecker G, Derse D. HTLV-1 Gag protein associates with CD82 tetraspanin microdomains at the plasma membrane. Virology. 2006;346:194–204. doi: 10.1016/j.virol.2005.10.033. [DOI] [PubMed] [Google Scholar]
- 42.Mazurov D, Heidecker G, Derse D. The inner loop of tetraspanins CD82 and CD81 mediates interactions with human T cell lymphotrophic virus type 1 Gag protein. J Biol Chem. 2007;282:3896–3903. doi: 10.1074/jbc.M607322200. [DOI] [PubMed] [Google Scholar]
- 43.Datta SAK, Zhao Z, Clark PK, Tarasov S, Alexandratos JN, Campbell SJ, Kvaratskhelia M, Lebowitz J, Rein A. Interactions between HIV-1 Gag molecules in solution: An inositol phosphate-mediated switch. J Mol Biol. 2007;365:799–811. doi: 10.1016/j.jmb.2006.10.072. [DOI] [PMC free article] [PubMed] [Google Scholar]
- 44.Gottlinger HG, Sodroski JG, Haseltine WA. Role of Capsid Precursor Processing and Myristoylation in Morphogenesis and Infectivity of Human Immunodeficiency Virus Type-1. Proc Natl Acad Sci U S A. 1989;86:5781–5785. doi: 10.1073/pnas.86.15.5781. [DOI] [PMC free article] [PubMed] [Google Scholar]
- 45.Le Blanc I, Blot V, Bouchaert I, Salamero J, Goud B, Rosenberg AR, Dokhelar MC. Intracellular distribution of human T-cell leukemia virus type 1 Gag proteins is independent of interaction with intracellular membranes. J Virol. 2002;76:905–911. doi: 10.1128/JVI.76.2.905-911.2002. [DOI] [PMC free article] [PubMed] [Google Scholar]
- 46.Larson DR, Johnson MC, Webb WW, Vogt VM. Visualization of retrovirus budding with correlated light and electron microscopy. Proceedings of the National Academy of Sciences of the United States of America. 2005;102:15453–15458. doi: 10.1073/pnas.0504812102. [DOI] [PMC free article] [PubMed] [Google Scholar]
- 47.Lindwasser OW, Resh MD. Human immunodeficiency virus type 1 Gag contains a dileucine-like motif that regulates association with multivesicular bodies. J Virol. 2004;78:6013–6023. doi: 10.1128/JVI.78.11.6013-6023.2004. [DOI] [PMC free article] [PubMed] [Google Scholar]
- 48.Morikawa Y, Hinata S, Tomoda H, Goto T, Nakai M, Aizawa C, Tanaka H, Omura S. Complete inhibition of human immunodeficiency virus gag myristoylation is necessary for inhibition of particle budding. Journal of Biological Chemistry. 1996;271:2868–2873. doi: 10.1074/jbc.271.5.2868. [DOI] [PubMed] [Google Scholar]
- 49.Park J, Morrow CD. The Nonmyristylated Pr160gag-Pol Polyprotein of Human-Immunodeficiency-Virus Type-1 Interacts with Pr55gag and Is Incorporated into Virus-Like Particles. Journal of Virology. 1992;66:6304–6313. doi: 10.1128/jvi.66.11.6304-6313.1992. [DOI] [PMC free article] [PubMed] [Google Scholar]
- 50.Tang C, Loeliger E, Luncsford P, Kinde I, Beckett D, Summers MF. Entropic switch regulates myristate exposure in the HIV-1 matrix protein. Proc Natl Acad Sci U S A. 2004;101:517–22. doi: 10.1073/pnas.0305665101. [DOI] [PMC free article] [PubMed] [Google Scholar]
- 51.Grigsby IF, Zhang W, Johnson JL, Fogarty KH, Chen Y, Rawson JM, Crosby AJ, Mueller JD, Mansky LM. Biophysical analysis of HTLV-1 particles reveals novel insights into particle morphology and Gag stochiometry. Retrovirology. 2010;7:75. doi: 10.1186/1742-4690-7-75. [DOI] [PMC free article] [PubMed] [Google Scholar]
- 52.Carlson LA, Briggs JAG, Glass B, Riches JD, Simon MN, Johnson MC, Muller B, Grunewald K, Krausslich HG. Three-Dimensional Analysis of Budding Sites and Released Virus Suggests a Revised Model for HIV-1 Morphogenesis. Cell Host Microbe. 2008;4:592–599. doi: 10.1016/j.chom.2008.10.013. [DOI] [PMC free article] [PubMed] [Google Scholar]
- 53.Carlson LA, de Marco A, Oberwinkler H, Habermann A, Briggs JA, Krausslich HG, Grunewald K. Cryo electron tomography of native HIV-1 budding sites. PLoS Pathog. 2010;6:e1001173. doi: 10.1371/journal.ppat.1001173. [DOI] [PMC free article] [PubMed] [Google Scholar]
- 54.Ono A, Freed EO. Plasma membrane rafts play a critical role in HIV-1 assembly and release. 2001;98:13925–13930. doi: 10.1073/pnas.241320298. [DOI] [PMC free article] [PubMed] [Google Scholar]
- 55.Ono A, Freed EO. Virus Structure and Assembly. Vol. 64. Elsevier Academic Press Inc; San Diego: 2005. Role of lipid rafts in virus replication; pp. 311–358. [DOI] [PubMed] [Google Scholar]
- 56.Waheed AA, Freed EO. Lipids and membrane microdomains in HIV-1 replication. Virus Res. 2009;143:162–176. doi: 10.1016/j.virusres.2009.04.007. [DOI] [PMC free article] [PubMed] [Google Scholar]
- 57.Bouamr F, Garnier L, Rayne F, Verna A, Rebeyrotte N, Cerutti M, Mamoun RZ. Differential budding efficiencies of human T-cell leukemia virus type I (HTLV-I) Gag and Gag-Pro polyproteins from insect and mammalian cells. Virology. 2000;278:597–609. doi: 10.1006/viro.2000.0663. [DOI] [PubMed] [Google Scholar]
- 58.Qualley DF, Stewart-Maynard KM, Wang F, Mitra M, Gorelick RJ, Rouzina I, Williams MC, Musier-Forsyth K. C-terminal Domain Modulates the Nucleic Acid Chaperone Activity of Human T-cell Leukemia Virus Type 1 Nucleocapsid Protein via an Electrostatic Mechanism. Journal of Biological Chemistry. 2010;285:295–307. doi: 10.1074/jbc.M109.051334. [DOI] [PMC free article] [PubMed] [Google Scholar]
- 59.Johnson DC, Huber MT. Directed egress of animal viruses promotes cell-to-cell spread. Journal of Virology. 2002;76:1–8. doi: 10.1128/JVI.76.1.1-8.2002. [DOI] [PMC free article] [PubMed] [Google Scholar]
- 60.Phillips DM. The Role of Cell-to-Cell Transmission in Hiv-Infection. Aids. 1994;8:719–731. doi: 10.1097/00002030-199406000-00001. [DOI] [PubMed] [Google Scholar]
- 61.Yoshida M. Discovery of HTLV-1, the first human retrovirus, its unique regulatory mechanisms, and insights into pathogenesis. Oncogene. 2005;24:5931–7. doi: 10.1038/sj.onc.1208981. [DOI] [PubMed] [Google Scholar]
- 62.Mazurov D, Ilinskaya A, Heidecker G, Lloyd P, Derse D. Quantitative Comparison of HTLV-1 and HIV-1 Cell-to-Cell Infection with New Replication Dependent Vectors. PLoS Pathog. 2010;6 doi: 10.1371/journal.ppat.1000788. [DOI] [PMC free article] [PubMed] [Google Scholar]
- 63.Giam CZ, Jeang KT. HTLV-1 Tax and adult T-cell leukemia. Frontiers in Bioscience. 2007;12:1496–1507. doi: 10.2741/2163. [DOI] [PubMed] [Google Scholar]
- 64.Baydoun HH, Bellon M, Nicot C. HTLV-1 Yin and Yang: Rex and p30 Master Regulators of Viral mRNA Trafficking. Aids Reviews. 2008;10:195–204. [PMC free article] [PubMed] [Google Scholar]
- 65.Mansky LM. HIV mutagenesis and the evolution of antiretroviral drug resistance. Drug Resistance Updates. 2002;5:219–223. doi: 10.1016/s1368-7646(02)00118-8. [DOI] [PubMed] [Google Scholar]
- 66.Chen RX, Quinones-Mateu ME, Mansky LM. Drug resistance, virus fitness and HIV-1 mutagenesis. Current Pharmaceutical Design. 2004;10:4065–4070. doi: 10.2174/1381612043382404. [DOI] [PubMed] [Google Scholar]
- 67.Fogarty KH, Zhang W, Grigsby IF, Johnson JL, Chen Y, Mueller JD, Mansky LM. New Insights into HTLV-1 Particle Structure, Assembly, and Gag-Gag Interactions in Living Cells. Viruses-Basel. 2011;3:770–793. doi: 10.3390/v3060770. [DOI] [PMC free article] [PubMed] [Google Scholar]
- 68.Chukkapalli V, Ono A. Molecular Determinants that Regulate Plasma Membrane Association of HIV-1 Gag. J Mol Biol. 2011;410:512–524. doi: 10.1016/j.jmb.2011.04.015. [DOI] [PMC free article] [PubMed] [Google Scholar]
- 69.Gao WT, Rzewski A, Sun HJ, Robbins PD, Gambotto A. UpGene: Application of a web-based DNA codon optimization algorithm. Biotechnol Prog. 2004;20:443–448. doi: 10.1021/bp0300467. [DOI] [PubMed] [Google Scholar]
- 70.Kozak M. Compilation and Analysis of Sequences Upstream from the Translational Start Site in Eukaryotic Messenger-Rnas. Nucleic Acids Res. 1984;12:857–872. doi: 10.1093/nar/12.2.857. [DOI] [PMC free article] [PubMed] [Google Scholar]
- 71.Kozak M. An Analysis of 5′-Noncoding Sequences from 699 Vertebrate Messenger-Rnas. Nucleic Acids Res. 1987;15:8125–8148. doi: 10.1093/nar/15.20.8125. [DOI] [PMC free article] [PubMed] [Google Scholar]
- 72.Derdowski A, Ding LM, Spearman P. A novel fluorescence resonance energy transfer assay demonstrates that the human immunodeficiency virus type 1 Pr55(Gag)I domain mediates Gag-Gag interactions. J Virol. 2004;78:1230–1242. doi: 10.1128/JVI.78.3.1230-1242.2004. [DOI] [PMC free article] [PubMed] [Google Scholar]
- 73.Chen Y, Wei LN, Muller JD. Unraveling protein-protein interactions in living cells with fluorescence fluctuation brightness analysis. Biophys J. 2005;88:4366–4377. doi: 10.1529/biophysj.105.059170. [DOI] [PMC free article] [PubMed] [Google Scholar]
- 74.Macdonald PJ, Chen Y, Chen Y, Wang X, Mueller JD. Brightness Analysis by z-scan Fluorescence Fluctuation Spectroscopy for the Study of Protein Interactions within Living Cells. Biophys J. 2010;99:979–988. doi: 10.1016/j.bpj.2010.05.017. [DOI] [PMC free article] [PubMed] [Google Scholar]
- 75.Axelrod D. Biophysical Tools for Biologists, Vol 2: In Vivo Techniques. Vol. 89. Elsevier Academic Press Inc; San Diego: 2008. Total Internal Reflection Fluorescence Microscopy; pp. 169–221. [Google Scholar]
Associated Data
This section collects any data citations, data availability statements, or supplementary materials included in this article.