

Introduction
The existence of intestinal epithelial stem cells (ISCs) that can generate the four main lineages of the small intestine (absorptive, goblet, enteroendocrine, Paneth) has been recognized for the last 40 years (Cheng and Leblond, 1974). There have been recent strides in the characterization of both ISC biology, and the niche they occupy (Barker et al., 2012; King and Dekaney, 2013; Lund, 2012; Noah et al., 2011). These advances have in large part been a product of transgenic reporter mice. Information emerging from in vivo studies of these mice including ISC behavior in normal physiology, development, cancer, and response to damage, have shed new light on the existing notion of two distinct ISC populations or phenotypic states. The crypt base columnar cells (CBCs), intercalated amongst Paneth cells in the crypt base, are rapidly cycling (every 24h) and display high levels of Lgr5 promoter activity which can be traced into all four lineages (Barker et al., 2007). For this reason the CBC cells are referred to as the “active ISC” and are believed to be primarily responsible for the rapid turnover of the intestinal epithelium during normal homeostasis (Barker et al., 2012). Other prominent markers of the actively cycling ISC include olfactomedin 4 (Olfm4) (Van der Flier et al., 2009a) and achaete-scute complex homolog 2 (Ascl2) (Van der Flier et al., 2009b). Located above the Paneth cells in the “+4” cell position (distributed from +2 to +7) are the long lived, slowly cycling stem cells (Potten, 1998). Validated genetic markers of the +4 cell, include polycomb ring finger oncogene (Bmi-1) (Sangiorgi and Capecchi, 2008), mouse telomerase (mTert) (Montgomery et al., 2011), homeodomain only protein × (HopX) (Takeda et al., 2011), and leucine-rich repeats and immunoglobulin-like domains protein 1 (Lrig1) (Powell et al., 2012). The supra-Paneth cells labeled by these markers have demonstrated the potential to generate the four main intestinal lineages, and to cycle at higher frequency following damage (Montgomery et al., 2011; Powell et al., 2012; Takeda et al., 2011; Yan et al., 2012). The active and slow-cycling ISC populations appear to be engaged in a fluid relationship in which +4 cells can generate the CBC pool (Tian et al., 2011; Yan et al., 2012), and conversely the CBC can generate the +4 cells in a bidirectional phenomenon termed interconversion (Takeda et al., 2011). Furthermore, and in the same vein, it has been proposed that the Lgr5+ cells express transcripts associated with quiescence (Bmi1, mTert, Hopx and Lrig1) while maintaining an active status in the CBC position (Munoz et al., 2012). Adding to this concept of plasticity, recent publications suggest that committed progenitors or subsets of both Paneth and enteroendocrine cells may re-enter the cell cycle following damage (Buczacki et al., 2013; Roth et al., 2012; van Es et al., 2012; Van Landeghem et al., 2012).
While the various ISC reporter transgenic mice have allowed for elegant experiments and new insight, this approach is limited to these specifically-engineered animals and thus has experimental and therapeutic limitations. In contrast, fluorescence-activated cell sorting (FACS) approaches using antibodies against surface markers such as doublecortin-like kinase 1 (DCLK1), CD24, CD166, and LRIG1 offer the potential to sort ISC from any mouse or human. However each of these antibody-based approaches have caveats of their own: DCLK1 is expressed on slow-cycling ISC and differentiated tuft cells (Gerbe et al., 2009), CD24 and CD166 are expressed on actively-cycling ISC and Paneth cells (Levin et al., 2010; von Furstenberg et al., 2011), and while Lrig1 is expressed on slow-cycling ISC, high levels of Lrig1 are expressed in the CBC (Wong et al., 2012). In light of these caveats a selection method based on a conserved stem cell property of dye efflux offers an attractive alternative approach to surface marker strategies. As indicated above, a major advantage of a reporter-independent method is that it will facilitate translation to human tissue. Additionally it will benefit mechanistic studies of ISC biology: a) by allowing routine experiments on WT mice, thus avoiding the need for costly procurement and maintenance of reporter mice; b) and by allowing investigation of the factors influencing ISC behavior by allowing studies on existing KO mice (e.g. lacking putative ISC growth factor) without the need for time-consuming and expensive crossing of reporter lines to KO lines.
The side population (SP) phenotype is due to the presence of xenobiotic efflux transporters found on the membrane of stem cells. The technique, originally developed utilizing the DNA-binding dye Hoechst 33342 (referred to as Hoechst in this text) with bone marrow cells (Goodell et al., 1996a), has now been used to successfully isolate stem cells from many solid tissues including skeletal muscle, lung, liver, testis, kidney, skin, mammary gland, heart, and brain (Challen and Little, 2006). Our laboratory reported in 2005 the use of SP sorting to enrich for ISC from wild-type (WT) mice (Dekaney et al., 2005). qRT-PCR of the intestinal SP compared to intact jejunum revealed enrichment in the ISC marker Musashi-1 (Msi1) (Dekaney et al., 2005). Interestingly, a follow up study using microarray combined with Gene Ontology analysis found a de-enrichment of transcripts associated with mitosis in the SP (Gulati et al., 2008). The same study also validated the SP as originating primarily from the crypt base by performing in situ for 36 transcripts enriched in the SP, of which 32 were found to be restricted to the crypt base.
We hypothesized that the intestinal SP we have previously reported (Dekaney et al., 2005; Gulati et al., 2008) represents the slowly-cycling ISC population and that another effluxing population is apparent above the traditional intestinal SP (i.e. greater fluorescence of Hoechst blue), newly characterized in this publication, which represents the actively cycling CBC. For the purpose of this paper the traditional SP will be referred to as the lower SP (LSP) and the newly described upper SP as USP from here forward as we report a series of experiments to test this hypothesis. We conclude from these studies that this one method of SP sorting represents a valuable contribution to the field because it will allow for the simultaneous isolation of fractions enriched for actively cycling and non-cycling ISC simultaneously from WT mice.
Materials and methods
Mice
WT adult male C57BL/6J mice and heterozygote breeder pairs of Lgr5-EGFP-IRES-creERT2 mice were obtained from The Jackson Laboratories, and housed under a 12:12-h light-dark cycle in American Association for Accreditation of Laboratory Animal Care-approved facilities. All animals were used within the age range of 6–8 weeks. All WT and Lgr5-EGFP-IRES-creERT2 animal usage had IACUC approval. Cyp1a1-histone 2B-YFP mice have previously been described (Lopez-Garcia et al., 2010). Histone 2B-YFP mice were bred and housed according to UK Home Office guidelines.
Flow Cytometry and FACS
Cell preparation and SP staining/analysis
Epithelial cells were isolated from the jejunum of WT and Lgr5-EGFP mice using our previous published EDTA method (von Furstenberg et al., 2011). For SP analysis, cells from the preparation were incubated in “SP buffer” made with 2% FBS, and 10mM HEPES (Life Technologies) in HBSS (Life Technologies) and either Hoechst 33342 (10 μg/ml equal to 17 μM) (Sigma-Aldrich) or Vybrant DyeCycle Violet (DCV) 10 μM (Life Technologies) for 90 min at 37°C. Following the incubation, the cells were washed with ice cold HBSS and labeled with propidium iodide (Sigma-Aldrich) and CD45-FITC (Biolegend) at 0.5 μg/106 cells for removal of cells that were dead and/or of hematopoetic origin. For validation purposes, in order to block vital dye efflux, cells were pre-incubated with 100 μM verapamil (Sigma-Aldrich) for 20 min at 37°C and incubated with the above SP solution for 90 min at 37°C with the addition of 100 μM verapamil. To generate the SP fluorescent phenotype, Hoechst 33342 samples were excited using a UV laser on a MoFlo (Beckman Coulter) fluorescence activated cell sorting (FACS) machine while DCV samples were excited using a 405 nm laser CyAn flow cytometer (Beckman Coulter) or an LSRII flow cytometer (BD). Corresponding band-pass filter sets were: MoFlo (blue 450-50 nm, red 670-30 nm), CyAn (blue 450-50 nm, red 680-20 nm), and LSRII (blue 450-50 nm, red 660-20 nm). On each machine, the SP was defined on the redlo population which was eliminated by verapamil (Fig. 1). For analyses and cell collections, the SP was subdivided into two regions: upper SP (USP), and lower SP (LSP).
Fig 1.

Representative SP plots demonstrating the different flow cytometer and vital dye combinations utilized in this study with gates illustrating the demarcation of the USP and LSP fractions. The right-hand panels display corresponding controls in which the SP fractions are cleared by verapamil inhibition of the effluxers responsible for the SP phenotype.
SP & EdU S phase analysis
WT mice were injected intraperitoneally with 100 μg EdU (5-ethynyl-2′-deoxyuridine) in PBS, and sacrificed 1h post-injection. The jejunum was harvested and epithelial cells were isolated, labeled for SP analysis (Hoechst) as mentioned above, and the LSP and USP fractions of the SP phenotype were collected using a MoFlo cell sorter. The LSP and USP cell collections were then processed for EdU detection using the Click-it kit (Life Technologies) with an Alexa-647 fluor. The LSP and USP cell collections were subsequently analyzed for EdU positivity using a CyAn flow cytometer.
SP & Lgr5-EGFP tracking
Lgr5-EGFP+/− mice were sacrificed, and jejunal epithelial cells isolated. The cells were incubated and labeled for SP analysis (DCV) as described above. The cells were then analyzed using the CyAn to detect both SP fluorescence as well Lgr5-EGFP signal from the same sample. Summit 4.2 software was used to track the Lgr5-EGFPhi cells with respect to their SP phenotype.
SP & histone 2B-YFP tracking
Histone 2B-YFP mice were induced by three intraperitoneal injections of β-naphthoflavone (80mg/kg) over a 24 h period. Mice were sacrificed ten days later, and jejunal epithelial cells isolated using the same technique as above. Cells were incubated and labeled for SP analysis (DCV) as described above. Following DCV incubation and washing, cells were labeled with Ulex europaeus agglutinin I to bind fucosylated glycoconjugates on Paneth cells (UEA)-Alexa Fluor 647 (1:1000) (custom conjugation – AbD Serotec), CD24-PE.Cy7 to label cells from the intestinal crypt base (1:200) (Biolegend), CD45-Alexa Fluor 647 to exclude cells of hematopoietic origin, (1:400) (Biolegend) and propidium iodide for dead cell exclusion (1 ug/ml) (Sigma-Aldrich). Cells were analysed on an LSR II flow cytometer and data analyzed with FlowJo 7.6.
Enteroendocrine cell quantification of SP fractions
The jejunum was harvested and epithelial cells were isolated, labeled for SP analysis (Hoechst) as described above, and the LSP and USP fractions of the SP phenotype were collected using a MoFlo cell sorter. The LSP and USP cell collections were then permeabilized and labeled with synaptophysin antibody (Epitomics) as described by Bjerknes and Cheng, with the only exception being our use of the synaptophysin antibody at an increased 1:500 concentration (Bjerknes and Cheng, 2010). Next, the synaptophysin antibody was secondarily labeled with a DyLight 649 anti-rabbit antibody (Biolegend) at a 1:500 dilution and reanalyzed on the CyAn. To validate the synaptophysin antibody in our hands it was tested on intestinal cells isolated from peptide YY-GFP mice, in which the peptide-YY subset of enteroendocrine cells express GFP (Bohorquez et al., 2011).
qRT-PCR of SP fractions
LSP and USP were collected into lysis buffer and RNA isolated using the RNAqueous-Micro kit (Life Technologies). cDNA was generated using the High Capacity cDNA Reverse Transcription Kit (Life Technologies). Quantitative reverse transcriptase PCR (qRT-PCR) was conducted for each sample in triplicate. Taqman probes (Actb, Mm00607939_s1; Dclk1, Mm00444950_m1; Lgr5, Mm00438890_m1; Lrig1, Mm00456116_m1; mTert, Mm00436931_m1; Ascl2, Mm01268891_g1; Olfm4, Mm01320260_1; Bmi1 Mm03053308_g1; Hopx, Mm00558630_m1; SI, Mm01210305_m1; Lyz, Mm00727183_s1; ChgA Mm00514341_m1; Muc2, Mm00458299_m1were obtained from Life Technologies and used according to manufacturer’s protocol. β-Actin RNA was used as an internal control due to its similar Ct threshold values between USP and LSP when the same number of cells were collected.
Clonogenic assay and immunohistochemistry of enteroids
USP and LSP cells were collected using a MoFlo FACS machine and cultured using a modification of the Sato culture method in which CHIR99021, a GSK3 inhibitor, is used in place of recombinant Wnt3a. CHIR99021 has been used successfully in the growth of intestinal stem cells by activating the Wnt cascade (de Lau et al., 2011; Ruffner et al., 2012; Wang et al., 2013). The SP subfractions were pelleted by centrifugation at 100 × G and resuspended in matrigel (BD) supplemented with growth factors to a concentration of 1000 cells/μl and plated at 10 μl per well in a 48-well plate. Growth factors were included in the matrigel in the following concentrations: Jagged-1 (20 μM) (R&D), EGF (1ug/ml) (R&D), Noggin (2 μg/ml) (R&D), R-spondin (10 μg/ml) (R&D), CHIR99021 (100 μM) (Selleckchem), Y27632 (200 μM) (BD). After polymerization of the Matrigel, 200 μl DMEM/F12 media (Invitrogen) supplemented with GlutaMax (1:100) (Invitrogen), HEPES (10 mM), gentamicin/kanamycin (1:100), N2 supplement (1:100) (Invitrogen), B27 retinoic acid free (1:50) (Invitrogen) was added to each well. Media was changed every 4 days and supplemented with growth factors at 2 days following replacement with growth factors at a 20-fold lower concentration than in the initial matrigel plating. Y27632 and Jagged-1 were not added beyond the initial plating. At day 4 the number of surviving enterospheres in each well was counted in order to calculate the clonogenic efficiency. At 20 days post plating, culture media was aspirated, and Matrigel-suspended enteroids were fixed in 4% paraformaldehyde (PFA) at room temperature for 20 min. The culture plate was centrifuged at 375 × G for 2 min, and 4% PFA was carefully aspirated. Enteroids were then suspended in 30% sucrose at 4°C for 12 h. The plate was centrifuged at 375 × G for 2min and supernatant was carefully aspirated. Enteroids were re-suspended in a 5ul of 30% sucrose and embedded into Optimum Cutting Temperature (O.C.T.) compound (Sakura-Finetek) and frozen for sectioning. 10 μm enteroid sections were collected onto glass slides. Sections dried at room temperature and were stored at −80°C until time of staining. Enteroid sections were labeled with antibodies using the method described by Gracz et al. to detect intestinal lineages (Gracz et al., 2010).
Results
Establishing the USP and LSP
Out of necessity three different machines (Beckman Coulter MoFlo, Dako CyAn, BD LSRII) and two different vital dyes, Hoechst and Vybrant DyeCycle Violet (DCV), were used in this study to analyze and collect the SP fractions. It has been previously demonstrated that both Hoechst and DCV SP have the same membrane pump specificity and generate similar stem cell populations from mouse hematopoietic cells (Telford et al., 2007). Using verapamil to block the efflux transporters, which is the accepted way to define the SP (Goodell et al., 1996b), we found the LSP and USP fractions to be in the same orientation using both Hoechst (analyzed by MoFlo) (Fig. 1A) and DCV (analyzed by CyAn and LSRII) (Fig. 1B,C). Since DCV is excited by the 405nm laser which is commonly equipped on flow cytometers, it serves as a practical alternative to Hoechst which requires the less prevalent UV laser for excitation. In the three aforementioned dye/instrument combinations, the LSP, previously described as the intestinal SP by our group (Dekaney et al., 2005), is characterized by a “tail” extending from the majority non-SP population into the dimmest region of the red-blue bivariate plot. The USP is visualized above the LSP along the blue axis, distinguished by its greater blue fluorescence (Fig.1). The machine used for analysis or collection, along with the dye utilized, will be described in this format (Machine/Dye) within the following subsections.
SP and EdU S phase analysis
To investigate the proliferative activity of the SP fractions, the USP and LSP were analyzed for 5-Ethynyl-2′-deoxyuridine (EdU) positivity 1h after injection of WT mice with the thymidine analog. Because the SP phenotype is reliant on extrusion of vital dyes by membrane efflux pumps of the ATP-binding cassette (ABC) transporter superfamily, the collection of the SP fractions had to be performed before fixation of the cells for EdU detection. After SP fraction collection (MoFlo/Hoechst), the fractions were reanalyzed for EdU positivity and displayed a marked difference. The USP was 36 ± 4% EdU positive upon reanalysis (Fig. 2A) while the LSP was only 0.4 ± 0.04% EdU positive (Fig. 2B). These data suggest the actively cycling ISC are likely to reside in the USP. Conversely the paucity of S phase cells in the LSP, taken along with our group’s previous SP publications, suggests it may harbor ISC that cycle very infrequently.
Fig 2.

Locating the actively cycling cells with regard to the SP fractions. C57/BL6 mice were injected with 100 μg EdU. 1h post injection, jejunal epithelial cells were isolated and processed for SP analysis, and the USP and LSP fractions collected (MoFlo/Hoechst). After collection the cells were fixed, permeabilized, and the EdU coupled with a fluor (A647), then reanalyzed for EdU positivity. (A) The USP was 36 ± 4% EdU positive, (B) while the LSP was 0.4 ± 0.04% EdU positive, n=3.
SP & Lgr5-EGFP tracking
Since Lgr5 is a well characterized marker of actively cycling ISCs (Barker et al., 2007), Lgr5-EGFP-IRES-creERT2 mice (referred to as Lgr5-EGFP mice from here forward) were used to assess the distribution of Lgr5+ cells between the USP and the LSP. To this end, following the SP analysis (CyAn/DCV) of intestinal epithelial cells from Lgr5-EGFP mice (Fig. 3A), the Lgr5-EGFPhi fraction was gated forward onto an SP plot with pre-established USP and LSP gates (Fig. 3C). Supporting the S phase data from the EdU experiment which suggested the actively cycling ISC reside in the USP, 96 ± 2% of the Lgr5-EGFPhi cells fell within the USP gate. In contrast the LSP contained only 1.3 ± 0.6% of the Lgr5-EGFPhi cells. Quantitation of the actual Lgr5-EGFPhi contribution to the overall makeup of the USP was not possible due to the mosaic expression of Lgr5-EGFP in the intestine of these mice. Since only a minority of crypts in the Lgr5-EGFP mice actually express EGFP (von Furstenberg et al., 2011), a large proportion of the EGFP-negative cells in the USP may in fact be Lgr5+.
Fig 3.
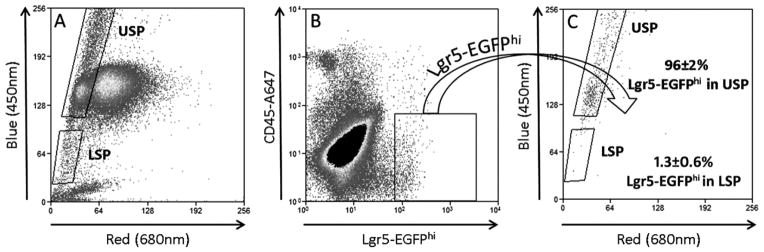
Tracking the Lgr5-EGFPhi cells to the SP fractions. (A) Jejunal epithelial cells were isolated from Lgr5-EGFP mice and processed for SP analysis (CyAn/DCV) to establish the SP fractions. (B) The “hi” subset (brightest) of Lgr5-EGFP+ cells are actively cycling ISCs (Sato et al., 2009) and were gated forward onto the pre-established USP and LSP gates. (C) 96 ± 2% Lgr5-EGFPhi cells track to the USP, while 1.3% were found in the LSP, n=3.
SP & histone 2B-YFP LRC tracking
Histone 2B-YFP label retaining cells (YFP-LRCs) identify quiescent populations in a manner analogous to traditional nucleotide label retaining assays with the additional benefits of being non-mutagenic and not requiring the cell to having passed through S-phase in order to be labeled (Buczacki et al., 2013; Foudi et al., 2009; Hughes et al., 2012). An initial SP plot was generated (LSRII/DCV) to establish the USP and LSP gates, (Fig. 4C). YFP-LRCs were isolated as crypt base, non-Paneth YFP+ cells i.e. CD45−, UEA−, CD24+ and YFP+ as described in (Fig. 4A,B) using recently published methods (Buczacki et al., 2013). Forward gating of YFP-LRCs onto a SP plot demonstrated that 75 ± 6% of YFP-LRCs fell into the collective SP gates (USP and LSP). Of those YFP-LRCs in the SP approximately half (54 ± 1.5%) resided in the LSP and (46 ± 2%) in the USP region (Fig. 4D).
Fig 4.

Distribution of the histone 2B-LRC within the SP. (A) Cartoon illustrating Cyp1a-histone 2B-YFP mouse intestinal crypt before and after histone 2B-YFP induction with β-napthaflavone, and consequent washout. (B) Crypt epithelium was isolated 10d post injection, and incubated with DCV, anti-CD24 antibody, and UEA. (C) SP fraction gates (LSRII/DCV) were established on the whole epithelium from histone 2B mouse. Software gating selections were made based on positivity for YFP and anti-CD24 antibody, and negativity for UEA-A647 and anti-CD45 antibody (not illustrated). 46 ± 2% of YFP-LRCs (single, live, CD45−, UEA−, CD24+, YFP+) gate forward to the USP and 54 ± 2% to the LSP, n=3.
qRT-PCR of SP sub-populations
The experiments to this point suggest that the actively cycling ISCs are restricted to the USP while the histone 2B-YFP LRCs are present in both the LSP and USP. To explore the transcriptional profile of the SP fractions, USP and LSP were collected (MoFlo/Hoechst) for qRT-PCR with primer/probes for active and quiescent ISC markers. Additionally we used primer/probes for the four principal intestinal lineages to give some insight into the non-stem cell makeup of the SP fractions.
USP
As expected from the data already presented in Figs. 2 and 3, the USP was enriched in all active ISC markers examined (Fig. 5A), specifically: Lgr5 (25 ± 3), Ascl2 (47 ± 16), and Olfm4 (10 ± 2). Furthermore, in accordance with the histone 2B-YFP LRC flow cytometric data, the quiescent ISC associated transcripts were enriched as well: Lrig1 (37 ± 15), Bmi1 (84 ± 15), mTert (39 ± 15), Hopx (13 ± 4), and Dclk1 (5 ± 2). In regard to lineage positive cells, the USP was significantly enriched in transcripts for the goblet cell marker mucin 2 (Muc2) (4.0 ± 1.0), the Paneth cell marker lysozyme (Lyz) (23 ± 8), and the enteroendocrine marker chromogranin A (ChgA) (6.3 ± 1.7) while being de-enriched in the absorptive cell marker sucrase isomaltase (SI) (0.4 ± 0.1).
Fig 5.
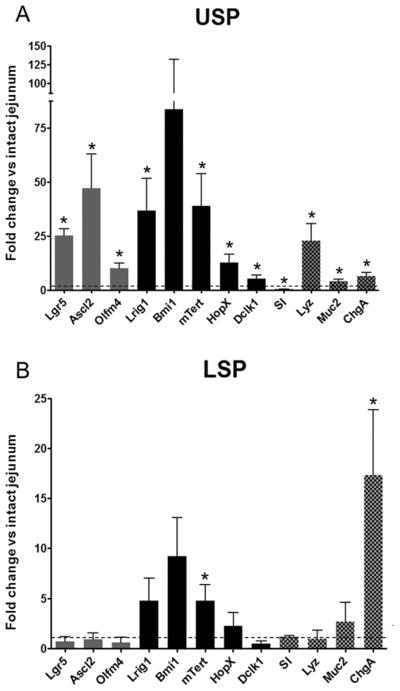
qRT-PCR analysis of the USP (A) and LSP (B) compared to intact jejunum for transcripts of active (gray bars) and quiescent (black bars) ISC, as well as lineages (checkered bars). Active ISC markers shown include leucine rich repeat containing G protein coupled receptor 5 (Lgr5), achaete-scute complex homolog 2 (Ascl2), and olfactomedin 4 (Olfm4). Markers of quiescent ISC examined include leucine-rich repeats and immunoglobulin-like domains 1 (Lrig1), Bmi1 polycomb ring finger oncogene (Bmi1), mouse telomerase reverse transcriptase (mTert), HOP homeobox (HopX), and doublecortin-like kinase 1(Dclk1). Lineages markers shown: sucrase-isomaltase (SI) [absorptive cell], lysozyme (Lyz) [Paneth cell], mucin 2 (Muc2) [Goblet cell], and chromogranin A (ChgA) [enteroendocrine cell]. Bars show mean ± s.e.m., dashed line represents intact jejunum, and * denotes p < 0.05, n = 5–6.
LSP
The LSP was de-enriched relative to intact jejunum for active ISC markers, Lgr5 (0.7 ± 0.5), Ascl2 (0.9 ± 0.6), and Olfm4 (0.6 ± 0.5), (Fig. 5B). In contrast, mTert mRNA was significantly enriched while other quiescent ISC markers were increased but did not achieve statistical significance, Lrig1 (4.8 ± 2.2), Bmi1 (9.2 ± 3.9). Dclk1, the quiescent ISC/tuft cell marker was de-enriched (0.5 ± 0.3). The LSP showed no enrichment for absorptive, goblet, or Paneth cell transcripts: SI (1.2 ± 0.1), Muc2 (2.7 ± 1.9), and Lyz (1.0 ± 0.9) respectively, (Fig. 5B). However, the enteroendocrine marker chromogranin A (ChgA) was elevated in the LSP (17.3 ± 6.6), (Fig.5B).
Enteroendocrine cell quantification in SP fractions
In view of the significant enrichment of ChgA mRNA in the LSP, together with compelling publications implicating this lineage, or a subset, as a reserve stem cell pool (Sei et al., 2011; Van Landeghem et al., 2012), we assessed the prevalence of enteroendocrine cells in our two SPs. As can be seen in Fig. 6, flow cytometric analysis with antibodies to the pan-enteroendocrine marker synaptophysin showed that very few cells in the USP and LSP were synaptophysin positive (0.3 ± 0.08% and 1.8 ± 0.5% respectively). To validate the enteroendocrine specificity of the synaptophysin antibody we tested it against intestinal epithelial cells isolated from the PYY-GFP mice, developed by Bohorquez et al., in which the PYY producing subset of enteroendocrine cells express GFP (Bohorquez et al., 2011). Our resulting flow analysis demonstrated that almost all PYY-GFP (93.5 ± 1.5%, n=4) of the PYY-GFP expressing enteroendocrine subset cells were found in the synaptophysin positive quadrant, (Supplemental Fig. 1).
Fig 6.
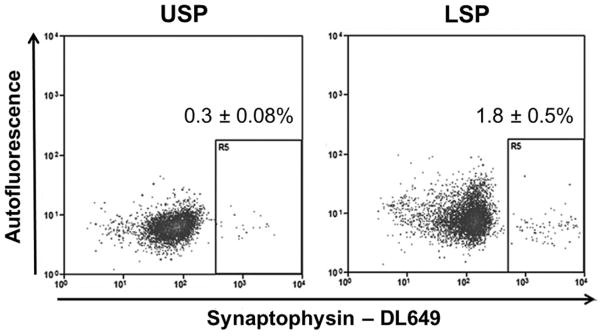
Quantifying the percent of enteroendocrine cells in the SP fractions using flow cytometric analysis of synaptophysin. Cells from the USP and LSP were collected based on SP analysis, fixed, permeabilized, labeled with synaptophysin antibody and reanalyzed by flow cytometry. The USP and LSP were 0.3 ± 0.08% and 1.8 ± 0.5% synaptophysin positive respectively, n=3.
Clonogenic assay of SP fractions
Three dimensional Matrigel culture of putative ISC populations has become a commonly used method to evaluate stemness (Lin and Barker, 2011). Intestinal stem cell expansion is manifested first by enterosphere formation and progressing on to a complex enteroid phenotype as defined by crypt bud genesis resulting in a multilobular appearance (Stelzner et al., 2012). Both the USP and LSP displayed the ability to form enterospheres and consequent enteroids which were maintained out to 20 days post plating, at which time they were harvested. Despite the unique characteristics of the two SP subfractions there was no apparent difference in morphology between the USP and LSP outgrowths (Fig. 7A). Moreover there was no significant difference in the efficiency with which the two SP subfractions generated enterospheres per 10,000 USP or LSP cells plated: USP (13.7 ± 3.7) and LSP (10.3 ± 0.7), n=3. Each of the four intestinal cell lineages (absorptive, goblet, enteroendocrine, and Paneth) was found in both USP and LSP enteroids as defined by the respective markers: sucrase-isomaltase, mucin 2, substance P, and lysozyme (Fig. 7B).
Fig 7.

Culture of USP and LSP cells in modified Sato conditions. (A) Typical brightfield images depicting growth over 20 days, with scale as shown. (B) Immunofluorescent staining of enteroids harvested at day 20 for lys (Paneth cells), muc 2 (goblet cells), sub P (enteroendocrine cells), and SI (absorptive cells).
Discussion
This paper reports the use of SP sorting to successfully isolate two phenotypically different putative ISC populations from WT mice. Most notable is the near 100 fold difference in the percentage of cells undergoing S-phase when comparing the LSP to the USP as seen in Fig. 1. Furthermore, we demonstrated that Lgr5-EGFPhi cells, which represent the actively cycling ISC (Sato et al., 2009), were found to reside in the USP when tracked on the SP plot. In contrast, when tracking the histone 2B-YFP-LRC on an SP plot we found that the distribution of YFP-LRC was spread between the LSP and USP with a slight bias to LSP. Upon sorting and processing the USP and LSP for mRNA analysis, we found differing transcriptional profiles via qRT-PCR. In support of the notion that the LSP is characteristic of the slow cycling or noncycling ISC pool, mRNA markers associated with quiescent ISC were enriched, while those of the actively cycling ISC were de-enriched. The LSP, otherwise free from lineage transcripts, displayed a high level of ChgA mRNA. To evaluate the possibility that the LSP contained a significant proportion of enteroendocrine cells, we employed a flow cytometric method based on the pan-endocrine marker synaptophysin (Roth et al., 2012; van Es et al., 2012). The results showed that less than 2% of the LSP are enteroendocrine cells. This finding exemplifies the caution that transcript levels, especially from secretory cells, are not necessarily indicative of cell number (Dehmer et al., 2011; Stahlberg et al., 2011).
The SP phenotype is conferred when a cell expresses a combination of effluxing membrane proteins belonging to the ATP-binding cassette (ABC) superfamily including multi-drug resistance 1 (Mdr1 human, Mdr1a/1b mouse) or ATP-binding cassette, sub-family G (WHITE), member 2 (Abcg2) also referred to as breast cancer resistance protein 1 (Bcrp1) which eliminate DNA binding dyes such as Hoechst 33342 (Challen and Little, 2006) or DyeCycle Violet (Telford et al., 2007). Despite this efflux, some dye binds to the DNA and the resulting fluorescence is determined by DNA content of the cell. The interpretation of cell cycle activity/DNA content from an SP plot has been demonstrated with bone marrow cells (Goodell, 2005; Petriz, 2007) in which a population above the classical SP (greater blue emission) is actively cycling. Optimizing instrument settings during our intestinal SP analysis (Fig. 1) revealed an additional effluxing population (USP) above the traditional SP (now LSP), which patterned similar to the bone marrow SP previously mentioned. Confirming the similarity, we found the USP to be highly enriched in cells which incorporated EdU following a 1h pulse (Fig. 2).
To examine the relationship between the active ISC population and SP phenotype, we performed SP analysis on jejunal epithelium from Lgr5-EGFP mice, and found that almost all Lgr5-EGFPhi cells reside in the USP (Fig. 3). Unfortunately, as referenced in our results, due to the mosaicism of Lgr5-EGFP expression in this mouse line, we could not estimate the total contribution of Lgr5 cells to the USP. As mentioned in the introduction there are no published ISC membrane markers which are exclusive to the active Lgr5− population so we were precluded from further investigation as to the exact percentage of these cells in the USP. A further important question awaiting development of appropriate approaches is whether the USP also contains Lgr5-negative cells which have stem cell properties.
Validating the presence or absence of the slowly cycling ISCs in the SP regions proved more challenging, primarily because unlike the Lgr5-EGFP mouse, there is not an equivalent commercially available mouse with a fluorescent reporter driven by a promoter that is specific to quiescent ISCs. As an alternate approach, we utilized a recently described method in which an inducible fusion protein (histone 2B -YFP) is used to identify long term label-retaining cells (LRCs) from the supra-Paneth zone of the mouse intestinal crypt (Buczacki et al., 2013; Hughes et al., 2012). Using this approach allowed for tracking of the LRC, from the crypt position associated with the slow cycling ISC (Potten et al., 2002), to an SP plot. As shown in Fig. 4 the LRCs had a relatively even distribution between the LSP and USP, slightly more in the LSP. This was not unexpected because although the LRCs are slow cycling, some portion will enter, or be in, the cell cycle at any given time (Potten et al., 2002), putting them in the USP. Such a distribution is consistent with recent findings from the Mahida laboratory that after a 28d chase, 38.5% of non-Paneth histone 2B-LRC cells were cycling as evidenced by Ki-67 staining (Hughes et al., 2012). Considering differences in experimental technique, their finding of 38.5% of the LRC in cell cycle, is quite similar to our 46% non-Paneth LRC found in the USP.
Analysis of the transcriptional profiles of the LSP and USP in terms of ISC markers (quiescent and active) as well as markers of the epithelial lineages (Fig. 5) provided further evidence that the LSP and USP are distinct populations. As expected from the Lgr5-EGFPhi tracking experiment (Fig. 2), we found an enrichment of the active ISC markers Lgr5, Ascl2, and Olfm4 in the USP. Interestingly, markers associated with quiescence (Lrig1, Bmi1, mTert, HopX, and Dclk1) were also enriched in the USP compared to intact jejunum. This is in agreement with the recent report that the Lgr5+ cells contain transcriptional profiles of both active and quiescent ISCs (Munoz et al., 2012) and with the emerging concept that the majority of so-called “quiescence markers”, with the possible exception of mTert, are not directly related to quiescence per se rather loosely associated with cell position +4 of the crypt. The LSP in contrast expressed only the quiescent ISC markers (Lrig1, Bmi1, mTert, and HopX) at levels above intact jejunum, and was de-enriched for active ISC transcripts (Lgr5, Ascl2, and Olfm4). As the latter have been definitively identified with cycling ISCs, their absence in the LSP may be considered more informative than the presence of the quiescent markers. With regard to lineage contamination of the USP, the levels of Lyz, Muc2, and ChgA transcripts were increased over intact jejunum. LSP however was relatively free from contaminating lineage markers with the exception of the enteroendocrine marker ChgA.
In light of recent publications that a subset of enteroendocrine cells have ISC potential (Sei et al., 2011; Van Landeghem et al., 2012), we felt it was important to investigate the possibility that the LSP was in fact isolating enteroendocrine cells. To directly assess the number of enteroendocrine cells in the SP regions we collected USP and LSP cells from WT mice and reanalyzed by permeablizing the cells and labeling with an antibody against the pan-enteroendocrine marker synaptophysin. The resulting analysis showed less than 2% of the LSP to be synaptophysin positive indicating the LSP is likely a different population. The ability of a committed secretory progenitor to revert back to a stem cell phenotype following damage has been recently demonstrated, as in the case of the Dll1hi cell (van Es et al., 2012) and the histone 2B-LRC secretory progenitor (Buczacki et al., 2013). The non-cycling status of the LSP (Fig. 2B) suggests the Dll1hi progenitor cells are not included in this fraction. However, as Fig. 4 suggests, the LSP may be the non-cycling subset of the YFP-LRC secretory progenitors identified by the Winton lab (Buczacki et al., 2013).
The matrigel culture assay developed by Sato et al. (Sato et al., 2009) for the evaluation of the intestinal Lgr5-EGFPhi cells has become a benchmark of stemness for putative ISC populations (Lin and Barker, 2011). In the current study both the USP and LSP fractions demonstrated the ability to form mature enteroids in this culture system. Interestingly, there was no significant difference in the efficiency with which they were formed, or apparent difference in outgrowth morphology. These in vitro similarities were surprising in light of the absence of cycling cells, and lack of Lgr5-EGFPhi cells in the LSP. It is possible that the Sato culture method, being a Wnt-driven system, drives the otherwise quiescent LSP toward an active ISC phenotype in a rapid manner. Very similar observations have been made with Bmi1-YFP cells which are normally quiescent in vivo, but become activated when cultured under Sato conditions (Yan et al., 2012). Just as suggested by Yan et al. a logical interpretation of our findings is that in situ, the LSP cells like the Bmi1 cells, are subjected to inhibitory signals from the ISC niche which are not present in the culture. Clearly further work will be needed to explore this scenario.
A recent study that has strengthened the link between intestinal SP and ISCs is the inducible Abcg2-LacZ mouse model allowing for lineage tracing (Fatima et al., 2012). Previously mentioned as one of the vital dye effluxers, Abcg2 has been demonstrated to be the most critical to the SP phenotype in bone marrow, because the SP population was eliminated when the breast cancer resistance protein 1 (Bcrp1) the mouse homolog of Abcg2 was knocked out (Zhou et al., 2002). Fatima et al. used adult Abcg2CreERT2/+RosaLacZ/+ treated with tamoxifen and found 50% of the crypts and associated villi stained positive for LacZ one month afterward, with some crypts/villi remaining positive out to 21 months. This suggests that intestinal ISC of varying lifespan express Abcg2. The division of the SP into an upper and lower portion with respective active and quiescent phenotypes is a concept already applied in the hematopoietic stem cell field. Studies from the Goodell lab identified USP and LSP fractions among hematopoetic stem cells, with the USP representing a more proliferative hematopoietic stem cells with a shorter lifespan and the LSP exhibiting quiescence and longer life span (Challen et al., 2010). In their study, the LSP exhibited a higher engraftment rate and contribution to peripheral blood regeneration than the USP when transplanted into lethally irradiated mice. While these studies from the hematopoetic stem cell field are encouraging, there is still a significant gap to close in our understanding of the intestinal SP with regard to both therapeutic potential and its relationship to ISC physiology.
Studies measuring an increase in intestinal SP (LSP) during development and after challenge have provided further evidence that the LSP is characteristic of a reserve ISC population. Mimicking a clinical procedure, Dekaney et al. investigated jejunal adaption following ileal-cecal surgical resection in mice (Dekaney et al., 2007). Two to three days following resection there was a five-fold increase in the percentage of SP cells, preceding an increase in crypt fission from 4–7d post resection. Utilizing a cytotoxic approach of damaging intestinal epithelium with doxorubicin, SP was found to be initially suppressed, but then surged ahead of crypt fission during regeneration (Dekaney et al., 2009). Lastly, in a study of mouse intestinal development the SP was increased 8-fold at postnatal day 21, a life stage in which approximately 20% of the intestinal crypts are fissioning (Dehmer et al., 2011). The coincident timing again links the increase in SP to a non-homeostatic ISC response. Together these three published studies, in addition to the novel data described herein, describe a population (LSP) which appears to serve as a reserve pool of ISC. While the LSP increased greatly in response to the stressors mentioned above (i.e. resection, cytotoxin exposure, and rapid expansion during development), we have demonstrated that under normal homeostatic conditions the LSP is essentially non-cycling. Thus, this fraction appears to display characteristics of a quiescent or reserve ISC population. Unlike genetically engineered mice, SP analysis offers a valuable tool to isolate and characterize this reserve fraction of ISC in WT mice and likely any other species including human.
Supplementary Material
Supplemental Fig 1. Validation of synaptophysin antibody against intestinal epithelial cells from PYY-GFP mice. Cells were labeled with either (A) isotype or (B) synaptophysin antibody. (B) 93.5 ± 1.5% PYY-GFP cells were synaptophysin positive, n = 4.
Highlights.
Isolation of quiescent intestinal stem cells (ISCs) has remained a challenge
By side population (SP) sorting we show cycling ISCs to be in the upper SP
The lower SP is non-cycling and has markers of the quiescent ISCs
In culture both upper and lower SP cells yield all 4 intestinal lineages
Evidence for a role of lower SP cells in repair of intestinal damage is discussed
Acknowledgments
We wish to thank Dr. Jennifer K. Uno for her constructive comments on the manuscript; and Drs. Chris Dekaney, Kay Lund, Scott Magness, as well as other members of the Intestinal Stem Cell Consortium for helpful discussions as the work progressed. We are grateful to Drs. Rodger Liddle and Diego Bohórquez for the gift of PYY-GFP mouse tissue. In addition we acknowledge valuable assistance from Nancy Fisher and Joan Kalnitsky in the UNC Flow Cytometry Core.
Funding:
This work was supported by the National Institutes of Health Grants P30 DK034987, and U01-DK085547.The latter grant is part of the Intestinal Stem Cell Consortium, a collaborative research project funded by the National Institute of Diabetes and Digestive and Kidney Diseases and the National Institute of Allergy and Infectious Diseases. The UNC Flow Cytometry Core Facility is supported in part by NCI Center Core Support Grant (5P30CA016086) to the UNC Lineberger Comprehensive Cancer Center. Additionally, this work received support from Cancer Research UK.
Footnotes
Publisher's Disclaimer: This is a PDF file of an unedited manuscript that has been accepted for publication. As a service to our customers we are providing this early version of the manuscript. The manuscript will undergo copyediting, typesetting, and review of the resulting proof before it is published in its final citable form. Please note that during the production process errors may be discovered which could affect the content, and all legal disclaimers that apply to the journal pertain.
References
- Barker N, van Es JH, Kuipers J, Kujala P, van den BM, Cozijnsen M, Haegebarth A, Korving J, Begthel H, Peters PJ, et al. Identification of stem cells in small intestine and colon by marker gene Lgr5. Nature. 2007;449:1003–1007. doi: 10.1038/nature06196. [DOI] [PubMed] [Google Scholar]
- Barker N, van Oudenaarden A, Clevers H. Identifying the stem cell of the intestinal crypt: strategies and pitfalls. Cell Stem Cell. 2012;11:452–60. doi: 10.1016/j.stem.2012.09.009. [DOI] [PubMed] [Google Scholar]
- Bjerknes M, Cheng H. Cell Lineage metastability in Gfi1-deficient mouse intestinal epithelium. Dev Biol. 2010;345:49–63. doi: 10.1016/j.ydbio.2010.06.021. [DOI] [PubMed] [Google Scholar]
- Bohorquez DV, Chandra R, Samsa LA, Vigna SR, Liddle RA. Characterization of basal pseudopod-like processes in ileal and colonic PYY cells. J Mol Histol. 2011;42:3–13. doi: 10.1007/s10735-010-9302-6. [DOI] [PMC free article] [PubMed] [Google Scholar]
- Buczacki SJ, Zecchini HI, Nicholson AM, Russell R, Vermeulen L, Kemp R, Winton DJ. Intestinal label-retaining cells are secretory precursors expressing Lgr5. Nature. 2013;495:65–9. doi: 10.1038/nature11965. [DOI] [PubMed] [Google Scholar]
- Challen GA, Boles NC, Chambers SM, Goodell MA. Distinct Hematopoietic Stem Cell Subtypes Are Differentially Regulated by TGF-beta 1. Cell Stem Cell. 2010;6:265–278. doi: 10.1016/j.stem.2010.02.002. [DOI] [PMC free article] [PubMed] [Google Scholar]
- Challen GA, Little MH. A side order of stem cells: the SP phenotype. Stem Cells. 2006;24:3–12. doi: 10.1634/stemcells.2005-0116. [DOI] [PubMed] [Google Scholar]
- Cheng H, Leblond CP. Origin, differentiation and renewal of the four main epithelial cell types in the mouse small intestine. V. Unitarian theory of the origin of the four epithelial cell types. Am J Anat. 1974;141:537–562. doi: 10.1002/aja.1001410407. [DOI] [PubMed] [Google Scholar]
- de Lau W, Barker N, Low TY, Koo BK, Li VS, Teunissen H, Kujala P, Haegebarth A, Peters PJ, van de Wetering M, et al. Lgr5 homologues associate with Wnt receptors and mediate R-spondin signalling. Nature. 2011;476:293–7. doi: 10.1038/nature10337. [DOI] [PubMed] [Google Scholar]
- Dehmer JJ, Garrison AP, Speck KE, Dekaney CM, Van Landeghem L, Sun X, Henning SJ, Helmrath MA. Expansion of intestinal epithelial stem cells during murine development. PLoS One. 2011;6:e27070. doi: 10.1371/journal.pone.0027070. [DOI] [PMC free article] [PubMed] [Google Scholar]
- Dekaney CM, Fong JJ, Rigby RJ, Lund PK, Henning SJ, Helmrath MA. Expansion of intestinal stem cells associated with long-term adaptation following ileocecal resection in mice. Am J Physiol Gastrointest Liver Physiol. 2007;293:G1013–G1022. doi: 10.1152/ajpgi.00218.2007. [DOI] [PubMed] [Google Scholar]
- Dekaney CM, Gulati AS, Garrison AP, Helmrath MA, Henning SJ. Regeneration of intestinal stem/progenitor cells following doxorubicin treatment of mice. Am J Physiol Gastrointest Liver Physiol. 2009;297:G461–G470. doi: 10.1152/ajpgi.90446.2008. [DOI] [PMC free article] [PubMed] [Google Scholar]
- Dekaney CM, Rodriguez JM, Graul MC, Henning SJ. Isolation and characterization of a putative intestinal stem cell fraction from mouse jejunum. Gastroenterol. 2005;129:1567–1580. doi: 10.1053/j.gastro.2005.08.011. [DOI] [PubMed] [Google Scholar]
- Fatima S, Zhou S, Sorrentino BP. Abcg2 expression marks tissue-specific stem cells in multiple organs in a mouse progeny tracking model. Stem Cells. 2012;30:210–21. doi: 10.1002/stem.1002. [DOI] [PMC free article] [PubMed] [Google Scholar]
- Foudi A, Hochedlinger K, Van Buren D, Schindler JW, Jaenisch R, Carey V, Hock H. Analysis of histone 2B-GFP retention reveals slowly cycling hematopoietic stem cells. Nat Biotechnol. 2009;27:84–90. doi: 10.1038/nbt.1517. [DOI] [PMC free article] [PubMed] [Google Scholar]
- Gerbe F, Brulin B, Makrini L, Legraverend C, Jay P. DCAMKL-1 Expression Identifies Tuft Cells Rather Than Stem Cells in the Adult Mouse Intestinal Epithelium. Gastroenterol. 2009;137:2179–2180. doi: 10.1053/j.gastro.2009.06.072. [DOI] [PubMed] [Google Scholar]
- Goodell MA. Stem cell identification and sorting using the Hoechst 33342 side population (SP) Curr Protoc Cytom. 2005;Chapter 9(Unit9):18. doi: 10.1002/0471142956.cy0918s34. [DOI] [PubMed] [Google Scholar]
- Goodell MA, Brose K, Paradis G, Conner AS, Mulligan RC. Isolation and functional properties of murine hematopoietic stem cells that are replicating in vivo. J Exp Med. 1996a;183:1797–1806. doi: 10.1084/jem.183.4.1797. [DOI] [PMC free article] [PubMed] [Google Scholar]
- Goodell MA, Brose K, Paradis G, Conner AS, Mulligan RC. Isolation and functional properties of murine hematopoietic stem cells that are replicating in vivo. J Exp Med. 1996b;183:1797–806. doi: 10.1084/jem.183.4.1797. [DOI] [PMC free article] [PubMed] [Google Scholar]
- Gracz AD, Ramalingam S, Magness ST. Sox9-Expression Marks a Subset of CD24-expressing Small Intestine Epithelial Stem Cells that Form Organoids in vitro. AmJPhysiol Gastrointest Liver Physiol. 2010;298:G590–G600. doi: 10.1152/ajpgi.00470.2009. [DOI] [PMC free article] [PubMed] [Google Scholar]
- Gulati AS, Ochsner SA, Henning SJ. Molecular properties of side population-sorted cells from mouse small intestine. AmJPhysiol Gastrointest Liver Physiol. 2008;294:G286–G294. doi: 10.1152/ajpgi.00416.2007. [DOI] [PubMed] [Google Scholar]
- Hughes KR, Gandara RM, Javkar T, Sablitzky F, Hock H, Potten CS, Mahida YR. Heterogeneity in histone 2B-green fluorescent protein-retaining putative small intestinal stem cells at cell position 4 and their absence in the colon. Am J Physiol Gastrointest Liver Physiol. 2012;303:G1188–201. doi: 10.1152/ajpgi.00080.2012. [DOI] [PubMed] [Google Scholar]
- King SL, Dekaney CM. Small intestinal stem cells. Curr Opin Gastroenterol. 2013;29:140–5. doi: 10.1097/MOG.0b013e32835cf253. [DOI] [PubMed] [Google Scholar]
- Levin TG, Powell AE, Davies PS, Silk AD, Dismuke AD, Anderson EC, Swain JR, Wong MH. Characterization of the Intestinal Cancer Stem Cell Marker, CD166/Activated Leukocyte Cell Adhesion Molecule, in the Human and Mouse Gastrointestinal Tract. Gastroenterol. 2010;139:2072–2082. doi: 10.1053/j.gastro.2010.08.053. [DOI] [PMC free article] [PubMed] [Google Scholar]
- Lin SA, Barker N. Gastrointestinal stem cells in self-renewal and cancer. J Gastroenterol. 2011;46:1039–55. doi: 10.1007/s00535-011-0424-8. [DOI] [PubMed] [Google Scholar]
- Lopez-Garcia C, Klein AM, Simons BD, Winton DJ. Intestinal stem cell replacement follows a pattern of neutral drift. Science. 2010;330:822–5. doi: 10.1126/science.1196236. [DOI] [PubMed] [Google Scholar]
- Lund PK. Fixing the breaks in intestinal stem cells after radiation: a matter of DNA damage and death or DNA repair and regeneration. Gastroenterol. 2012;143:1144–7. doi: 10.1053/j.gastro.2012.09.021. [DOI] [PubMed] [Google Scholar]
- Montgomery RK, Carlone DL, Richmond CA, Farilla L, Kranendonk MEG, Henderson DE, Baffour-Awuah NY, Ambruzs DM, Fogli LK, Algra S, et al. Mouse telomerase reverse transcriptase (mTert) expression marks slowly cycling intestinal stem cells. Proc Natl Acad Sci USA. 2011;108:179–184. doi: 10.1073/pnas.1013004108. [DOI] [PMC free article] [PubMed] [Google Scholar]
- Munoz J, Stange DE, Schepers AG, van de Wetering M, Koo BK, Itzkovitz S, Volckmann R, Kung KS, Koster J, Radulescu S, et al. The Lgr5 intestinal stem cell signature: robust expression of proposed quiescent ‘+4’ cell markers. EMBO J. 2012;31:3079–91. doi: 10.1038/emboj.2012.166. [DOI] [PMC free article] [PubMed] [Google Scholar]
- Noah TK, Donahue B, Shroyer NF. Intestinal development and differentiation. Exp Cell Res. 2011;317:2702–10. doi: 10.1016/j.yexcr.2011.09.006. [DOI] [PMC free article] [PubMed] [Google Scholar]
- Petriz J. Flow cytometry of the side population (SP) Curr Protoc Cytom. 2007;Chapter 9(Unit9):23. doi: 10.1002/0471142956.cy0923s39. [DOI] [PubMed] [Google Scholar]
- Potten CS. Stem cells in gastrointestinal epithelium: numbers, characteristics and death. PhilosTransRSocLond B BiolSci. 1998;353:821–830. doi: 10.1098/rstb.1998.0246. [DOI] [PMC free article] [PubMed] [Google Scholar]
- Potten CS, Owen G, Booth D. Intestinal stem cells protect their genome by selective segregation of template DNA strands. J Cell Sci. 2002;115:2381–2388. doi: 10.1242/jcs.115.11.2381. [DOI] [PubMed] [Google Scholar]
- Powell AE, Wang Y, Li Y, Poulin EJ, Means AL, Washington MK, Higginbotham JN, Juchheim A, Prasad N, Levy SE, et al. The pan-ErbB negative regulator Lrig1 is an intestinal stem cell marker that functions as a tumor suppressor. Cell. 2012;149:146–58. doi: 10.1016/j.cell.2012.02.042. [DOI] [PMC free article] [PubMed] [Google Scholar]
- Roth S, Franken P, Sacchetti A, Kremer A, Anderson K, Sansom O, Fodde R. Paneth cells in intestinal homeostasis and tissue injury. PLoS One. 2012;7:e38965. doi: 10.1371/journal.pone.0038965. [DOI] [PMC free article] [PubMed] [Google Scholar]
- Ruffner H, Sprunger J, Charlat O, Leighton-Davies J, Grosshans B, Salathe A, Zietzling S, Beck V, Therier M, Isken A, et al. R-Spondin potentiates Wnt/beta-catenin signaling through orphan receptors LGR4 and LGR5. PLoS One. 2012;7:e40976. doi: 10.1371/journal.pone.0040976. [DOI] [PMC free article] [PubMed] [Google Scholar]
- Sangiorgi E, Capecchi MR. Bmi1 is expressed in vivo in intestinal stem cells. Nat Genet. 2008;40:915–920. doi: 10.1038/ng.165. [DOI] [PMC free article] [PubMed] [Google Scholar]
- Sato T, Vries RG, Snippert HJ, van de WM, Barker N, Stange DE, van Es JH, Abo A, Kujala P, Peters PJ, et al. Single Lgr5 stem cells build crypt-villus structures in vitro without a mesenchymal niche. Nature. 2009;459:262–265. doi: 10.1038/nature07935. [DOI] [PubMed] [Google Scholar]
- Sei Y, Lu X, Liou A, Zhao X, Wank SA. A stem cell marker-expressing subset of enteroendocrine cells resides at the crypt base in the small intestine. Am J Physiol Gastrointest Liver Physiol. 2011;300:G345–56. doi: 10.1152/ajpgi.00278.2010. [DOI] [PMC free article] [PubMed] [Google Scholar]
- Stahlberg A, Andersson D, Aurelius J, Faiz M, Pekna M, Kubista M, Pekny M. Defining cell populations with single-cell gene expression profiling: correlations and identification of astrocyte subpopulations. Nucleic Acids Res. 2011;39:e24. doi: 10.1093/nar/gkq1182. [DOI] [PMC free article] [PubMed] [Google Scholar]
- Stelzner M, Helmrath M, Dunn JCY, Henning SJ, Houchen CW, Kuo C, Lynch J, Li L, Magness ST, Martin MG, et al. A nomenclature for intestinal in vitro cultures. Am J Physiol Gastrointest Liver Physiol. 2012;302:1359–1363. doi: 10.1152/ajpgi.00493.2011. [DOI] [PMC free article] [PubMed] [Google Scholar]
- Takeda N, Jain R, LeBoeuf MR, Wang QH, Lu MM, Epstein JA. Interconversion Between Intestinal Stem Cell Populations in Distinct Niches. Science. 2011;334:1420–1424. doi: 10.1126/science.1213214. [DOI] [PMC free article] [PubMed] [Google Scholar]
- Telford WG, Bradford J, Godfrey W, Robey RW, Bates SE. Side population analysis using a violet-excited cell-permeable DNA binding dye. Stem Cells. 2007;25:1029–36. doi: 10.1634/stemcells.2006-0567. [DOI] [PubMed] [Google Scholar]
- Tian H, Biehs B, Warming S, Leong KG, Rangell L, Klein OD, de Sauvage FJ. A reserve stem cell population in small intestine renders Lgr5-positive cells dispensable. Nature. 2011;478:255–259. doi: 10.1038/nature10408. [DOI] [PMC free article] [PubMed] [Google Scholar]
- Van der Flier LG, Haegebarth A, Stange DE, van de WM, Clevers H. OLFM4 is a robust marker for stem cells in human intestine and marks a subset of colorectal cancer cells. Gastroenterol. 2009a;137:15–17. doi: 10.1053/j.gastro.2009.05.035. [DOI] [PubMed] [Google Scholar]
- Van der Flier LG, Van Gijn ME, Hatzis P, Kujala P, Haegebarth A, Stange DE, Begthel H, van den BM, Guryev V, Oving I, et al. Transcription factor achaete scute-like 2 controls intestinal stem cell fate. Cell. 2009b;136:903–912. doi: 10.1016/j.cell.2009.01.031. [DOI] [PubMed] [Google Scholar]
- van Es JH, Sato T, van de Wetering M, Lyubimova A, Nee AN, Gregorieff A, Sasaki N, Zeinstra L, van den Born M, Korving J, et al. Dll1+ secretory progenitor cells revert to stem cells upon crypt damage. Nat Cell Biol. 2012;14:1099–104. doi: 10.1038/ncb2581. [DOI] [PMC free article] [PubMed] [Google Scholar]
- Van Landeghem L, Santoro MA, Krebs AE, Mah AT, Dehmer JJ, Gracz AD, Scull BP, McNaughton K, Magness ST, Lund PK. Activation of two distinct Sox9-EGFP-expressing intestinal stem cell populations during crypt regeneration after irradiation. Am J Physiol Gastrointest Liver Physiol. 2012;302:1111–1132. doi: 10.1152/ajpgi.00519.2011. [DOI] [PMC free article] [PubMed] [Google Scholar]
- von Furstenberg RJ, Gulati AS, Baxi A, Doherty JM, Stappenbeck TS, Gracz AD, Magness ST, Henning SJ. Sorting mouse jejunal epithelial cells with CD24 yields a population with characteristics of intestinal stem cells. AmJPhysiol Gastrointest Liver Physiol. 2011;300:G409–G417. doi: 10.1152/ajpgi.00453.2010. [DOI] [PMC free article] [PubMed] [Google Scholar]
- Wang F, Scoville D, He XC, Mahe MM, Box A, Perry JM, Smith NR, Lei NY, Davies PS, Fuller MK, et al. Isolation and characterization of intestinal stem cells based on surface marker combinations and colony-formation assay. Gastroenterol. 2013;145:383–395. e21. doi: 10.1053/j.gastro.2013.04.050. [DOI] [PMC free article] [PubMed] [Google Scholar]
- Wong VWY, Stange DE, Page ME, Buczacki S, Wabik A, Itami S, van de Wetering M, Poulsom R, Wright NA, Trotter MWB, et al. Lrig1 controls intestinal stem-cell homeostasis by negative regulation of ErbB signalling. Nat Cell Biol. 2012;14:401–408. doi: 10.1038/ncb2464. [DOI] [PMC free article] [PubMed] [Google Scholar]
- Yan KS, Chia LA, Li X, Ootani A, Su J, Lee JY, Su N, Luo Y, Heilshorn SC, Amieva MR, et al. The intestinal stem cell markers Bmi1 and Lgr5 identify two functionally distinct populations. Proc Natl Acad Sci U S A. 2012;109:466–71. doi: 10.1073/pnas.1118857109. [DOI] [PMC free article] [PubMed] [Google Scholar]
- Zhou S, Morris JJ, Barnes Y, Lan L, Schuetz JD, Sorrentino BP. Bcrp1 gene expression is required for normal numbers of side population stem cells in mice, and confers relative protection to mitoxantrone in hematopoietic cells in vivo. Proc Natl Acad Sci U S A. 2002;99:12339–44. doi: 10.1073/pnas.192276999. [DOI] [PMC free article] [PubMed] [Google Scholar]
Associated Data
This section collects any data citations, data availability statements, or supplementary materials included in this article.
Supplementary Materials
Supplemental Fig 1. Validation of synaptophysin antibody against intestinal epithelial cells from PYY-GFP mice. Cells were labeled with either (A) isotype or (B) synaptophysin antibody. (B) 93.5 ± 1.5% PYY-GFP cells were synaptophysin positive, n = 4.