Abstract
Many structures of the mammalian CNS generate propagating waves of electrical activity early in development. These waves are essential to CNS development, mediating a variety of developmental processes, such as axonal outgrowth and pathfinding, synaptogenesis, and the maturation of ion channel and receptor properties. In the mouse cerebral cortex, waves of activity occur between embryonic day 18 and postnatal day 8 and originate in pacemaker circuits in the septal nucleus and the piriform cortex. Here we show that genetic knock-out of the major synthetic enzyme for GABA, GAD67, selectively eliminates the picrotoxin-sensitive fraction of these waves. The waves that remain in the GAD67 knock-out have a much higher probability of propagating into the dorsal neocortex, as do the picrotoxin-resistant fraction of waves in controls. Field potential recordings at the point of wave initiation reveal different electrical signatures for GABAergic and glutamatergic waves. These data indicate that: (1) there are separate GABAergic and glutamatergic pacemaker circuits within the piriform cortex, each of which can initiate waves of activity; (2) the glutamatergic pacemaker initiates waves that preferentially propagate into the neocortex; and (3) the initial appearance of the glutamatergic pacemaker does not require preceding GABAergic waves. In the absence of GAD67, the electrical activity underlying glutamatergic waves shows greatly increased tendency to burst, indicating that GABAergic inputs inhibit the glutamatergic pacemaker, even at stages when GABAergic pacemaker circuitry can itself initiate waves.
Keywords: activity-dependent development, GABA, pacemaker, piriform cortex, spontaneous activity
Introduction
Waves of spontaneous electrical activity and associated increases in cellular calcium levels propagate across many structures of the mammalian CNS during early development and are necessary for developmental processes including neuronal differentiation and the refinement of synaptic connections (Moody and Bosma, 2005; Blankenship and Feller, 2010). In many cases, these waves are initiated by specific pacemaker circuits that, depending on the structure, are composed of GABAergic, glutamatergic, serotonergic, or cholinergic neurons (Wong et al., 2000; Hunt et al., 2006; Zheng et al., 2006; Lischalk et al., 2009; Conhaim et al., 2011). In any given structure, complex interactions among the component pacemaker circuits make it difficult to unravel the contributions of each transmitter system to wave initiation. For example, the identity of the initiating circuit may change during development, and homeostatic mechanisms may upregulate one component of the pacemaker when another is blocked (Chub and O'Donovan, 1998; Wong et al., 2000; Conhaim et al., 2011).
In the mouse cerebral cortex, spontaneous waves occur in the early postnatal period and are initiated by pacemaker circuits within the piriform cortex and septal nucleus (Garaschuk et al., 2000; Corlew et al., 2004; Conhaim et al., 2010). These waves are sensitive to blockers of GABAA and AMPA receptors, but the exact roles of these two transmitter systems in wave initiation remain unresolved (Conhaim et al., 2011). Because many activity-dependent developmental processes rely on information contained in wave frequencies and propagation patterns, understanding the mechanisms that initiate waves and regulate these parameters is critical.
In this study, we eliminate GABAergic transmission by knock-out (KO) of the 67 kDA glutamic acid decarboxylase enzyme (GAD67), which accounts for ≥90% of the brain's production of GABA (Asada et al., 1997; Tamamaki et al., 2003). From analysis of wave activity in brain slices from KO and control animals recorded with calcium imaging and microfluidic-based extracellular arrays, we provide evidence that two semi-independent initiation circuits drive spontaneous waves in the developing cortex. One of these pacemakers uses GABA excitation, resides in the septal nucleus and the piriform cortex, and initiates waves that have a low probability of propagating into the neocortex. The other pacemaker uses glutamatergic circuitry, resides primarily in the piriform cortex, and preferentially initiates waves that invade the neocortex. The selective developmental sparing of the glutamatergic pacemaker in the chronic absence of the GABAergic system indicates that the emergence of the glutamatergic pacemaker does not require GABAergic waves and that glutamatergic waves do not increase their frequency to compensate for the absence of the GABAergic waves.
The structures that contain these two pacemakers (the septal nucleus and the piriform cortex) develop earlier than the neocortex and have extensive connections with it. The existence of two wave initiation systems within these structures may allow spontaneous waves of activity to enter the neocortex before it is developmentally mature enough to initiate them. The sequential participation of both GABAergic and glutamatergic neurons in wave initiation may provide timing cues for the coordinated maturation of the inhibitory and excitatory circuitry of the cortex.
Materials and Methods
Animal procedures.
Time-mated females carrying E17 fetuses were killed with carbon dioxide, and the fetuses were removed and placed on ice. Brains were removed from the fetuses and sliced 300 μm thick in ice-cold ACSF using a Leica VT1200S vibrating microtome. All animal procedures were approved by the Institutional Animal Care and Use Committee at the University of Washington.
Generation of GAD67 KO mice.
We used a GAD67-GFP knock-in line (Tamamaki et al., 2003) as the basis for eliminating GAD67 genetically. GAD67-GFP homozygous KO embryos (GAD67 KO) were obtained by crossing males and females both heterozygous for GAD67-GFP. Homozygous embryos were identified by first visually identifying embryos with GFP expression and then selecting the subset of those embryos that also expressed cleft palate, a marker for GAD67 KO (Asada et al., 1997). The classification of embryos was confirmed by PCR. GAD67-GFP heterozygotes were used as controls and were obtained by crossing CD1-WT females with GAD67-GFP heterozygous male breeders. GAD67-GFP heterozygous embryos were identified by GFP expression.
Slice cultures.
Coronal slices were taken from E17 fetuses at a position anterior to the hippocampus and posterior to the olfactory bulbs, where the lateral ventricles were clearly visible. Slices were interface-cultured on Millicell 0.4 μm, 30 mm culture inserts (Millipore) in medium composed of 75% sterile Neurobasal-A Medium (1×) (Invitrogen), 25% horse serum (Sigma), penicillin (100 IU/ml), streptomycin (0.1 mg/ml), and 2 mm l-glutamine (HyClone Laboratories). Although penicillin is a known epileptogenic agent in slices, the concentrations used in that context are 3- to 20-fold higher than in our culture medium (Schneiderman, 1986). In addition, we find similar activity in acute slices that have never been exposed to penicillin. Slices were cultured for 2–5 d and then removed from the incubator and placed into ACSF for physiological recordings. Thus, when we refer in this paper to experiments conducted at P0, we reference slices that are E17 + 2 DIV. Our previous work has shown that these cultured slices show normal development of ion channel properties and spontaneous activity compared with acute slices (Picken-Bahrey et al., 2003; McCabe et al., 2006, 2007). In addition, during this period in culture, GFP-labeled interneurons migrate into the dorsal neocortex at approximately the same rate as in vivo (unpublished data). Because the GAD67 KO mutation used in this study is neonatal lethal (because cleft palate prevents suckling), using cultured slices is the only way we can study the effects of this mutation on spontaneous waves at postnatal stages.
Solutions.
ACSF contained (mm) the following: 140 NaCl, 3 KCl, 2 MgCl2, 2 CaCl2, 1.25 NaHPO4, 26.5 NaHCO3, and 20 d-glucose. Picrotoxin and CNQX (Tocris Bioscience) were used at 10 and 25 μm, respectively, in ACSF.
Calcium imaging.
Cultured brain slices were removed from the incubator and held in oxygenated ACSF at 28°C for 1–2 h. Slices were then immersed in oxygenated ACSF containing the [Ca2+]i-indicating dye Rhod3 (30 μm) and 0.07% Pluronic F-127 (Invitrogen) for 45–50 min, rinsed, and placed into a glass-bottomed experimental chamber. Rhod3 was used to avoid wavelength overlap with the GFP signal in GABAergic neurons. Oxygenated ACSF (31°C-33°C) was superfused continuously during experiments. Fluorescence images were captured at 1 Hz with either a QuantEM512SC camera (Photometrics) mounted on a Nikon AZ100 microscope, or an OrcaFlash 2.1 camera mounted on an Olympus MVX10 inverted microscope. For experiments where imaging was conducted simultaneously with electrical recordings, an OrcaFlash 2.1 camera was used on an inverted Olympus IX71 inverted microscope. Images were recorded using NIS Elements AR software (Nikon).
Extracellular field potential recordings.
Electrical recordings were performed using custom 12-channel, transparent polydimethylsiloxane microfluidic multielectrode arrays (Scott et al., 2013). The microfluidic multielectrode array consists of an array of 12 recording apertures, each 50 μm in diameter, connected to ACSF-filled microfluidic channels leading to Ag/AgCl electrodes that are connected to differential amplifiers (AM Systems; Model 1700). An Ag/AgCl electrode inserted in the bath downstream of the slice serves as a reference electrode. Extracellular electrical signals are digitized (Axon; Digidata 1440) and recorded using pCLAMP 10 software (Molecular Devices) in continuous mode at an acquisition frequency of 10 kHz. In some experiments, we took advantage of the optical transparency of these arrays to perform simultaneous extracellular recording and calcium imaging of wave propagation.
Data analysis.
For imaging experiments, Rhod3 fluorescence images of entire brain slices were captured at 1 Hz. Analysis of these image stacks was performed using custom MATLAB (MathWorks) routines. To create summary plots, such as those shown in Figure 2D, ROIs were placed over the septal nucleus, the piriform cortex, and the neocortex and mean (ΔF/F0) signals calculated for each ROI over the entire time course of the image stack. Events were threshold detected at 3 SDs above mean baseline, and frequency of events tabulated for each ROI. To create pseudocolored images of spontaneous waves (see Fig. 1C,D and Movies 1 and 2), fluorescence images were converted to ΔF/F0 images by subtracting an initial image of Rhod3 fluorescence from each subsequent image in the time series and then dividing each image by the same initial image. The ΔF/F0 record was then thresholded (by zeroing pixel values below a criteria of 3–5% ΔF/F), pseudocolored, and superimposed onto grayscale images of the slice. For each frame, the pixels of the slice image were blanked under the fluorescence signal to preserve the magnitude of the ΔF/F0 signal for the events. These images allowed wave propagation to be correlated with slice anatomy. For electrical experiments, custom MATLAB routines were used to detect and analyze local field potentials (LFPs) and to record their times of occurrence. An 80 Hz lowpass filter was applied to LFP data, and then the signal amplitude was determined by finding the difference between the maximum and minimum signal during the event. The duration of each event was defined as the time over which the amplitude of the signal was >20 times the SD of the noise floor. The power was calculated by integrating the power spectral density of the signal from zero to 80 Hz. Properties of the LFP were first averaged over the five dorsal- or ventral-most recording apertures for each wave, depending on which region was being examined. N values reflect the number of such averages that were included in the analysis.
Figure 2.
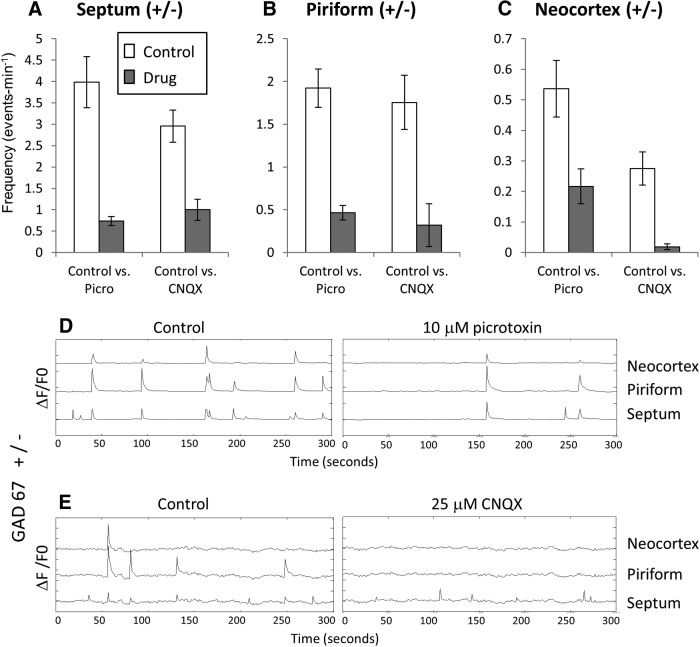
Sensitivity of waves in heterozygote control slices to picrotoxin and CNQX. A–C, Mean wave frequencies in control, picrotoxin, and CNQX measured in the septal nucleus (A), piriform cortex (B), and neocortex (C). Activity in all regions is sensitive to both drugs, but activity in the neocortex is much more sensitive to CNQX than to picrotoxin, suggesting that waves initiated by glutamatergic circuitry are more likely to propagate dorsally than those initiated GABAergically. D, E, Sample fluorescence records in the three regions showing effects of picrotoxin and CNQX. y-axis tick marks indicate 10% ΔF/F0.
Figure 1.
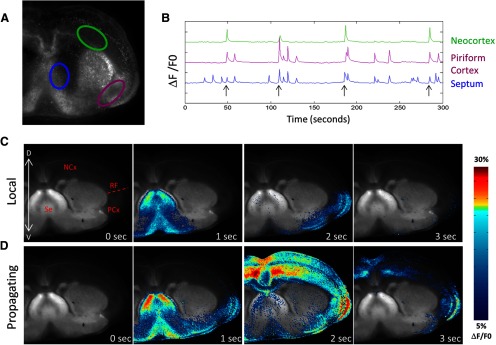
Local and propagating spontaneous waves in mouse cortex. A, Rhod 3 fluorescence image of a coronal slice of mouse brain at P0. ROIs are indicated in the septal nucleus (blue), the piriform cortex (purple), and the neocortex (green). B, Calcium records of mean fluorescence (ΔF/F0) in each ROI showing both local and propagating waves. Propagating waves are indicated by arrows and can be distinguished from local waves by the presence of signal in the neocortex. y-axis tick marks indicate 10% ΔF/F0. C, Montage of images taken during a local wave. This wave initiates in the septal nucleus and enters the piriform cortex but does not propagate dorsally into the neocortex. Structures labeled in the first frame: NCx, Neocortex; RF, rhinal fissure; PCx, piriform cortex; Se, septal nuclei. D, Montage of images taken during a wave that propagates into the neocortex and, in this case, crosses the midline into the contralateral neocortex. C, D, Images were created by thresholding the calcium signal, applying to it a color map, and then superimposing the colored ΔF/F0 signal onto a grayscale image showing GFP distribution in the slice. See Materials and Methods.
Results
Calcium imaging reveals two forms of activity in coronal slices of mouse forebrain
In previous experiments, we showed, that throughout the period of their occurrence (E18-P8), spontaneous waves of activity in the mouse cortex initiated either in the septal nucleus of the thalamus or in the piriform cortex (Conhaim et al., 2010). From those initiation points, waves either propagated to the rhinal fissure and stopped (“local waves”) or crossed the rhinal fissure into the neocortex (“propagating waves”) (for locations of these structures in the coronal slices, see Fig. 1C). The fraction of propagating waves increased steadily during development, paralleled by an increase in the sensitivity of waves to the glutamate AMPA receptor blocker CNQX, and a decrease in their sensitivity to the GABAA receptor blocker picrotoxin (Conhaim et al., 2011). These data suggested the hypothesis that local waves at early stages were initiated by a GABAergic pacemaker, whereas propagating waves at later stages were initiated by a glutamatergic pacemaker but did not prove that there were two separate pacemakers. In the present experiments, we eliminated GABAergic transmission genetically by knocking out the major synthetic enzyme for GABA, GAD67, to test the two-pacemaker hypothesis. We used slices from CD1 mice heterozygous for the GAD67 mutation (GAD67+/−) as controls because the KO of GAD67 is achieved by GFP knock-in and we wanted to maintain constant imaging conditions between control and experimental groups. Activity was imaged with the calcium indicator dye Rhod 3 to avoid overlap of standard green calcium indicator dyes with GFP expression.
To confirm that spontaneous wave activity was similar in the CD1 genetic background to that recorded in our previous experiments in Swiss-Webster mice, we measured waves in E17 + 2–3 DIV (P0-P1) GAD67+/− slices by drawing ROIs in three areas: the septum, piriform cortex, and neocortex (Fig. 1A,C). In the 46 hemispheres that were imaged, waves in heterozygous animals resembled those recorded in previous experiments from Swiss-Webster wild-type animals (Conhaim et al., 2011), with the highest frequencies of activity observed in the septum and piriform cortex (3.37 ± 0.30 and 1.87 ± 0.14 events per minute, respectively; mean ± SEM) and lower frequencies observed in the neocortex (0.39 ± 0.04 events per minute). Examples of waves recorded in the three regions and a montage of local and propagating waves are shown in Figure 1B–D.
To test for GABA and glutamate involvement in generating wave activity, we applied picrotoxin and CNQX, respectively, to control slices. Both drugs reduced wave frequency substantially in the septum and piriform cortex, the two putative pacemaker regions (Fig. 2A,B). In agreement with previous results on Swiss-Webster mice, CNQX exerted a much more powerful block of fully propagating waves (96.7 ± 3.3%; p = 0.001) than did picrotoxin (64.6 ± 7.6%; p = 0.01), as measured by its effect on neocortical activity (Fig. 2C). The difference between the block exerted by the two drugs was significant (p = 0.003). Figure 2 D, E shows records of the effects of picrotoxin and CNQX on waves in the septum, piriform cortex, and neocortex. The combination of the two drugs eliminated all waves in all slices. These data indicate that both GABAergic and glutamatergic neurons are involved in initiating spontaneous waves and that glutamatergic transmission is preferentially involved in propagation of waves into the dorsal neocortex.
Genetic KO of GAD67 eliminates GABAergic waves but spares glutamatergic waves
We next tested the hypothesis that separate GABAergic and glutamatergic pacemaker circuits exist in the septum and piriform cortex, each capable of generating waves. To do this, we compared wave properties in slices from KO mice homozygous for the GAD67 mutation (GAD67 KO) to wave properties in control slices (GAD67+/−). We predicted that waves in KO slices would show a reduction in the frequency of activity in the septal and piriform regions compared with controls, similar to the reduction seen when control slices were treated with picrotoxin. That is, GAD67 KO should eliminate the picrotoxin-sensitive fraction of waves. Additionally, we predicted that in KO slices the frequency of dorsally propagating waves would be minimally reduced versus controls, given their relatively lesser sensitivity to picrotoxin than to CNQX (Fig. 2C).
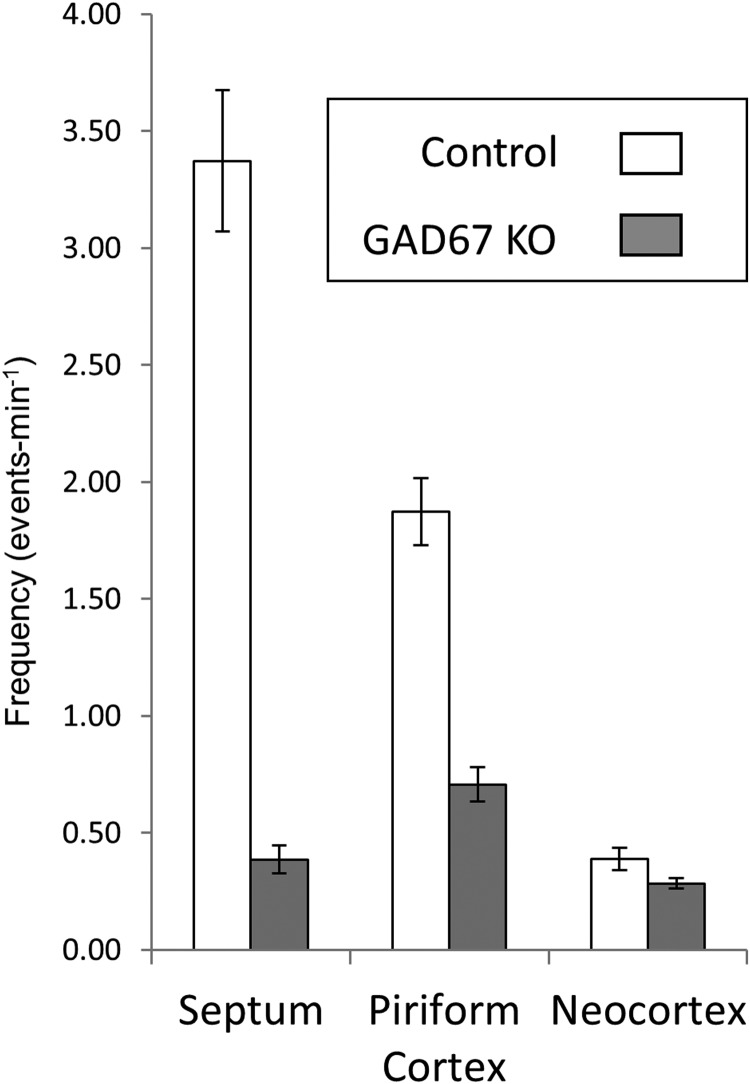
The data in Figure 3 show that these predictions were correct. Wave frequencies in the septum and piriform regions were reduced in GAD67 KO slices by amounts not significantly different from those observed in control slices when picrotoxin was applied (Fig. 2). Waves in the septum were reduced in the GAD67 KO by 88.6 ± 10.6% compared with 81.6 ± 2.0% by picrotoxin (p = 0.33, GAD67 KO vs picrotoxin). In the piriform region, waves were reduced in the GAD67 KO by 62.2 ± 13.2% compared with 79.3 ± 3% by picrotoxin (p = 0.22). The frequency of fully propagating waves, as measured in the neocortex, was affected somewhat less by GAD67 KO, with only a 26.9 ± 3.2% reduction in activity versus the 59.6 ± 6.6% reduction seen in picrotoxin experiments (p = 0.004). This difference might reflect a contribution of GABA synthetic pathways not dependent on GAD67 in the neocortex at these stages, the block of GABA action on GABAB receptors by GAD67 KO but not picrotoxin, or actions of picrotoxin not related to GABAA receptor block. Movie 1 shows waves in control and KO slices, illustrating the preferential sparing of fully propagating waves in KO slices.
Figure 3.
Effects of GAD67 KO on wave frequency and propagation. Wave frequencies in heterozygote control slices and GAD67 KO slices in septum, piriform cortex, and neocortex. The effects of GAD67 KO are similar to the effects of picrotoxin, showing substantial block of activity in septum and piriform cortex, but minimal effect in the neocortex.
Preferential block of local waves by GAD 67 KO. Films of activity in a heterozygote control and GAD67 KO slice. The control slice shows both local and propagating waves, whereas the KO slice shows only fully propagating waves. Both slices are taken from the same rostral–caudal level. Fluorescence scale is ΔF/F0.
These data indicate that two separate wave-initiating circuits exist in the septum and piriform cortex, each of which can initiate waves without the direct participation of the other and that the glutamatergic circuit preferentially initiates waves that propagate across the rhinal fissure into the neocortex.
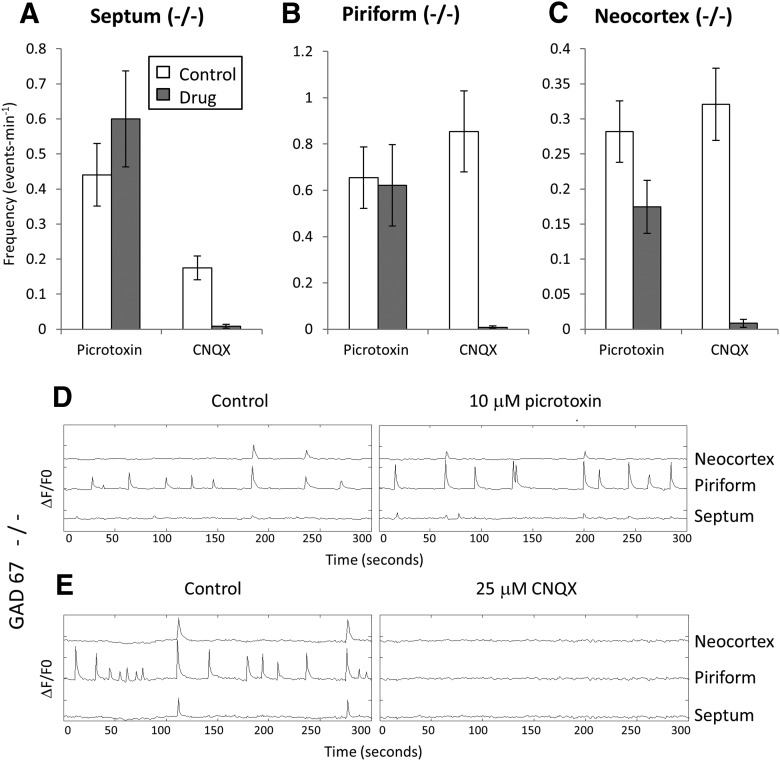
If this conclusion is correct and GAD67 KO selectively eliminates GABAergic waves, then the waves remaining in the GAD67 KO slices should be completely blocked by CNQX and show minimal sensitivity to picrotoxin. The data in Figure 4 show that this is the case. Picrotoxin had no significant effect on wave frequency in the septal and piriform regions (p = 0.26 and p = 0.86 for septum and piriform data, respectively; n = 16 for both), whereas CNQX blocked septal activity by 94.4 ± 3.7%, piriform activity by 97.6 ± 1.8%, and neocortical activity by 95 ± 2.3% (Fig. 4A–E; mean ± SEM; n = 12 and p < 0.001 for all). Picrotoxin did reduce the frequency of fully propagating waves (Fig. 4C) somewhat (by 39 ± 9% of control; mean ± SEM, n = 16; p = 0.001), suggesting that in the neocortex there might be residual GABA signaling via production of GABA from the 65 kDA GAD isoform. Figure 4D, E shows records of wave activity in the three regions in GAD67 KO slices exposed to picrotoxin and CNQX.
Figure 4.
Elimination of picrotoxin sensitivity in GAD67 KO slices. A–C, Mean wave frequencies in control, picrotoxin, and CNQX measured in the septal nucleus (A), piriform cortex (B), and neocortex (C) of GAD67 KO slices. In contrast to control slices (Fig. 2), activity in KO slices shows minimal picrotoxin sensitivity, and is completely blocked by CNQX. The small degree of block of neocortical activity by picrotoxin may reflect a synthetic pathway for GABA in that region that does not depend on GAD67. D, E, Sample records showing lack of picrotoxin sensitivity and block by CNQX of waves in GAD67 KO slices. y-axis tick marks are 10% ΔF/F0.
The development of glutamatergic waves does not require GABAergic activity
At the earliest stages of wave occurrence (E17-E18), waves are almost exclusively GABAergic (Conhaim et al., 2011). The fact that the glutamatergic pacemaker appears later but in the same piriform location as the GABAergic activity suggests the hypothesis that the glutamatergic pacemaker develops as a result of preceding GABAergic wave activity. This could occur, for example, if GABA-driven synchronous activity in piriform glutamatergic neurons strengthened synthases within the glutamatergic circuitry using coincidence-detection mechanisms (Kasyanov et al., 2004; Voigt et al., 2005). Chronic elimination of GABAergic waves with GAD67 KO leaves intact a frequency of glutamatergic waves that is similar to what is observed in control slices treated acutely with picrotoxin (compare Figs. 2 and 3), arguing against an absolute dependence of the appearance of the glutamatergic pacemaker on preceding GABAergic waves.
These data also indicate that there is little compensatory increase in the output of the glutamatergic pacemaker as a result of the absence of GABAergic waves, as might be predicted from similar homeostatic changes in circuitry mediating other forms of spontaneous activity in the developing CNS (Chub and O'Donovan, 1998). That is, in a developmental context, the two pacemakers appear to operate independently of one another.
Different electrical signatures of the two pacemakers
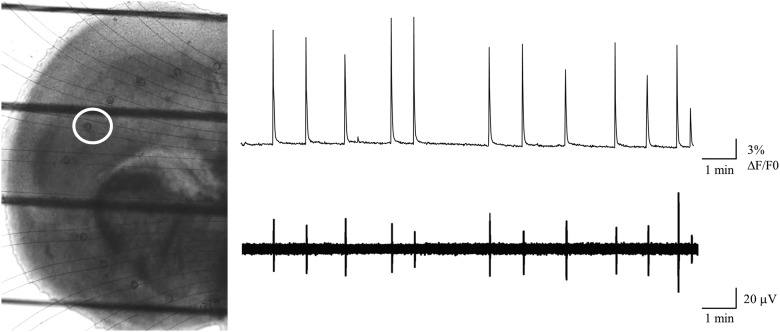
If there are two semi-independent pacemaker circuits within the piriform cortex, then GABAergic and glutamatergic waves might show different electrophysiological signatures at the site of initiation. To test this hypothesis, we made multisite LFP recordings using a newly developed microfluidic recording array (Scott et al., 2013). This array uses 50 μm fluid-filled recording apertures fabricated into a polydimethylsiloxane substrate, 3D printed onto a glass coverslip, and placed in an arc along the ventral–dorsal path of wave propagation. The apertures are connected via larger fluid-filled channels to remote electrical contacts, resulting in an optically transparent recording array that permits simultaneous calcium imaging to confirm the correspondence of the electrical and calcium signatures of the waves. LFPs show close correlation with calcium waves detected optically (Fig. 5), and the ventral–dorsal propagation direction seen in imaging experiments is reflected in the progressive delay in the field potential onset at more dorsal recording apertures (Movie 2). Movie 2 illustrates simultaneous electrical and optical recording of waves from a coronal slice using this array.
Figure 5.
Simultaneous calcium imaging and extracellular array recording of waves using a microfluidic electrode array. Left, Visible light image of an E17 + 2 DIV (P0) coronal slice placed on the microfluidic recording array. The dark horizontal lines indicate the strings of the harp used to stabilize the slice. The faint curved lines indicate the microfluidic channels connecting the recording apertures to the amplifier connections. The white circle surrounds the aperture from which the electrical recordings illustrated were taken, and was used as the ROI for the calcium imaging record. Right, top, Mean Rhod3 fluorescence from the region indicated. Right, bottom, LFPs recorded at the same time as the Rhod3 fluorescence, from the aperture inside the red region. The 1:1 correspondence between electrical and optical measurements of wave activity.
Simultaneous recording of a propagating wave using Ca2+ imaging (left) and the microfluidic extracellular array (right). The 12 recording apertures are placed along the path of wave propagation with apertues 8–12 in the piriform initiation region. Aperture positions are indicated by small numbered circles on the slice image and by numbers to the right of the electrical recordings. The Ca2+ signal lags behind the electrical recording and lasts longer. The electrical recordings show a clear delay between ventral piriform and dorsal neocortical sites and indicate the speed of wave propagation. In local waves, the field potential signals at the dorsal sites would be absent. Fluorescence scale is ΔF/F0.
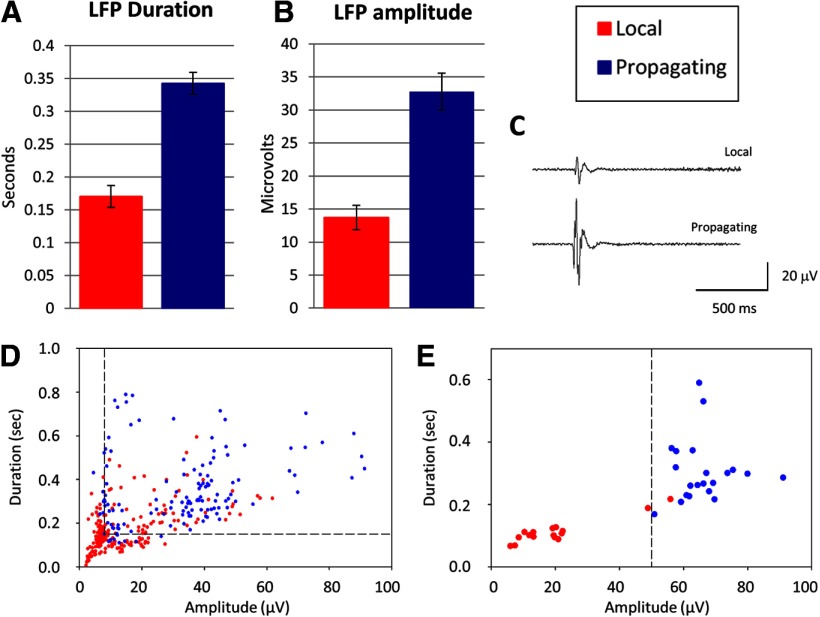
To test the hypothesis that GABAergic and glutamatergic pacemakers could be distinguished by their electrical signals at the site of wave initiation, we recorded 218 local and 132 propagating waves from seven control slices and sorted the LFPs at the ventral, piriform wave initiation site into those that initiated local versus propagating waves. Analysis of these signals showed that, on average, LFPs at the site of wave initiation were longer in duration and larger in amplitude for propagating waves than for local waves (duration: 343 ± 17 ms vs 170 ± 9.7 ms; p = 6.13E-17; amplitude: 32.78 ± 1.76 μV vs 13.70 ± 0.79 μV, p = 9E-19) (Fig. 6A–C). A scatter plot of LFP duration versus amplitude for all slices (Fig. 6D) shows that, even with between-slice variability in overall event amplitudes and durations, local versus propagating waves can be distinguished with reasonable accuracy from the properties of their field potentials at the point of origin in the piriform cortex. For example, for the data in Figure 6D, 70% of LFPs (red symbols) were <8 μV in amplitude or <0.15 s in duration, whereas 87% of propagating wave LFPs fell outside of these ranges (dashed lines). Within single slices, the accuracy in predicting whether a wave propagates or not based on piriform LFP amplitude and duration was even higher. For the slice shown in Figure 6E, a simple amplitude criterion of 51 μV predicted 100% of propagating waves (red symbols) and 94% of local waves. These results are consistent with the idea that two different initiation circuits exist within the pacemaker region for local and propagating waves and that the glutamatergic network in the piriform cortex must be recruited into waves in order for them to propagate into the neocortex.
Figure 6.
Local and propagating waves can be distinguished by their LFPs at the site of initiation in the piriform cortex. A, B, LFPs in the piriform cortex are larger in amplitude and longer in duration for waves that propagate into the dorsal neocortex. C, Examples of LFPs for local and propagating waves. D, Scatter plot of LFP duration versus amplitude for all slices show clustering of LFPs for local versus propagating waves. Dashed lines indicate criterion values giving maximal separation of the waveforms (see Results). E, In individual slices, where there is less variation in overall mean LFP amplitude, clustering of local and propagating wave LFPs is more prominent. Dashed line indicates amplitude criterion that separates 100% of propagating wave LFPs and 94% of local wave LFPs (see Results).
Interactions between GABAergic and glutamatergic initiation circuits
We next asked whether the GABAergic and glutamatergic circuits involved in wave initiation interacted with each other during wave propagation. The ability of GABA at these stages to initiate wave events ventrally indicates that GABA is excitatory, in the sense that VCl is positive to threshold and GABA can excite quiescent neurons (Owens et al., 1996). However the shunting effect of GABAA channels and the fact that VGABA is negative to VGlutamate raise the possibility that GABAergic action might also inhibit glutamatergic waves.
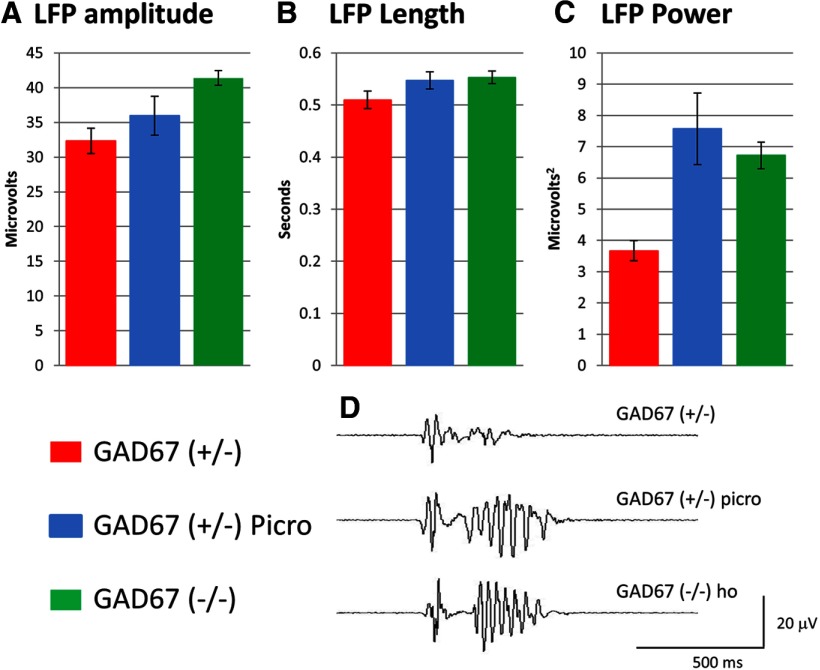
First, we asked whether dorsal LFPs during glutamatergic waves were different in control and GAD67 KO slices. GAD67 KO increased the peak amplitude of the dorsally recorded LFP during glutamatergic waves (control: 32.32 ± 1.83 μV, n = 136 waves in 5 slices; KO: 41.4 ± 1.1 μV, n = 220 waves in 5 slices; p = 0.038) (Fig. 7A). GAD67 KO also caused the appearance of a pronounced 35 Hz oscillation at the end of the LFP, seen as a modest increase in signal duration (control: 510 ± 16 ms; KO: 553 ± 12 ms; p = 2.65E-05; same n values as amplitude) and a large increase the total power of the signal (control: 3.67 ± 0.32 μV2; KO: 6.72 ± 0.42 μV2; p = 2.15E-08) (Fig. 7B–D). Exposure of control slices to picrotoxin also caused the appearance of an ∼35 Hz oscillation in the latter phase of the LFP (Fig. 7D), which resulted in a significant increase in total power (7.57 ± 1.15 μV2, n = 186 waves in 4 slices; p = 0.001 vs control, 0.49 vs KO) (Fig. 7C). The changes in amplitude and duration of the LFP caused by picrotoxin appeared to be in the same direction as those caused by GAD67 KO but were not statistically significant. The increase in power is the result of the introduction of the 35 Hz oscillation onto the later half of the LFP, which causes the LFP to approach its maximum amplitude for a greater proportion of its duration, rather than having a single spike at the beginning of the LFP that sets peak amplitude, as seen in control traces. These data suggest that GABAergic transmission inhibits glutamatergic waves in the neocortex, possibly by a combination of reducing the number of neurons participating in the waves and reducing the number of action potentials generated by each neuron during a wave.
Figure 7.
Blocking GABA enhances the power of the LFP during neocortical glutamatergic waves. A–C, GAD67 KO increases the amplitude, duration, and total power of neocortical LFPs. Application of picrotoxin to control slices has similar, though not significant, effects on field potential amplitude and duration, and increases field potential power by the same amount as GAD67 KO (C). D, Sample records of dorsal LFPs in control, GAD67 KO, and control + picrotoxin slices showing late 35 Hz oscillation induced by GAD67 KO or picrotoxin. This indicates that GABA inhibits glutamatergic waves dorsally in the neocortex.
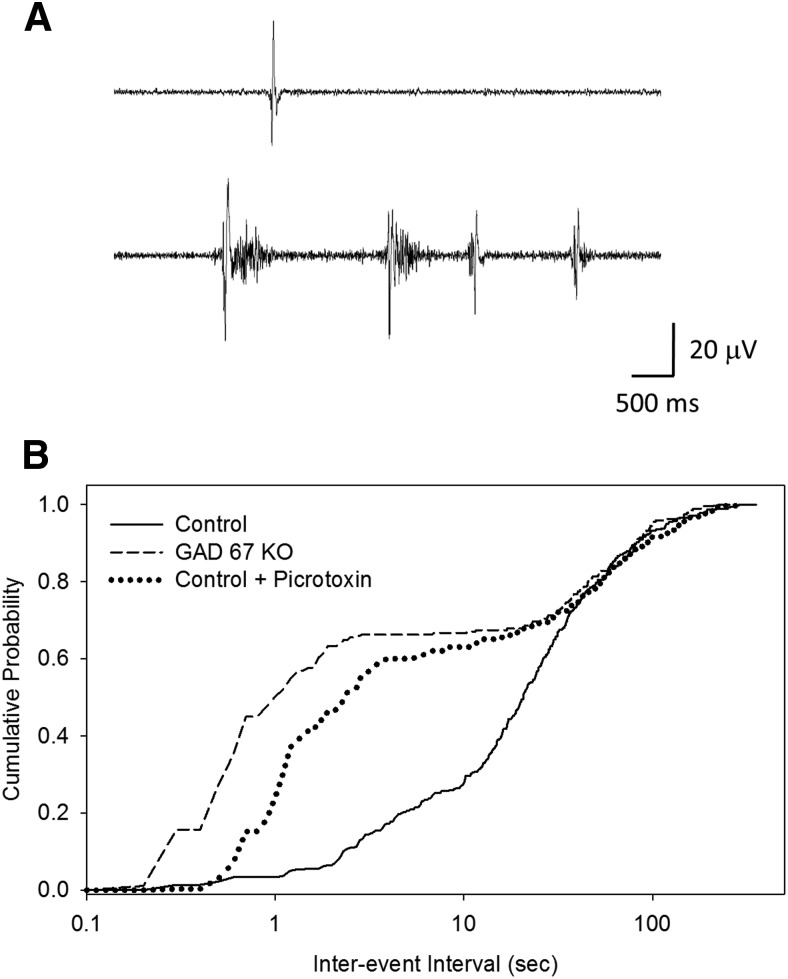
We next asked whether the initiation of glutamatergic waves in the piriform pacemaker was affected by the absence of GABAergic transmission. We showed above a close correspondence between LFPs recorded with our microfluidic array and waves recorded by calcium imaging. In GAD67 KO slices, however, the electrical burst structure underlying wave initiation in the piriform cortex is more complex than in controls. In KO slices, an LFP recorded in the piriform initiator region would often be followed very closely by other LFPs (Fig. 8A), with event intervals that were sometimes faster than the 1 Hz acquisition rate used for calcium imaging experiments. Thus, in the KO, a single event recorded with calcium imaging techniques might actually be composed of multiple electrical field potentials. In a few cases where electrical and imaging recordings were conducted simultaneously and images were acquired at 2 Hz, closely spaced LFPs were picked up in the calcium imaging record as a calcium transient with multiple peaks (data not shown). The same effect was seen in control slices exposed to picrotoxin (data not shown). To confirm increased tendency of field potentials underlying waves in the GAD67 KO slices to burst, we constructed cumulative probability plots of the intervals between LFPs for the piriform region in control, GAD67 KO, and control + picrotoxin slices (Fig. 8B). In control slices, this plot shows a single sigmoidal distribution with a mean interval reflecting the mean wave frequency of ∼2 events per minute recorded in imaging experiments (Fig. 3). In contrast, LFP intervals in the GAD67 KO slices showed a bimodal distribution reflecting the addition of a second population of short intervals corresponding to high-frequency bursts. For example, in the GAD67 KO slices, ∼50% of intervals were less than the 1 s interval used for image acquisition in calcium imaging experiments, whereas in control slices <2% fell into this category. Treatment of control slices with picrotoxin produced a similar change in the cumulative probability plots (Fig. 8B). These results indicate that, in the absence of GABAergic transmission, the glutamatergic pacemaker is more active electrically and operates in bursts of activity rather than single events.
Figure 8.
Interaction between GABAergic and glutamatergic pacemakers in the piriform cortex. A, GAD67 KO induces bursting of LFPs in the piriform cortex underlying single glutamatergic waves. LFP recordings corresponding to single waves are shown for control (top) and GAD67 KO slices (bottom). B, Cumulative probability plots of LFP intervals in control, GAD67 KO, and control + picrotoxin slices. Control slices show a single distribution of interevent intervals, whereas both GAD67 KO and picrotoxin slices show the appearance of a second, short-interval population corresponding to rapid bursts of events that give rise to single waves as detected by calcium imaging.
Thus, GABAergic neurons in both piriform and neocortical regions exert an inhibitory influence on the glutamatergic wave activity. This raises an interesting paradox because the GABAergic pacemaker initiates waves at these stages, indicating that GABAergic transmission is excitatory. One possibility to explain these data is that GABAergic waves reflect excitation only within the GABAergic neuronal population, whereas GABAergic inputs to glutamatergic neurons might be inhibitory, reflecting a lower intracellular chloride concentration in the glutamatergic neurons. We tested whether the GABAergic pacemaker could excite glutamatergic neurons by asking whether glutamatergic neurons are recruited into waves initiated GABAergically. To do this, we measured calcium transient amplitudes in the piriform cortex during waves before and after treatment with CNQX under conditions where CNQX had no effect on wave frequency (i.e., where wave initiation was driven entirely by the GABAergic pacemaker). Under these conditions, CNQX caused a substantial reduction in the amplitude of calcium transients (from 9.57 ± 2.59 to 5.73 ± 1.54% ΔF/F0, p = 0.017), indicating that the GABAergic pacemaker that initiated the waves recruited glutamatergic neurons to participate in the waves. Thus, at stages when GABAergic neurons initiate waves and excite glutamatergic neurons, they also inhibit glutamatergic network activity. Possible mechanisms underlying this apparently dual action of the GABAergic pacemaker circuit are discussed below.
Discussion
Waves of spontaneous electrical activity propagate across the mouse cerebral cortex early in development. These waves are initiated in the septum or piriform cortex and may or may not propagate across the rhinal fissure to invade the neocortex. Waves are sensitive to blockers of GABAA and AMPA receptors, indicating that both transmitters are involved in wave initiation (Conhaim et al., 2011). It was not clear, however, from past experiments whether one pacemaker circuit exists with a neurotransmitter dependency that changes from GABAergic to glutamatergic, or whether there are two separate pacemaker circuits, each individually capable of wave initiation, that are expressed sequentially in development. In this paper, we used genetic elimination of GAD67, the primary enzyme for GABA synthesis at these stages, to test the hypothesis that there are two semi-independent pacemakers that initiate these waves: one GABAergic and the other glutamatergic.
In slices from GAD67 KO cortex, wave frequency was reduced by an amount predicted from the picrotoxin-sensitive fraction of waves in control slices, and wave sensitivity to picrotoxin was eliminated. These data argue that there are two separate pacemakers driving cortical waves. Waves in GAD67 KO slices also showed a much stronger tendency to propagate dorsally into the neocortex, confirming our previous conclusion (Conhaim et al., 2011) that the GABAergic pacemaker preferentially triggers waves that remain localized to the piriform cortex, whereas the glutamatergic pacemaker preferentially triggers fully propagating waves.
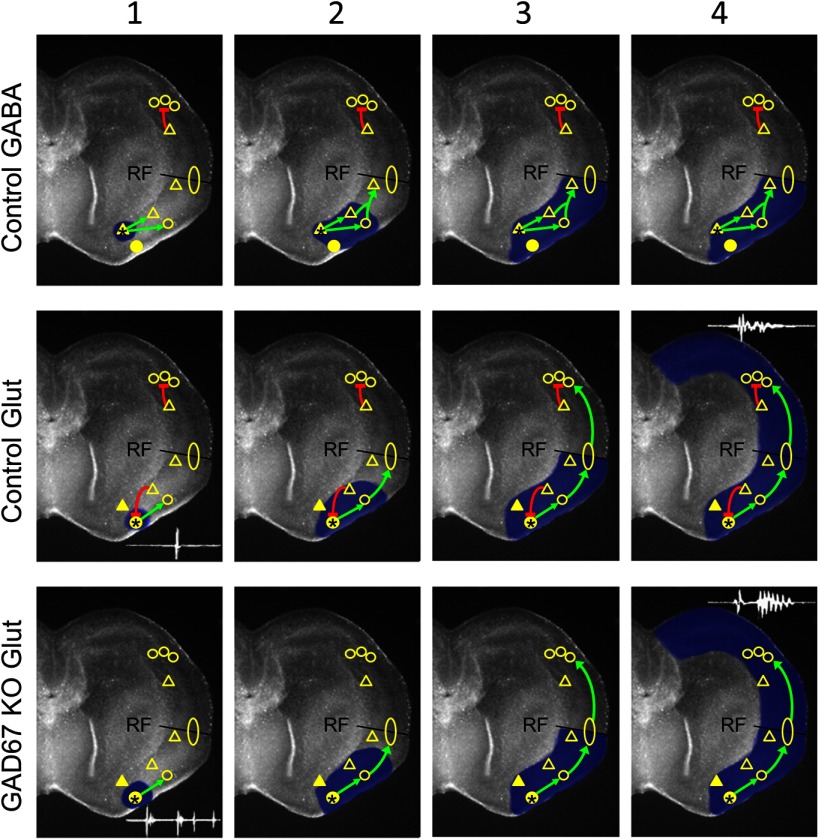
Our model of wave-initiating circuits in the piriform cortex and their interactions with follower neurons in both the piriform cortex and neocortex is shown in Figure 9. The top row represents generation of a GABAergic wave in a control slice. The GABA pacemaker fires (Frame 1: yellow triangle; asterisk). This recruits both GABAergic and glutamatergic follower cells in the piriform cortex (Frame 2: open triangle and circle). Because these waves rarely propagate across the rhinal fissure, we propose that the neurons recruited by the GABAergic pacemaker do not excite glutamatergic circuitry that spans the rhinal fissure (yellow ellipse). This wave propagates to the rhinal fissure (Frame 3) but does not cross it (Frame 4). The second row shows generation of a glutamatergic wave in a control slice. The glutamatergic pacemaker fires (yellow circle; asterisk) but, because it is normally inhibited by GABAergic neurons in the piriform cortex (yellow open triangle, red bar), it fires only a single LFP (inset, Frame 1). This recruits glutamatergic circuitry both locally in the piriform cortex (yellow circle) (Frame 2) and at the rhinal fissure (yellow ellipse), allowing these waves to reach the rhinal fissure (Frame 3) and cross into the neocortex (Frame 4). In the neocortex, glutamatergic circuitry is inhibited by GABAergic neurons, giving rise to an LFP without pronounced after-oscillations (inset, Frame 4). The third row represents generation of glutamatergic waves in GAD67 KO slices. The glutamatergic pacemaker in the piriform cortex fires, but, because it is not inhibited by local GABAergic neurons, it fires a burst of LPFs (inset, Frame 1). This recruits glutamatergic circuitry as in the control, and the wave propagates into the neocortex. In the neocortex, GABA inhibition is not present, so glutamatergic activity shows pronounced after-oscillations in the LFP (inset, Frame 4). GABAergic inhibition in this model occurs only when target cells are active, as discussed above.
Figure 9.
Circuit model of wave initiation and propagation (see text for full description of model). Yellow circles represent glutamatergic circuitry. Triangles represent GABAergic circuitry. Filled symbols represent initiators. Open symbols represent followers. The yellow ellipse indicates proposed glutamatergic circuitry that spans the rhinal fissure and triggers neocortical waves. RF, Rhinal fissure separating the piriform cortex (below) from the neocortex (above). Green arrows indicate excitation. Red bar lines indicate inhibition. The sequence of initiation and propagation is depicted for GABAergic waves in control slices (top row), glutamatergic waves in control slices (middle row), and glutamatergic waves in GAD67 KO slices (bottom row). Sequence of events proceeds left to right in columns 1–4.
Do symptoms of the GAD67 KO mouse suggest a developmental function for GABAergic waves? The GAD67 KO mouse dies at P0. Although Asada et al. (1997) reported that this mouse has normal gross cortical anatomy, they by necessity examined brains only up to P0. Any abnormalities resulting from the absence of GABAergic waves would be expected to appear only later in development, after the period during which these waves occur. It may be possible in future experiments to examine such abnormalities in cultured slices, which can be prepared before P0 and held in culture until later chronological stages.
Our previous data showed that the picrotoxin sensitivity of waves decreased over developmental time, presumably reflecting the fact that GABA becomes progressively less excitatory during the first postnatal week of development. Combined with the present data, this indicates a model in which the GABAergic pacemaker becomes progressively less important over developmental time, whereas the glutamatergic pacemaker assumes the dominant role in wave initiation. The complexity of wave initiation mechanisms presumably reflects the dynamic nature of cortical circuitry during a period of development when both GABAergic interneurons and glutamatergic pyramidal neurons are migrating, and when the changing levels of expression of chloride transporters gives rise to continuous changes in the strength and sign of GABAergic synaptic inputs to both GABAergic and glutamatergic neurons. This all occurs even as activity-dependent developmental programs continue to require spontaneous activity.
Our results differ from the pattern reported by Allène et al. (2008), who found that early synchronous activity was more dependent on glutamatergic transmission and only later transitioned to being GABA-dependent. This result is somewhat counterintuitive, given the fact that GABA is more excitatory at earlier stages of development (see, e.g., Owens et al., 1996). Allène et al. (2008) worked primarily in horizontal slices, which are likely not to include the piriform cortex where our GABAergic pacemaker resides. Thus, they may have excluded GABAergic waves in many of their experiments. In addition, when using relatively small imaging regions, it can be difficult to determine whether local synchrony results from the passage of a propagating wave through the field or some other form of correlated activity. We do not think that our early GABAergic waves result from using cultured slices because the stages at which GABAergic waves are most prominent are those at which the slices have been in culture the shortest period of time. We agree with Allène et al. (2008), however, that there are likely to be multiple forms of correlated activity in the developing brain, all represented to some extent throughout this critical period of development. For example, Yang et al. (2009, 2013) reported activity at these stages that depends on thalamic and/or peripheral inputs to the cortex. We have recorded local correlated activity between E18 and P4 that depends on gap junctional communication (S. C. Barnett, unpublished data), as well as wave activity that arises in various subcortical structures (Z. Barger, unpublished data).
Our data also indicate that GABAergic neurons as a population can simultaneously act to trigger waves, recruit glutamatergic neurons into those waves, and inhibit glutamatergic network activity. At the stages we are examining in heterozygous slices, between 65% and 80% of waves are initiated by GABAergic neurons. Glutamatergic neurons are recruited into these waves, as indicated by the decrease in calcium transient amplitude in the piriform cortex during the waves by CNQX. The glutamatergic waves are inhibited by GABAergic neurons, as indicated by the effect of the GAD67 KO on LFP waveform in the neocortex, and by the increase in LFP bursts associated with waves in the GAD67 KO. How can GABA be simultaneously excitatory and inhibitory to the glutamatergic circuitry? One possibility is that the population of glutamatergic neurons is not uniform. Less mature neurons, presumably with higher levels of intracellular chloride, might be the population that is recruited into waves by the GABAergic pacemaker because GABA is more excitatory to those cells. More mature neurons, with lower intracellular chloride levels, might form the core of the network generating oscillations in the neocortex and be more inhibited by GABAergic inputs. But there are other possible explanations. Even at stages when GABA is most excitatory, measured GABA reversal potentials, although positive to threshold, are still negative to the AMPA receptor reversal potential (Owens et al., 1996). In this situation, GABA would be excitatory to quiescent cells but inhibitory to events driven by glutamatergic inputs. Independent of reversal potential considerations, the shunting caused by opening of GABAA chloride channels would also decrease glutamatergic excitation, not only by reducing input resistance, but also by reducing length and time constants. Thus, defining whether the output of GABAergic circuitry in the piriform cortex is excitatory or inhibitory depends on knowing the state of activity of glutamatergic circuits at that instant in time. When the glutamatergic pacemaker is operating at low frequency, the dominant effect of GABA action on glutamatergic neurons will be excitatory, recruiting them into waves. When the glutamatergic pacemaker is operating at higher frequencies, GABA will tend to inhibit those neurons, reducing the participation of glutamatergic neurons in wave activity. Frequency-dependent transient changes in intracellular chloride concentration may also contribute to these effects. Eventually, by approximately P10, GABA becomes inhibitory in all contexts, and this transition terminates waves entirely, allowing asynchronous circuit activity to emerge in the cortex.
Footnotes
This work was supported by National Science Foundation IOB0718344 to W.J.M., National Institutes of Health to A.F., National Institutes of Health Neurobiology Training Grant to C.R.E., and the Mary Gates Endowment for Undergraduate Research to K.W. and S.P.M.
The authors declare no competing financial interests.
References
- Allène C, Cattani A, Ackman JB, Bonifazi P, Aniksztejn L, Ben-Ari Y, Cossart R. Sequential generation of two distinct synapse-driven network patterns in developing neocortex. J Neurosci. 2008;28:12851–12863. doi: 10.1523/JNEUROSCI.3733-08.2008. [DOI] [PMC free article] [PubMed] [Google Scholar]
- Asada H, Kawamura Y, Maruyama K, Kume H, Ding RG, Kanbara N, Kuzume H, Sanbo M, Yagi T, Obata K. Cleft palate and decreased brain gamma-aminobutyric acid in mice lacking the 67-kDa isoform of glutamic acid decarboxylase. Proc Natl Acad Sci U S A. 1997;94:6496–6499. doi: 10.1073/pnas.94.12.6496. [DOI] [PMC free article] [PubMed] [Google Scholar]
- Blankenship AG, Feller MB. Mechanisms underlying spontaneous patterned activity in developing neural circuits. Nat Rev Neurosci. 2010;11:18–29. doi: 10.1038/nrn2759. [DOI] [PMC free article] [PubMed] [Google Scholar]
- Chub N, O'Donovan MJ. Blockade and recovery of spontaneous rhythmic activity after application of neurotransmitter antagonists to spinal networks of the chick embryo. J Neurosci. 1998;18:294–306. doi: 10.1523/JNEUROSCI.18-01-00294.1998. [DOI] [PMC free article] [PubMed] [Google Scholar]
- Conhaim J, Cedarbaum ER, Barahimi M, Moore JG, Becker MI, Gleiss H, Kohl C, Moody WJ. Bimodal septal and cortical triggering and complex propagation patterns of spontaneous waves of activity in the developing mouse cerebral cortex. Dev Neurobiol. 2010;70:679–692. doi: 10.1002/dneu.20797. [DOI] [PubMed] [Google Scholar]
- Conhaim J, Easton CR, Cedarbaum ER, Barahimi M, Moore JG, Becker MI, Mather LF, Minter DJ, Moen SP, Dabagh S, Moody WJ. Developmental changes in propagation mouse cerebral cortex. J Physiol. 2011;589:2529–2541. doi: 10.1113/jphysiol.2010.202382. [DOI] [PMC free article] [PubMed] [Google Scholar]
- Corlew R, Bosma MM, Moody WJ. Spontaneous, synchronous electrical activity in neonatal mouse cortical neurons. J Physiol. 2004;560:377–390. doi: 10.1113/jphysiol.2004.071621. [DOI] [PMC free article] [PubMed] [Google Scholar]
- Garaschuk O, Linn J, Eilers J, Konnerth A. Large-scale oscillatory calcium waves in the immature cortex. Nat Neurosci. 2000;3:452–459. doi: 10.1038/74823. [DOI] [PubMed] [Google Scholar]
- Hunt PN, Gust J, McCabe AK, Bosma MM. Primary role of the serotonergic midline system in synchronized spontaneous activity during development of the embryonic mouse hindbrain. J Neurobiol. 2006;66:1239–1252. doi: 10.1002/neu.20259. [DOI] [PubMed] [Google Scholar]
- Kasyanov AM, Safiulina VF, Voronin LL, Cherubini E. GABA-mediated giant depolarizing potentials as coincidence detectors for enhancing synaptic efficacy in the developing hippocampus. Proc Natl Acad Sci U S A. 2004;101:5311–5312. doi: 10.1073/pnas.0401270101. [DOI] [PMC free article] [PubMed] [Google Scholar]
- Lischalk JW, Easton CR, Moody WJ. Bilaterally propagating waves of spontaneous activity arising from discrete pacemakers in the neonatal mouse cerebral cortex. Dev Neurobiol. 2009;69:407–414. doi: 10.1002/dneu.20708. [DOI] [PubMed] [Google Scholar]
- McCabe AK, Chisholm SL, Picken-Bahrey HL, Moody WJ. The self-regulating nature of spontaneous synchronized activity in developing mouse cortical neurones. J Physiol. 2006;577:155–167. doi: 10.1113/jphysiol.2006.117523. [DOI] [PMC free article] [PubMed] [Google Scholar]
- McCabe AK, Easton CR, Lischalk JW, Moody WJ. Roles of glutamate and GABA receptors in setting the developmental timing of spontaneous synchronized activity in the developing mouse cortex. Dev Neurobiol. 2007;67:1574–1588. doi: 10.1002/dneu.20533. [DOI] [PubMed] [Google Scholar]
- Moody WJ, Bosma MM. Ion channel development, spontaneous activity, and activity-dependent development in nerve and muscle cells. Physiol Rev. 2005;85:883–941. doi: 10.1152/physrev.00017.2004. [DOI] [PubMed] [Google Scholar]
- Owens DF, Boyce LH, Davis MB, Kriegstein AR. Excitatory GABA responses in embryonic and neonatal cortical slices demonstrated by gramicidin perforated-patch recordings and calcium imaging. J Neurosci. 1996;16:6414–6423. doi: 10.1523/JNEUROSCI.16-20-06414.1996. [DOI] [PMC free article] [PubMed] [Google Scholar]
- Picken-Bahrey HL, Albrieux M, Moody WJ. Early development of voltage-gated ion currents and firing properties in neurons of the mouse cerebral cortex. J Neurophysiol. 2003;89:1761–1773. doi: 10.1152/jn.00972.2002. [DOI] [PubMed] [Google Scholar]
- Schneiderman JH. Low concentrations of penicillin reveal rhythmic, synchronous synaptic potentials in hippocampal slice. Brain Res. 1986;398:231–241. doi: 10.1016/0006-8993(86)91482-4. [DOI] [PubMed] [Google Scholar]
- Scott A, Weir K, Easton C, Huynh W, Moody WJ, Folch A. A microfluidic microelectrode array for simultaneous electrophysiology, chemical stimulation, and imaging of brain slices. Lab Chip. 2013;13:527–535. doi: 10.1039/c2lc40826k. [DOI] [PMC free article] [PubMed] [Google Scholar]
- Tamamaki N, Yanagawa Y, Tomioka R, Miyazaki J, Obata K, Kaneko T. Green fluorescent protein expression and colocalization with calretinin, parvalbumin, and somatostatin in the GAD67-GFP knock-in mouse. J Comp Neurol. 2003;467:60–79. doi: 10.1002/cne.10905. [DOI] [PubMed] [Google Scholar]
- Voigt T, Opitz T, de Lima AD. Activation of early silent synapses by spontaneous synchronous network activity limits the range of neocortical connections. J Neurosci. 2005;25:4605–4615. doi: 10.1523/JNEUROSCI.3803-04.2005. [DOI] [PMC free article] [PubMed] [Google Scholar]
- Wong WT, Myhr KL, Miller ED, Wong RO. Developmental changes in the neurotransmitter regulation of correlated spontaneous retinal activity. J Neurosci. 2000;20:351–360. doi: 10.1523/JNEUROSCI.20-01-00351.2000. [DOI] [PMC free article] [PubMed] [Google Scholar]
- Yang JW, Hanganu-Opatz IL, Sun JJ, Luhmann HJ. Three patterns of oscillatory activity differentially synchronize developing neocortical networks in vivo. J Neurosci. 2009;29:9011–9025. doi: 10.1523/JNEUROSCI.5646-08.2009. [DOI] [PMC free article] [PubMed] [Google Scholar]
- Yang JW, An S, Sun JJ, Reyes-Puerta V, Kindler J, Berger T, Kilb W, Luhmann HJ. Thalamic network oscillations synchronize ontogenetic columns in the newborn rat barrel cortex. Cereb Cortex. 2013;23:1299–1316. doi: 10.1093/cercor/bhs103. [DOI] [PubMed] [Google Scholar]
- Zheng J, Lee S, Zhou ZJ. A transient network of intrinsically bursting starburst cells underlies the generation of retinal waves. Nat Neurosci. 2006;9:363–371. doi: 10.1038/nn1644. [DOI] [PubMed] [Google Scholar]
Associated Data
This section collects any data citations, data availability statements, or supplementary materials included in this article.
Supplementary Materials
Preferential block of local waves by GAD 67 KO. Films of activity in a heterozygote control and GAD67 KO slice. The control slice shows both local and propagating waves, whereas the KO slice shows only fully propagating waves. Both slices are taken from the same rostral–caudal level. Fluorescence scale is ΔF/F0.
Simultaneous recording of a propagating wave using Ca2+ imaging (left) and the microfluidic extracellular array (right). The 12 recording apertures are placed along the path of wave propagation with apertues 8–12 in the piriform initiation region. Aperture positions are indicated by small numbered circles on the slice image and by numbers to the right of the electrical recordings. The Ca2+ signal lags behind the electrical recording and lasts longer. The electrical recordings show a clear delay between ventral piriform and dorsal neocortical sites and indicate the speed of wave propagation. In local waves, the field potential signals at the dorsal sites would be absent. Fluorescence scale is ΔF/F0.


