

Abstract
Animals often listen selectively for particular sounds, a strategy that could alter neural encoding mechanisms to maximize the ability to detect the target. Here, we recorded auditory cortex neuron responses in well trained, freely moving gerbils as they performed a tone detection task. Each trial was initiated by the animal, providing a predictable time window during which to listen. No sound was presented on nogo trials, permitting us to assess spontaneous activity on trials in which a signal could have been expected, but was not delivered. Immediately after animals initiated a trial, auditory cortex neurons displayed a 26% reduction in spontaneous activity. Moreover, when stimulus-driven discharge rate was referenced to this reduced baseline, a larger fraction of auditory cortex neurons displayed a detection threshold within 10 dB of the behavioral threshold. These findings suggest that auditory cortex spontaneous discharge rate can be modulated transiently during task performance, thereby increasing the signal-to-noise ratio and enhancing signal detection.
Keywords: attention, auditory cortex, auditory perception, detection threshold, expectation, spontaneous activity
Introduction
The ability to detect a sound can be strongly influenced by expectations about stimulus features and presentation time (Greenberg and Larkin, 1968; Dai and Wright, 1995: Wright et al., 1997; Wright et al., 2010; Fitzgerald and Wright, 2011). One neural explanation for improved listening is that sound-driven responses are modulated by selective attention during task engagement (Fritz et al., 2003; Fritz et al., 2007; Otazu et al., 2009; Jaramillo and Zador, 2011; David et al., 2012). Because neural detection thresholds depend on the relationship between stimulus-driven responses (signal) and the spontaneous discharge (noise), an increase in the driven response will improve a neuron's detection threshold. However, a decrease in spontaneous rate (SR) could also lead to an improvement. Although there is evidence that SR can influence perception (Supèr et al., 2003; Yoshida and Katz, 2011), it is not clear whether it improves the signal-to-noise ratio for task-relevant stimuli during an auditory perception task.
Here, we investigated whether task performance can modulate auditory cortex SR during a near-threshold detection task, thereby providing another mechanism for improving the signal-to-noise ratio that supports signal detection. We recorded from auditory cortex neurons in freely moving adult gerbils while they performed a tone detection task. Several design strategies were used to determine whether task engagement modulated SR. First, animals initiated each trial, providing a predicable target presentation time. Second, silence was used as the nogo stimulus, permitting an unambiguous measure of SR. Third, we focused on neural responses to near-threshold target stimuli that presumably require maximal effort to detect. Fourth, animals were not immobilized, yet maintained a fixed position in the nose-poke during stimulus delivery, resulting in acoustic stability. Finally, we used gerbils because this rodent displays excellent sensitivity at the lower frequencies used in this study (Fay, 1988). We present evidence that signal detection by auditory cortex neurons can be improved through behaviorally gated reduction of spontaneous activity, suggesting that both sound-driven and SR contribute to perception.
Materials and Methods
All procedures were in accordance with the guidelines and rules of the Institutional Animal Care and Use Committee of New York University and were approved by the Office of Laboratory Animal Welfare, Office of Extramural Research, National Institutes of Health. Animals were placed on controlled water access and trained on a tone detection task using a go or nogo paradigm in which a tone (2.5 ms cos2 ramp) signaled the presence of a small reward (20 μl of H2O). To initiate a trial, the animal maintained its position in a nose-poke for 400 ms before a trial (either a tone or silence) was presented. Perceptual ability was assessed by presenting at least five different sound levels that bracketed the animal's behavioral threshold. The trial was scored as a hit (on go trials) or false alarm (on nogo trials) if the animal made contact with the lick spout. As illustrated in Figure 3A, psychometric functions were fitted using pypsignifit (Fründ et al., 2011).
Figure 3.

Behavioral performance on the tone detection task. A, Example psychometric functions from a single session for 8 ms (red diamond) and 128 ms (black circle) tones. Threshold was estimated by fitting a psychometric function (solid line) to the d′ values (individual points). Threshold was defined as the tone level where d′ = 1. B, Distribution of behavioral thresholds for 8 and 128 ms tones for all sessions from all animals. In general, lower thresholds were obtained with 128 ms stimuli.
The animals performed an average of 367 (SD = 195) trials per session and three to four sessions per week. Animals that achieved a false alarm rate of ≤20% were implanted with a multichannel electrode array mounted on a microdrive that allowed positioning of the array after implantation. Electrodes were positioned in the left auditory cortex using a stereotaxic apparatus 4.8 mm lateral and 3.4 mm anterior to lambda. The ground wire was inserted contralaterally.
A real-time processor (RZ6; Tucker-Davis Technologies) was used for controlling the experiment. Water was delivered via a pump (NE-1000; New Era). Acoustic stimuli were generated via the computer, amplified (Crown D75A; Crown Audio) and presented via one of two speakers (DX25TG05-04; Vifa) positioned 1 m from the nose-poke. Nose-poke and spout-contact were monitored using an infrared beam. A 15-channel wireless headstage and receiver (W16; Triangle Biosystems) was used in conjunction with a preamplifier and analog-to-digital converter (TB32; Tucker-Davis Technologies).
To remove low-frequency artifacts, the average of all electrodes was subtracted from each channel and high-pass filtered at 300 Hz. A representative 16 s segment was used to estimate the noise floor of each channel using the algorithm described by Quiroga et al. (2004). Spike candidate thresholds were set at 4–5 SDs relative to the noise floor and artifact reject was typically set to 20–40 SDs. All epochs occurring within 200 ms of an artifact on any channel were discarded. Sound-evoked and spontaneous rates were assessed using 128 ms windows (Fig. 1). To estimate neural thresholds, rate-level functions were standardized by conversion to a Z-score and threshold was defined as the level at which the Z-score exceeded the cutoff value.
Figure 1.

Effect of environmental context on neural activity. A, Schematic of an experiment session. During a nontask block (left), we acquired neural responses to tone stimuli (nontask evoked; sound wave symbols) identical to those presented during task performance. SR was assessed in between stimulus presentations (nontask SR). After a brief period (large, open arrow), the nose-poke and water spout were placed in the chamber and the task block was started. During the task block (right), animals initiated trials via a nose-poke. A water reward was delivered for a correct response on go trials. The analyses in subsequent figures are based on the discharge rate between trials (intertrial SR), during nogo trials at the expected target latency (nogo SR), and in response to the target (go trial evoked). B, SRs recorded during the nontask block are equal to those recorded during the intertrial period of the task block, as shown by the linear regression (blue line). For reference, a dashed line with a slope of 1 is plotted. C, The relationship between sound-evoked rates during the nontask block and the task block were more variable than for SR; however, on average, sound-evoked rates during the task block were significantly higher than in the nontask condition, as shown by the linear regression (blue line). Only data for which at least 10 trials were obtained from the task blocks were included. A small number of points with values beyond the axis range are indicated by arrows.
Results
Multiunit responses were acquired from the left auditory cortex of five adult Mongolian gerbils (Meriones unguiculatus) of either sex while they performed a go/nogo tone detection task. Go trials contained a tone that varied randomly from trial to trial over a 40–50 dB range and nogo trials were silent. Of 287 multiunit responses obtained, 194 displayed a significant sound-evoked response on at least one sound level, as defined by a driven rate that was at least 1 SD greater than the SR on nogo trials. Spike waveforms from five exemplar multiunits are shown in Figure 2B.
Figure 2.
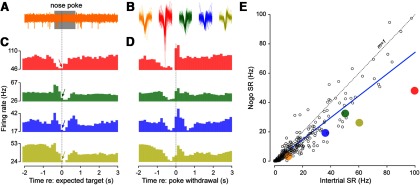
SR of auditory cortex neurons is reduced following trial initiation. A, Raw multiunit trace (orange) from a representative nogo trial with the duration of the nose-poke bounded by the gray rectangle. B, Action potential waveforms extracted from the exemplar neurons shown in C and D. C, D, Four peristimulus time histograms are shown for nogo trials with all epochs aligned to the onset of the expected tone presentation time (C) or poke withdrawal (D). During go trials, the signal would have occurred 400 ms after the nose-poke and the arrow in each histogram points to this expected tone presentation time (C). This bin was used for estimating the SR during nogo trials. Bin width is 128 ms. E, SR during nogo trials versus intertrial SR for all multiunits. The dashed line indicates unity and the thick blue line indicates the linear regression through the data points. The data points extracted from the exemplar neurons displayed in A–D are indicated by their respective colors.
Environmental context does not alter spontaneous rate
To examine the effect of environmental context on neural activity, a subset of the sessions included a nontask block during which the nose-poke and water-spout were removed from the experiment chamber (Fig. 1A). During this block, tone stimuli identical to those delivered during task performance were presented (∼25 trials per SPL). The intertrial SRs during the task blocks were closely correlated with SRs during the nontask blocks (paired t(132) = 0.63, p = 0.53, Fig. 1B), indicating no influence of context and recording stability over the 1–2 h required to obtain both nontask and task recordings. In contrast to SR, there was a 20% increase in the sound-evoked discharge rates when animals performed the detection task compared with nontask blocks (paired t(999) = 6.47, p ≤ 0.0001, Fig. 1C). Although this is consistent with reports that attending to an auditory target enhances the neural representation (Jaramillo and Zador, 2011; David et al., 2012), we did not control head position during the nontask block and cannot rule out a possible contribution to the effect.
Behavioral context alters spontaneous rate
We next investigated whether behavioral performance modulated SR during the period when animals were most likely to be attending to the stimulus (i.e., immediately after initiating a trial by nose-poking for 400 ms). To assess the time course of the behaviorally gated change in SR, peristimulus time histograms were generated for each multiunit recording. These histograms, plotted as a function of time relative to the expected time of the target, revealed that firing rate was stable up until ∼1000 ms before poke onset, whereupon there was a transient increase in discharge rate followed by a significant reduction, reaching a minimum just around the expected stimulus onset (Fig. 2C). This characteristic was displayed by 89% of multiunit recordings (Fig. 2E). SR during (silent) nogo trials was measured using a 128 ms window positioned 10 ms after the expected time of the target (Fig. 2C, arrows). SR was depressed by 26% (paired t(287) = 10.6, p ≤ 0.0001) compared with the 128 ms intervals sampled from the intertrial period (Fig. 2E). Because the exact time of nose-poke withdrawal varied, we replotted these histograms relative to the time of nose-poke withdrawal (Fig. 2D). For many neurons, a transient increase in discharge rate upon withdrawal may have obscured the exact time at which SR returned to pretrial baseline (e.g., the reduction in SR persisted until ∼900 ms after poke withdrawal in the blue histogram).
Relationship of behaviorally gated neural thresholds to perceptual performance
Animals were tested with short (8 ms) and long (128 ms) duration tones. Duration was held constant within each session. Because acoustic information is summed over time for tone detection, resulting in better detection thresholds (Gerken et al., 1990), we expected better behavioral and neural detection thresholds with 128 ms tones. Figure 3A illustrates two psychometric functions for detection of 8 and 128 ms tones, fit to responses obtained during a single session from one animal. Depending on the testing session, animals displayed a range of tone detection thresholds, but the lowest behavioral thresholds were consistent with those reported previously (Ryan, 1976). The average detection threshold for 128 ms tones ≥1 kHz was 21 dB SPL, whereas the average threshold for 8 ms tones was 11 dB higher (two-sample t(95) = 3.83, p = 0.0002; Fig. 3B). When considering only sessions using a tone frequency of 2 kHz, the average detection threshold was 20 dB SPL for 128 ms tones, whereas the average threshold for 8 ms tones was 8 dB higher (two-sample t(62) = 3.34, p = 0.0012). Therefore, behavioral detection thresholds depended on stimulus duration.
The traditional method for characterizing a neuron's response threshold is to determine whether the sound-driven discharge rate is significantly greater than the SR observed before the stimulus occurs. To assess whether neural thresholds had a better relationship with the corresponding behavioral threshold when referenced to the transient drop in SR during a trial, a rate-level function was calculated for each neuron using a 128 ms window positioned 10 ms after stimulus onset. Each rate-level function was then standardized by calculating a Z-score using either the intertrial SR or the reduced SR that occurred immediately after trial initiation (Fig. 4A,B). Figure 4C plots the effect of referencing the driven response to the behaviorally gated reduction in SR for go trials in which the stimulus was within 5 dB of the animal's behavioral threshold for that session. On average, there was a 3.5-fold improvement in Z-score when the driven signal was referenced to the behaviorally gated SR (paired t(273) = 11.5, p ≤ 0.0001).
Figure 4.

Relationship between neural and behavioral thresholds. A, Peristimulus time histograms from a multiunit recorded during a single behavioral session illustrating the response to nogo trials and go trials at 10, 20, and 30 dB SPL to 128 ms tones. Bin width is 10 ms. The nogo histogram is replotted over each go histogram (black line) to illustrate the evoked response relative to the reduced SR. B, Rate-level function for the multiunit shown in A plotted as the Z-score referenced to both intertrial (black) and nogo SR (blue). Blue and black arrows indicate the corresponding neural threshold (as defined by Z-score = 1). The red arrow indicates the behavioral threshold for that session. C, Comparison of methods for computing the Z-score for near-threshold go trials (i.e., within 5 dB of behavioral threshold). In general, using the SR during nogo trials as a reference yielded larger Z-scores compared with using the intertrial SR. Data from both 8 ms (red diamonds) and 128 ms (black circles) tones are shown. Dashed line indicates unity. Values beyond the axis range are indicated by arrows. D, Neural thresholds (as estimated from the Z-score referenced to the nogo SR) compared with behavioral thresholds. E, Cumulative distribution of neural thresholds relative to behavioral thresholds for 128 ms tones only. Thresholds as estimated by comparing with intertrial SR (black) are compared with thresholds as estimated by comparing with nogo SR (blue), indicating that a much larger fraction of multiunits have thresholds within 10 dB of the behavioral threshold when referenced to nogo SR. F, Fraction of cells recruited by using the SR during nogo trials as a reference, as assessed by the difference between the nogo and intertrial cumulative distribution function in E. This is repeated for multiple Z-score criteria. Regardless of the Z-score used to estimate neural threshold, the largest recruitment of neurons occurs within 5–10 dB of threshold.
We set a criterion of 1 SD (Z-score = 1) above baseline SR for estimating neural thresholds (Fig. 4B, dashed line). To examine whether the behaviorally gated reduction of SR could influence neural thresholds, we compared the neural thresholds with behavioral thresholds when the evoked rate was referenced to the behaviorally gated SR as opposed to the intertrial SR. For this comparison, behavioral thresholds were subtracted from neural thresholds. Therefore, 5 dB means that the neural threshold was 5 dB poorer than the behavioral threshold. As shown in Figure 4E, the behaviorally gated reduction of SR had the greatest effect within 10 dB of the behavioral threshold measured during the same session. The difference between these two curves represents the fraction of additional multiunits that are recruited when the evoked rate is referenced to the behaviorally gated SR and illustrates that almost 30% more units are recruited within 10 dB of behavioral threshold (Fig. 4F). To assess whether our original choice of Z-score criterion influenced the results, we repeated this process for additional Z-scores and found that ∼20–30% more units were recruited within 5–10 dB of behavioral threshold regardless of the Z-score at which we assessed neural threshold.
When neural thresholds were derived from the rate-level function referenced to the behaviorally gated reduced SR (Fig. 4B), the best neural thresholds closely matched behavioral thresholds for both 8 and 128 ms tones (Fig. 4D). The cumulative fraction of neural thresholds relative to behavioral threshold for the same session showed that a similar fraction of units (∼33%) were responsive at the animal's behavioral threshold for 8 and 128 ms tones (data not shown). This suggests that elevated detection thresholds observed for shorter durations were largely reflected in the discharge rate of cortical neurons.
If the reduction in SR improves sensitivity to near-threshold targets, then correct target detection on go trials should be associated with a larger ratio between the sound-driven rate and the SR immediately preceding the sound-driven response. We assessed this for go trials within 10 dB of behavioral threshold by comparing the sound-driven rate (128 ms window positioned 10 ms after stimulus onset) with the SR immediately prior (128 ms bin). On hit (i.e., correct) trials, the ratio was 2.4, significantly higher than the ratio of 2.1 on miss trials (paired t(755) = 3.11, p = 0.002). Therefore, detection of near-threshold targets could use the behaviorally gated decrease in resting discharge rate to increase the signal-to-noise ratio.
Discussion
Attention and expectation can modulate sound-evoked neuronal discharge rate during the performance of a trained auditory task, often by enhancing the neural response to relevant targets (Fritz et al., 2003, 2007, 2010; Elhilali et al., 2007; Atiani et al., 2009; Otazu et al., 2009; Jaramillo and Zador, 2011; Lee and Middlebrooks, 2011; Sutter and Shamma, 2011; David et al., 2012; Niwa et al., 2012). A larger stimulus-evoked response can improve neural detection thresholds through a larger ratio of driven to spontaneous rate. Here, we investigated whether SR can also be modulated during task performance, thereby improving neural detection thresholds. Animals performed a tone detection task in which stimulus level varied while recordings were obtained from auditory cortex neurons. Neural and psychophysical performance was compared on a per-session basis. Consistent with previous reports, we found that tone-evoked responses were enhanced during task engagement (Fig. 1C). However, we also found a 26% reduction of SR that was gated by task performance, suggesting that internal noise can be suppressed during the expected target presentation time (Fig. 2). Therefore, it is possible that task-dependent modulation of both the driven discharge rate (i.e., signal) and SR (i.e., noise) could participate in near-threshold signal detection.
Calculation of neural sensitivity depends on the choice of baseline and the prestimulus SR has been a conventional choice. However, this choice assumes that SR remains stable during each trial. This was not that case for a tone detection task (Fig. 2). Referencing the evoked response to the firing rate during nogo trials (i.e., at the expected target presentation time) as opposed to the intertrial SR resulted in an apparent enhancement in sensitivity for near-threshold responses by an average factor of 3.5 (Fig. 4C). The cumulative effect is an ∼30% increase in the number of neurons that responded to sound levels within 10 dB of behavioral threshold (Fig. 4E,F). One possible reason for the large effect near behavioral threshold is that animals may attend selectively to near-threshold sound levels. A similar phenomenon has been observed in the primate visual system, in which high attention to a difficult detection task is associated with improved performance on small, but not large, changes in the stimulus (Cohen and Maunsell, 2011).
Behaviorally gated modulation of SR is not unique to the auditory cortex. Gustatory cortex neurons with firing rates <3 Hz display a task-related reduction in SR immediately before presentation of the target, as reported by Yoshida and Katz (2011). These investigators also reported that task performance modulates stimulus-driven firing rate; however, this modulation is correlated with the prestimulus firing rate (i.e., an increase in the response to the target is associated with increased prestimulus firing rate). In our study, the reduction was found across the full range of SRs observed (Fig. 2) and did not appear to diminish the target-evoked response (Fig. 1C). Possible reasons for this discrepancy are that the gustatory paradigm used a broader window during which to expect a stimulus with jittered stimulus onset times, and used easily detectable stimuli on each trial. These dissimilarities in design may have expanded the period during which a stimulus was to be expected, along with the period during which all activity was suppressed, leading to a net suppression of both sound-evoked and spontaneous activity.
A study in awake, behaving primates also supports a role for spontaneous activity in perceptual decisions. For primary visual cortex, the probability of detecting a behaviorally meaningful visual stimulus is correlated with the SR observed 100 ms before stimulus is presented (Supèr et al., 2003). Although this is consistent with our finding that correct responses on near-threshold go trials are associated with a larger ratio of the sound-driven rate with the SR immediately preceding the sound-driven response, our results suggest that assessing SR immediately before trial onset may not be the best choice of baseline. SR displayed a consistent reduction during the brief interval when animals make a perceptual decision, reaching a minimum at the expected stimulus presentation time (Fig. 2). This mechanism could explain behavioral studies showing that sound detection is better when the presentation time is expected (Wright and Fitzgerald, 2004).
The small, but significant, increase in the target-evoked response during task performance reported here (Fig. 1C) seems at odds with a prior study showing reduced discharge rates in response to an auditory target during task performance (Otazu et al., 2009). However, when a similar auditory task contains an explicit target expectation time, enhanced target-evoked responses can be observed (although this depends on each neuron's tuning properties; Jaramillo and Zador, 2011). This suggests that neural responses reflect task-specific strategies that may optimize performance.
Here, we have chosen a relatively simple task in which animals must detect the presence of a short or long tone, providing two different perceptual thresholds against which to compare neural responses. Unlike more complex targets in which modulation of the envelope may carry information through inhibition of SR, tone detection at threshold likely depends on a small increase in resting discharge rate. Therefore, detection ability can be maximized by transiently suppressing SR. Our findings illustrate the importance of assessing neural and behavioral properties in the same animal during the same session and suggest that adaptive plasticity may include behaviorally gated modulation of the baseline discharge rate against which evoked responses are compared. This plasticity could emerge during the course of training and serve as one mechanistic basis for the decrease in internal noise that is observed during auditory perceptual learning (Jones et al., 2013).
Footnotes
This work was supported by the National Institutes of Health (Grant R01 DC009237 to D.H.S. and Grant T32 MH019524). We thank Jasmine Grimsley, Don Katz, Merri Rosen, Emma Sarro, Sharad Shanbhag, Melissa Caras, Antje Ihlefeld, and Dick Tsien for technical advice, helpful discussions, and editorial comments on the manuscript.
The authors declare no competing financial interests.
References
- Atiani S, Elhilali M, David SV, Fritz JB, Shamma SA. Task difficulty and performance induce diverse adaptive patterns in gain and shape of primary auditory cortical receptive fields. Neuron. 2009;61:467–480. doi: 10.1016/j.neuron.2008.12.027. [DOI] [PMC free article] [PubMed] [Google Scholar]
- Cohen MR, Maunsell JH. When attention wanders: how uncontrolled fluctuations in attention affect performance. J Neurosci. 2011;31:15802–15806. doi: 10.1523/JNEUROSCI.3063-11.2011. [DOI] [PMC free article] [PubMed] [Google Scholar]
- Dai H, Wright BA. Detecting signals of unexpected or uncertain durations. J Acoust Soc Am. 1995;98:798–806. doi: 10.1121/1.413572. [DOI] [PubMed] [Google Scholar]
- David SV, Fritz JB, Shamma SA. Task reward structure shapes rapid receptive field plasticity in auditory cortex. Proc Natl Acad Sci U S A. 2012;109:2144–2149. doi: 10.1073/pnas.1117717109. [DOI] [PMC free article] [PubMed] [Google Scholar]
- Elhilali M, Fritz JB, Chi TS, Shamma SA. Auditory cortical receptive fields: stable entities with plastic abilities. J Neurosci. 2007;27:10372–10382. doi: 10.1523/JNEUROSCI.1462-07.2007. [DOI] [PMC free article] [PubMed] [Google Scholar]
- Fay RR. Comparative psychoacoustics. Hear Res. 1988;34:295–305. doi: 10.1016/0378-5955(88)90009-3. [DOI] [PubMed] [Google Scholar]
- Fitzgerald MB, Wright BA. Perceptual learning and generalization resulting from training on an auditory amplitude-modulation detection task. J Acoust Soc Am. 2011;129:898–906. doi: 10.1121/1.3531841. [DOI] [PMC free article] [PubMed] [Google Scholar]
- Fritz JB, Elhilali M, David SV, Shamma SA. Auditory attention– focusing the searchlight on sound. Curr Opin Neurobiol. 2007;17:437–455. doi: 10.1016/j.conb.2007.07.011. [DOI] [PubMed] [Google Scholar]
- Fritz JB, David SV, Radtke-Schuller S, Yin P, Shamma SA. Adaptive, behaviorally gated, persistent encoding of task-relevant auditory information in ferret frontal cortex. Nat Neurosci. 2010;13:1011–1019. doi: 10.1038/nn.2598. [DOI] [PMC free article] [PubMed] [Google Scholar]
- Fritz J, Shamma S, Elhilali M, Klein D. Rapid task-related plasticity of spectrotemporal receptive fields in primary auditory cortex. Nat Neurosci. 2003;6:1216–1223. doi: 10.1038/nn1141. [DOI] [PubMed] [Google Scholar]
- Fründ I, Haenel NV, Wichmann FA. Inference for psychometric functions in the presence of nonstationary behavior. J Vis. 2011;11:1–19. doi: 10.1167/11.6.16. [DOI] [PubMed] [Google Scholar]
- Gerken GM, Bhat VK, Hutchison-Clutter M. Auditory temporal integration and the power function model. J Acoust Soc Am. 1990;88:767–778. doi: 10.1121/1.399726. [DOI] [PubMed] [Google Scholar]
- Greenberg GZ, Larkin WD. Frequency-response characteristic of auditory observers detecting signals of a single frequency in noise: the probe-signal method. J Acoust Soc Am. 1968;44:1513–1523. doi: 10.1121/1.1911290. [DOI] [PubMed] [Google Scholar]
- Jaramillo S, Zador AM. Auditory cortex mediates the perceptual effects of acoustic temporal expectation. Nat Neurosci. 2011;14:246–251. doi: 10.1038/nn.2688. [DOI] [PMC free article] [PubMed] [Google Scholar]
- Jones PR, Moore DR, Amitay S, Shub DE. Reduction of internal noise in auditory perceptual learning. J Acoust Soc Am. 2013;133:970–981. doi: 10.1121/1.4773864. [DOI] [PubMed] [Google Scholar]
- Lee CC, Middlebrooks JC. Auditory cortex spatial sensitivity sharpens during task performance. Nat Neurosci. 2011;14:108–114. doi: 10.1038/nn.2713. [DOI] [PMC free article] [PubMed] [Google Scholar]
- Niwa M, Johnson JS, O'Connor KN, Sutter ML. Active engagement improves primary auditory cortical neurons' ability to discriminate temporal modulation. J Neurosci. 2012;32:9323–9334. doi: 10.1523/JNEUROSCI.5832-11.2012. [DOI] [PMC free article] [PubMed] [Google Scholar]
- Otazu GH, Tai LH, Yang Y, Zador AM. Engaging in an auditory task suppresses responses in auditory cortex. Nat Neurosci. 2009;12:646–654. doi: 10.1038/nn.2306. [DOI] [PMC free article] [PubMed] [Google Scholar]
- Quiroga RQ, Nadasdy Z, Ben-Shaul Y. Unsupervised spike detection and sorting with wavelets and superparamagnetic clustering. Neural Comput. 2004;16:1661–1687. doi: 10.1162/089976604774201631. [DOI] [PubMed] [Google Scholar]
- Ryan A. Hearing sensitivity of the Mongolian gerbil, Meriones unguiculatis. J Acoust Soc Am. 1976;59:1222–1226. doi: 10.1121/1.380961. [DOI] [PubMed] [Google Scholar]
- Supèr H, van der Togt C, Spekreijse H, Lamme VA. Internal state of monkey primary visual cortex (V1) predicts figure-ground perception. J Neurosci. 2003;23:3407–3414. doi: 10.1523/JNEUROSCI.23-08-03407.2003. [DOI] [PMC free article] [PubMed] [Google Scholar]
- Sutter ML, Shamma SA. In: The auditory cortex. Winer JA, Schreiner CE, editors. New York: Springer; 2011. pp. 617–643. [Google Scholar]
- Wright BA, Fitzgerald MB. The time course of attention in a simple auditory detection task. Percept Psychophys. 2004;66:508–516. doi: 10.3758/BF03194897. [DOI] [PubMed] [Google Scholar]
- Wright BA, Buonomano DV, Mahncke HW, Merzenich MM. Learning and generalization of auditory temporal-interval discrimination in humans. J Neurosci. 1997;17:3956–3963. doi: 10.1523/JNEUROSCI.17-10-03956.1997. [DOI] [PMC free article] [PubMed] [Google Scholar]
- Wright BA, Sabin AT, Zhang Y, Marrone N, Fitzgerald MB. Enhancing perceptual learning by combining practice with periods of additional sensory stimulation. J Neurosci. 2010;30:12868–12877. doi: 10.1523/JNEUROSCI.0487-10.2010. [DOI] [PMC free article] [PubMed] [Google Scholar]
- Yoshida T, Katz DB. Control of prestimulus activity related to improved sensory coding within a discrimination task. J Neurosci. 2011;31:4101–4112. doi: 10.1523/JNEUROSCI.4380-10.2011. [DOI] [PMC free article] [PubMed] [Google Scholar]