

Abstract
Reading disability is a brain-based difficulty in acquiring fluent reading skills that affects significant numbers of children. Although neuroanatomical and neurofunctional networks involved in typical and atypical reading are increasingly well characterized, the underlying neurochemical bases of individual differences in reading development are virtually unknown. The current study is the first to examine neurochemistry in children during the critical period in which the neurocircuits that support skilled reading are still developing. In a longitudinal pediatric sample of emergent readers whose reading indicators range on a continuum from impaired to superior, we examined the relationship between individual differences in reading and reading-related skills and concentrations of neurometabolites measured using magnetic resonance spectroscopy. Both continuous and group analyses revealed that choline and glutamate concentrations were negatively correlated with reading and related linguistic measures in phonology and vocabulary (such that higher concentrations were associated with poorer performance). Correlations with behavioral scores obtained 24 months later reveal stability for the relationship between glutamate and reading performance. Implications for neurodevelopmental models of reading and reading disability are discussed, including possible links of choline and glutamate to white matter anomalies and hyperexcitability. These findings point to new directions for research on gene-brain-behavior pathways in human studies of reading disability.
Keywords: decoding, individual differences, MRS, phonological processing, reading, reading disability
Introduction
Reading Disability (RD) is as a brain-based developmental disorder associated with deficits in phonological processing, especially phonological awareness, the metalinguistic understanding that spoken words are made of smaller units (Bradley and Bryant, 1978; Snowling, 1981; Lyon et al., 2003). Studies have identified rare candidate gene variations including DYX1C1, DCDC2, KIAA0319, GRIN2A, and ROBO1, as well as common variations, e.g., COMT, associated with RD that are related to neuronal migration, cell adhesion, axonal guidance, and neurotransmitters, such as glutamate and dopamine (Poelmans et al., 2011; Peterson and Pennington, 2012; Landi et al., 2013). At a more macroscopic level, neuroimaging studies have identified differences in fractional anisotropy implicating abnormalities in white matter tracts (Klingberg et al., 2000; Beaulieu et al., 2005; Niogi and McCandliss, 2006; Dougherty et al., 2007; Hoeft et al., 2007) and reduced gray matter volume (Frye et al., 2010; Richlan et al., 2012). Functional studies indicate both reduced activation (Richlan et al., 2009, 2010; Maisog et al., 2008) and connectivity (Horwitz et al., 1998; Pugh et al., 2000; Beaulieu et al., 2005; Kalia, 2008), and oscillatory anomalies (Lehongre et al., 2011) in RD in the left hemisphere reading network including key nodes centered around temporoparietal, occipitotemporal, inferior frontal, and subcortical regions (Schlaggar and McCandliss, 2007; Pugh et al., 2010, 2013).
Although increasing numbers of studies link genetic, structural, and functional data to reading and language, research on neurochemistry in the context of reading development is sparse. Such research is timely and critical, given that differences in relative concentrations of the neurometabolites have recently been directly linked to the integrity of networks that support the development of cognitive skills (Perlov et al., 2009; Singh, 2012; Bruno et al., 2013). Magnetic Resonance Spectroscopy (MRS) is used to acquire noninvasive in vivo measures of neurometabolites including N-acetyl-aspartate (NAA), choline (Cho), creatine (Cr), GABA, and glutamate (Glu). Abnormal levels of Cho (Courvoisie et al., 2004; Perlov et al., 2009; Essa et al., 2012; Brown et al., 2013) and Glu (Carrey et al., 2002; Courvoisie et al., 2004; Essa et al., 2012; Brown et al., 2013) have frequently been reported in ADHD and autism. Abnormal Cho is hypothesized to reflect abnormal white matter organization and/or cell membrane turnover (Pfefferbaum et al., 1999; Gass and Richards, 2013), whereas heightened Glu can reflect hyperexcitability. GABA is less well studied to date, but preliminary evidence suggests a role in neurodevelopmental disorders (Edden et al., 2012; Rojas et al., 2014).
This study examines neurochemistry early in the process of learning to read, which is critical for understanding the functional significance of neurometabolite-reading relations. To date, three previous studies have focused on Cho and NAA, and reported Cho abnormalities in samples of RD adults (Richardson et al., 1997; Rae et al., 1998; Laycock et al., 2008; Bruno et al., 2013). Thus, the extent to which any neurometabolite abnormality is a result of life-long experience in reading or it exists early in development is largely unknown. It is also unknown whether neurometabolites, such as Glu and GABA, are associated with RD.
Materials and Methods
Method.
We measured NAA, Cho, Glu, and GABA levels (relative to a Cr baseline) in a sample of beginning readers whose reading abilities range along a continuum from conventionally RD to superior readers (Table 1). The development of reading skills was assessed at entry into the study and reassessed 24 months later (Time 2) in a subset of the participants (N = 45) to examine longer-term reading outcomes. MRS data were acquired at Time 1 from a midline occipital region (Fig. 1, bottom left) chosen because measures from this region of interest (ROI) have been well validated and shown to be sensitive to individual (and clinically relevant) differences in GABA (and GLU) in a number of previous MRS studies from our group (Rothman et al., 1993; Sanacora et al., 1999, 2003). It is also noteworthy that although visual cortex is not usually a primary focus in studies of reading and reading disability, we find that for children in from the same study, voxels in this portion of the visual cortex (along with temporoparietal and occipitotemporal sites) show activation that covaries with reading ability/disability (Pugh et al., 2013). Finally, we validated our findings of associations between Cho and reading scores against an independent, publicly available, database generated by the NIH pediatric MRI Study of Normal Brain Development
Table 1.
Descriptive statistics for the entire sample and for RD and TD subsets
| Mean (SD) |
|||
|---|---|---|---|
| Entire sample | RD | TD | |
| N | 75 | 10 | 47 |
| Gender | 47 M; 28 F | 6 M; 4 F | 28 M; 19 F |
| Age | 7.68 (0.70) | 7.45 (0.56) | 7.59 (0.67) |
| Age-normed standard scores | |||
| TOWRE SWE | 106.16 (15.65) | 84.00 (3.94) | 115.70 (11.02)** |
| TOWRE PDE | 103.68 (14.15) | 84.60 (4.60) | 111.40 (11.61)** |
| TOWRE WRE | 106.09 (17.50) | 81.20 (3.22) | 116.55 (12.96)** |
| WJ-III LWID | 111.40 (15.25) | 92.40 (4.43) | 120.36 (11.52)** |
| WJ-III PC | 105.27 (13.70) | 88.60 (3.95) | 113.09 (10.17)** |
| CTOPP BW | 10.93 (2.46) | 10.00 (2.16) | 11.31 (2.70) |
| CTOPP EL | 11.63 (3.29) | 8.10 (2.23) | 12.44 (3.34)** |
| PPVT III | 112.00 (12.88) | 107.50 (8.91) | 113.30 (13.98) |
| WASI block design | 109.64 (17.23) | 102.10 (20.15) | 112.07 (17.53) |
| Metabolite concentrations (ratios to Cr) | |||
| GABA | 0.18 (0.02) | 0.18 (0.02) | 0.18 (0.02) |
| Glu | 0.97 (0.21) | 1.10 (0.19) | 0.94 (0.21)* |
| Cho | 0.18 (0.02) | 0.19 (0.01) | 0.18 (0.02)* |
| NAA | 0.95 (0.07) | 0.97 (0.06) | 0.94 (0.07) |
Standard scores mean = 100, SD = 15 except for CTOPP, for which mean = 10, SD = 3. TOWRE, Tests of Word Reading Efficiency (sight word efficiency, phonemic decoding efficiency); WJ-III, Woodcock-Johnson Tests of Achievement (letter word identification, passage comprehension); CTOPP, Comprehensive Test of Phonological Processing (elision, blending words); PPVT III, Peabody Picture Vocabulary Test; WASI, Wechsler Abbreviated Scales of Intelligence.
**p < 0.001;
*p < 0.05.
Figure 1.
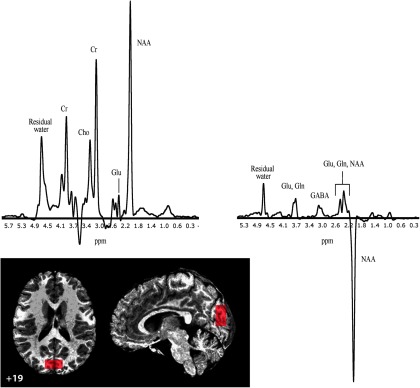
Sagittal and axial sections depicting the 3 × 3 × 1.5 cm MRS voxel in the midline occipital cortices with MNI z-coordinate of voxel center indicated (bottom left). Metabolite spectra in a single participant: MR subspectrum at 4-telsa (top left), cortical GABA detected by J-editing (top right). Gln, Glutamine.
Participants.
Seventy-five speakers of English (47 males; 28 females) participated in the experiment in exchange for payment. Participants were recruited through the Yale Reading Center and informed consent and assent were obtained in compliance with Yale University's human subjects protection guidelines. All participants had normal or corrected-to-normal vision, normal hearing, with no history of neurological impairment. Participants ranged in age from 6.1 to 10.1 years at time at Time 1 testing (mean, 7.68). Forty-five of the participants who had usable MRS data at Time 1 returned for Time 2 testing 24 months later (mean age, 10.1). Examination of the scores on our reading battery at Time 1 revealed that 10 (7.5%) of our sample had standard scores of 85 or less (at or below the 15th percentile) on a composite score from the Tests of Word Reading Efficiency (TOWRE) score (based on word and pseudoword reading subtests) which falls into conventional RD range. For the purpose of between group analysis, we contrasted this RD group to those with average to superior reading ability, which included 47 children with a TOWRE score of greater than a standard score of 100. The remainder of the children with TOWRE scores >85 but ≤100 (N = 18) were excluded from these between-group comparisons (though their data contribute to the primary brain-behavior regression analyses described below).
Behavioral testing.
Before functional imaging, participants completed a behavioral battery to characterize their reading, language, and general cognitive skills. Measures were obtained from five standardized test batteries and are reported in Table 1: the Woodcock-Johnson III Tests of Achievement (WJ III; Woodcock et al., 2003); the TOWRE (Torgesen et al., 1999); the Comprehensive Test of Phonological Processing (CTOPP; Wagner et al., 1999); Peabody Picture Vocabulary Test (PPVT III; Dunn and Dunn, 1997); and the Wechsler Abbreviated Scale of Intelligence (WASI; Wechsler, 1999). Data from four participants on the CTOPP and from one participant on the PPVT were not obtained due to study attrition. For the purposes of the current study, and following from the recent report on reading and Cho (Bruno et al., 2013), we focused primarily in the tests of basic component reading skills in relation to neurometabolite levels: a timed measure of pseudoword decoding efficiency (PDE from the TOWRE), a timed measure of sight word reading (SWE from TOWRE), and a measure of connected text comprehension (passage comprehension test from WJ III). A reading composite (RC) score was computed for each child based on the word and pseudoword decoding on the TOWRE and text comprehension scores from WJ III (see Brain-behavioral analysis for details). In addition to the direct measure of reading skill, a measure of word knowledge (receptive vocabulary from PPVT) was included in analyses as well as a composite measure of phonological awareness (PA; based on elision and word blending measures from CTOPP), given the extensive literature documenting the importance of these factors to individual differences in reading outcomes (Snowling, 1981; Braze et al., 2007). Analyses also included WASI Block Design, a measure of nonverbal IQ, as an initial test of whether any observed correlations are reading-specific.
MR spectroscopy.
MRS was performed with a 4-tesla Bruker Avance MR system using a spin-echo J-editing technique (Rothman et al., 1993) to measure edited GABA and nonedited Cho, Cr, NAA, and Glu. Subjects lay supine in the magnet while watching commercial animated movies with sound muted. A 7 cm 1H-tuned surface coil was placed against the back of the head to increase sensitivity. For voxel positioning, gradient-echo scout images, repetition time (TR) 100 ms, echo time (TE) 11.7 ms, with a nominal axial orientation were acquired from slices 1.5 mm thick, with no slice gap and a field-of-view of 200 mm, divided into 128 × 128 pixels. The 3 × 3 × 1.5 cm voxel was positioned in the midline of both occipital lobes and included aspects of the lingual gyrus, calcarine sulcus, and cuneus. The water signal was used to calibrate the pulse power for the MRS sequences. Shimming was performed using FASTERMAP (Shen et al., 1997). The water signal was suppressed with six applications of chemical shift selected sequence using a 1000 Hz offset swept amplitude pulse. Volume excitation used a slice selective Shinnar-Le Roux pulse, followed by a 180° slice selective pulse. The 3D volume selection was obtained using outer volume suppression and image selected volume spectroscopy. Outer volume suppression used an adiabatic full passage pulse in x, y, and z directions. Subspectra with and without editing inversion of the GABA C3 resonance were acquired with 1024 data points in a 410 ms acquisition, a 3 s repetition time, and a 68 ms echo time. To minimize macromolecule contamination, the GABA-editing sequence used a DANTE pulse applied symmetrically about the refocusing pulse and was run in blocks of eight acquisitions, applying the DANTE at 1.89 and 1.31 ppm on alternate blocks for a total acquisition period of 22 min (Henry et al., 2001).
Quantitative T1 images were obtained using a rapid inversion-recovery sampling method (Mason and Rothman, 2002) optimized statistically for sensitivity (Mason et al., 1997) and a B1 map was acquired to correct for surface coil inhomogeneities. The quantitative images of T1 were converted to images of percentage gray matter, white matter, and CSF, called graded segmented images (Mason and Rothman, 2002). From the segmented images and the known dimension and position of the MRS voxel the composition of the MRS voxel was determined as percentages of gray matter, white matter, and CSF (Mason and Rothman, 2002).
Linear combination spectral fitting was applied to the subspectrum obtained with the DANTE pulse applied at 1.31 ppm to determine the area of the resonances of Cho, Glu, NAA, and Cr. The unedited subspectrum was fitted using a basis set of metabolite spectra. The metabolites fitted were aspartate, glutamate, glutamine, NAA, NAAG, creatine, phosphocreatine, myoinositol, choline, phosphorylcholine, glycerophosphorylcholine, and scylloinositol. The metabolite basis signals were measured with the J-editing acquisition sequence except for NAA and phosphocreatine, which were simulated. The results for NAA and NAAG were combined and recorded as NAA, creatine and phosphocreatine were combined and recorded as creatine, and the three choline-containing compounds were combined and recorded as choline (Fig. 1, top left and right show spectra from a representative subject). In three subjects, not all metabolites were determined due to poor spectral quality. After spectral fitting, uncertainties of individual measurements were assessed using a Monte-Carlo analysis, in which the least-squares spectral fits were treated with random Gaussian noise whose SD was equal to that of the raw data and refitted using 20 repetitions to estimate the SDs of the uncertainty for each metabolite measure. No data exceeded the criterion for exclusion, which was a SD greater than three times the average SD for the full set of studies (Valentine et al., 2011).
For GABA analysis in the edited subtraction spectrum, we used software written in MATLAB (MathWorks). Each free induction decay (FID) was phase-locked using the water FID and frequency-aligned using the resonances of NAA, Cr, and Cho. Each of the pairs of subspectra (27 per experiment) was subtracted to obtain an FID of the edited GABA signal, and then apodized. Quality control was performed by excluding any pairs whose difference GABA spectra showed residual intensity from Cho or Cr in the subtraction spectrum (absorptive and dispersive), which also minimizes the effects of motion. After exclusion of such pairs, the remaining spectra were combined and the area of the GABA resonance at 3ppm was determined using automated manual integration following automated baseline correction. GABA was able to be determined in each subject. The macromolecular contamination was evaluated in the GABA spectrum using two methods: metabolite nulling (Behar et al., 1994; Rothman et al., 1994; Shen et al., 2004) and frequency switching symmetrically about the coupled macromolecular resonance (Henry et al., 2001). In both methods, there was no evidence of macromolecular contamination of the resonance, resulting in a basis set for fitting that did not include a macromolecular signal. The area of the Cr resonance was used as an internal reference (Rothman et al., 1993). Glu, Cho, NAA, and GABA were reported as a ratio of the metabolite resonance area relative to the Cr resonance area. The convention in the field is to analyze metabolite concentrations scaled to a baseline, such as water or Cr. However, to demonstrate that any relations between metabolite concentrations and reading ability were driven by the numerator and not the denominator when scaled to the Cr baseline, we determined that the correlation between Cr and our reading skill composite was not significant (r = 0.003, p > 0.978). Moreover, we conducted multiple regression analyses in which we entered raw concentrations for our metabolites of interest as well as Cr concentration. All results with our metabolites of interest remained unchanged and were not attributable to the Cr baseline.
Brain-behavior analyses.
In line with our standard analytic approach (Pugh et al., 2013) we computed a RC by entering raw scores on TOWRE sight word efficiency, TOWRE phonemic decoding efficiency, and WJ III passage comprehension into Principal Components Analysis (PCA) to identify shared variance across the three tests. The PCA is used to enhance statistical power (i.e., it reduces the number of highly correlated dependent variables and allows us to focus the analysis on systematic variance among the theoretically related reading measures). Standard scores were not used because our focus is on the relation between neurometabolite levels and raw skill differences, not skill differences standardized to an age or grade norm. Results of the PCA on Time 1 data found a single underlying dimension of common variation that accounted for 91% (eigenvalue = 2.73) of the total variance among the three input variables. A single principal component was also obtained for Time 2 data, accounting for 76% (eigenvalue = 2.28) of the total variance. Principal component scores were extracted for each individual and correlated with neurometabolite concentrations. Because our measures of PA were both obtained from the CTOPP and both measures included the same number of test items, we were able to create a composite PA score by averaging scores on the elision and blending subtests.
Results
Brain-behavior correlations
Current research suggests that RD is best understood as a graded disorder (Fletcher, 2012) in which relevant cognitive and neurobiological differences between skilled and less skilled readers fall on a continuum (Shaywitz et al., 1992). Thus, we used continuous analyses of the MRS and behavioral data as in other reports (Bruno et al., 2013) as our primary brain/behavior analysis scheme.
Table 2 shows the Pearson correlation coefficient (r) values between, Glu, Cho, GABA, NAA, and reading, reading-related, and nonverbal IQ scores. Time 1 RC scores were significantly and inversely correlated with both Cho and Glu concentrations (Note that with a conservative correction for multiple comparisons, at p < 0.05, Glu maintains significance but Cho is marginal in that test. However as reported below an independent database sample replicates this Cho/reading relationship; Table 2 and Fig. 2.). Time 1 PA and vocabulary were significantly and inversely correlated with Glu but the correlation of these measures with Cho was not significant. No significant correlations of NAA or GABA with RC, PA, or vocabulary were obtained (Table 2). None of the measured neurometabolites were significantly associated with nonverbal IQ (Table 2). Therefore, IQ was not considered further in the analyses. Because these analyses used raw scores, unadjusted for age, and because neurometabolite levels can differ by tissue type, we also report partial correlation analyses in Table 2 showing that the correlations remained significant when controlling for the following potential nuisance factors: age at time of MRS testing and gray matter volume measured for each participant at the occipital MRS voxel (we also conducted analyses that controlled for variability in white matter volume and gender; these covariates were not significant and thus not included in the analyses reported here).
Table 2.
Correlations among metabolites ratios and composite reading score, composite PA score, vocabulary, and nonverbal IQ scores
| Reading composite | PA composite | Vocabulary | Nonverbal IQ | |
|---|---|---|---|---|
| Glu | −0.32 (−0.25) | −0.35 (−0.30) | −0.31 (−0.23) | −0.11 (−0.06) |
| N = 72, p = 0.006* | N = 67, p = 0.004* | N = 70, p = 0.010* | N = 71, p = 0.351 | |
| Cho | −0.26 (−0.24) | −0.09 (−0.06) | −0.14 (−0.11) | 0.00 (0.04) |
| N = 73, p = 0.029 | N = 68, p = 0.486 | N = 71, p = 0.228 | N = 72, p = 0.968 | |
| GABA | −0.11 (−0.02) | −0.13 (−0.06) | −0.21 (−0.12) | −0.04 (0.03) |
| N = 75, p = 0.336 | N = 70, p = 0.281 | N = 73 p = 0.080 | N = 74, p = 0.770 | |
| NAA | −0.11 (−0.10) | −0.08 (−0.07) | −0.13 (−0.12) | 0.16 (0.16) |
| N = 72, p = 0.350 | N = 67, p = 0.507 | N = 70, p = 0.298 | N = 72, p = 0.190 |
Partial correlations removing the linear effects of age at time of testing and gray matter volume are shown in parenthesis. P values are shown for zero-order correlations only. Significant effects are indicated in bold.
*Indicates significance after correction for multiple comparisons.
Figure 2.

Relationship between metabolites and reading ability. Scatterplot of correlations between (a) Glu and Reading Composite scores, and (b) Cho and Reading Composite scores. Readers meeting criteria for TD readers are shown in dark gray squares, RD readers are shown in black triangles, and readers that did not meet either group criteria are shown in light gray circles. Bar graphs present (c) Glu and (d) Cho mean levels in TD and RD readers. Error bars represent SEM. Metabolites levels are expressed as ratios to Cr.
For those variables showing a significant correlation between neurometabolite concentrations and behavior at Time 1 we conducted additional analyses between MRS scores from initial Time 1 and follow-up behavioral testing for the 45 participants who returned for testing 24 months later (Time 2). The correlation between Cho and RC was not significant (r(45) = −0.21, p = 0.17), nor were the correlations between Glu and PA (r(44) = −0.15, p = 0.32) and Glu and vocabulary (r(44) = −0.10, p = 0.53). Only the negative correlation between Glu and the RC was still reliable (r(45) = −0.32, p = 0.03).
TD/RD group comparisons
In addition to our primary analyses with reading as a continuous measure, we also conducted univariate ANOVA to examine conventional RD versus typically developing (TD) group contrasts both to reinforce our correlational findings and to acquire means and SDs for the clinically defined groups. Following conventional diagnostic criteria (see Materials and Methods, Participants), our sample yielded 10 RD and 47 TD children (data from 18 children were not included in this group analysis because their reading scores were below criterion for TD but above criterion for RD). As indicated in Table 1, children in these groups did not differ on age or performance IQ; nor did they differ on gray matter volume in the MRS voxel (mean RD = 53.20; TD = 54.48, F = 0.968, p = 0.33). Thus, in contrast to the correlational analyses in which we tested for a relation between performance IQ and metabolite levels and statistically controlled for variability in age and gray matter volume, these factors are not included in the group ANOVAs.
Children with RD showed reliably higher concentrations than TD children for both Glu (mean TD = 0.95; RD = 1.10; F(1,54) = 4.88, p = 0.032; Cohen's d = 0.79) and Cho (TD = 0.179 RD = 0.194; F(1,55) = 4.50, p = 0.039; Cohen's d = 0.94). As seen in Figure 2, this subset of conventionally defined RD children consistently falls in the high range on both Glu and Cho scores relative to TD children.
Independent replication
Data were obtained from a publicly available database collected by the NIH MRI Study of Normal Brain Development (http://pediatricmri.nih.gov, release 5). Eighty-five participants from this database (age range, 5–18 years) provided data on reading skill measures (WJ-III Letter Word Identification and Passage Comprehension) and Cho concentrations (expressed as a Cho/Cr ratio as in our analyses) obtained with MRS for a similar midline occipital voxel (data on Glu and GABA are not included in this database). Although the NIH sample does include a wide range of reading scores, it is part of a normative study and only a small subset of these children would meet conventional criteria for RD; however, as noted, RD is seen as a graded disorder and the range of skills in the database is broad enough to allow continuous analyses that parallel those used in our study. Correlations of magnitude similar to ours were obtained between Cho and word reading (r(80) = −0.31, p < 0.01) as well as passage comprehension (r(80) = −0.33, p < 0.01) were obtained while controlling for age, and gray matter volume, and full scale IQ. Consistent with the finding from our pediatric sample, this negative correlation indicates that higher concentrations of Cho were associated with lower reading scores.
Discussion
The current study is the first to examine neurochemistry in typically and atypically developing children when the neurocircuits that come to support skilled reading are still developing. Additionally, this study provides the first look into the relationship between children's reading skills and the major excitatory and inhibitory neurotransmitters, Glu and GABA. Analyses showed that Cho and Glu concentrations were inversely correlated with reading and related linguistic measures such that higher concentrations were associated with poorer performance. This pattern is also evident in a categorical analysis in which conventionally defined RD children clustered in the high range on both Glu and Cho levels (Fig. 2). The finding that heightened Glu was associated with poorer reading (at two time points) is a first; moreover, its association with poorer skills on two key cognitive predictors of children's reading outcomes, PA and vocabulary (Braze et al., 2007), adds new information to current understanding of atypically developing neurocircuits in RD. The relationship between Cho and reading scores at Time 1 not only reinforces two previous findings with adult TD/RD samples (and the NIH database replication sample reported here) but also indicates for the first time that this relationship is functionally significant very early in the development of reading skills.
Specific group contrasts, for those children meeting conventional criteria for RD relative to TD controls, reinforced the continuous analyses. Thus, RD readers show elevated Glu and Cho relative to TD children. Finally, a replication analysis with an independent pediatric sample in a publicly available NIH database was conducted (where both reading scores and MRS values for Cho obtained from a similar midline occipital region were available) and despite fewer conventionally defined RD children and a much wider age range, regression analyses replicated the Cho finding found in our longitudinal sample; thus, higher Cho was reliably associated with lower reading scores.
As noted, the association between elevated Glu and impaired reading has not previously been studied. However, studies of Glu in other neurodevelopmental disorders, including ADHD (Carrey et al., 2007) and autism (Brown et al., 2013), have reported abnormal Glu or Glx levels (where Glx reflects a glutamate and glutamine mixture) in the clinical samples relative to controls. Elevated Glu levels have been hypothesized to reflect hyperexcitability in these disorders that impacts coherence of neuronal networks involved in learning, and consolidation of learning (Essa et al., 2012).
That this pattern of elevated Glu is seen in children with RD and might reflect hyperexcitability fits with several aspects of RD symptomology seen at both the behavioral and neural levels of analysis. Those with RD seem to process information with heightened “noise” and instability (Sperling et al., 2006). Behaviorally, children with RD show unstable trial-to-trial performance on behavioral measures including reaction time and accuracy (Sperling et al., 2006), and in neuroimaging studies greater variability is reported (Hornickel and Kraus, 2013; Pugh et al., 2013). To illustrate, Hornickel and Kraus (2013) exploring the complex auditory brainstem response with EEG, found that participants with RD had considerably greater moment-to-moment variance than control participants. Moreover, two candidate genes implicated in abnormal neuronal migration in RD (LoTurco et al., 1991; LoTurco et al., 1995), DCDC2 and KIAA0319, have both been implicated in animal models demonstrating hyperexcitability through spontaneous firing in the auditory cortex, potentially reflecting abnormal glutamatergic activity (Centanni et al., 2013; Che et al., 2014). In summary, although the current study implicating elevated Glu in pediatric RD does not identify a specific mechanism, these data in the context of other findings might suggest that neuronal hyperexcitability contributes to learning deficits in RD.
On a speculative note, the finding that for the current sample of beginning readers that Glu, but not GABA, predicted reading and reading-related deficits could have potential implications for neural oscillatory processing deficit accounts that have become a major new focus in RD research. GABA is considered to play a key role in the modulation of gamma oscillations (Gray et al., 1989; Muthukumaraswamy et al., 2009; Buzsáki and Wang, 2012) and oscillations in the auditory cortex in the low-gamma-frequency range (30–40 Hz) that coincide with the rate of the strongest modulation in phonemes (∼30 Hz; Giraud et al., 2007) have been shown to be anomalous in dyslexics (Lehongre et al., 2011). On the other hand, slow-frequency theta oscillations (4–8 Hz) that coincide with syllable rate (4 Hz) has also been implicated in RD (Morillon et al., 2010), and although the role of neurotransmitters in theta oscillations is complex, Glu and Cho have been implicated as having a key modulatory role (Gallinat et al., 2006; Pignatelli et al., 2012). That Glu and Cho, but not GABA, were significantly correlated with reading skill in our sample of emergent readers tempts speculation that theta oscillation might be most impacted in these children. Of course, such speculation awaits future studies on links between neurotransmitters, metabolites, and frequency of oscillations measured with EEG or MEG, but the data are provocative.
The Cho results at Time 1 are consistent with two previous studies of adults reporting elevated Cho in RD samples, one in a cerebellar ROI (Laycock et al., 2008) and the other in a left hemisphere temporoparietal ROI (Bruno et al., 2013). The study of Bruno et al. (2013) is noteworthy in the context of the current report in that they tested a relatively large sample (N = 31) of adults ranging from RD to superior readers and, as in the current report, they used continuous analyses and also reported a negative correlation (similar in magnitude to the current sample and the NIH database sample) between word and pseudoword reading and Cho. One early MRS study (Rae et al., 1998) reported reduced, as opposed to elevated, Cho scores for RD measured in temporoparietal and cerebellar regions, but this discrepancy may be due to baseline differences. A Cho/NAA (Rae et al., 1998) ratio score was used as opposed to the more commonly used Cho/Cr ratio score (Rothman et al., 1993; Bruno et al., 2013). Thus with the two pediatric samples reported here, there are now four studies reporting an inverse relationship between Cho and reading ability across various developmental stages and across various ROIs that have been previously identified as part of the circuitry for fluent reading, including cerebellum, temporoparietal, and midline occipital (Pugh et al., 2013).
Cho levels have been found to be associated with membrane turnover, cellular density, and white matter density (Ross and Sachdev, 2004; de Diego-Adeliño et al., 2013). Laycock et al. (2008) speculated that elevated Cho in RD adults might reflect excessive connectivity or abnormal myelination. An early study used phosphorus-MRS for a small sample of RD adult males and found higher phosophomonoester/total phosphorus ratios; these data were interpreted as reflecting abnormal membrane phospholipid metabolism in RD and as potentially implicating abnormal Cho in RD as a function of membrane turnover abnormalities (Richardson et al., 1997). The current findings add to a larger literature that indicates that elevated Cho is frequently seen across a range of clinical populations including depression (de Diego-Adeliño et al., 2013), OCD (Brennan et al., 2013), ADHD (Courvoisie et al., 2004; Sagvolden et al., 2005, 2009), autism, (Baruth et al., 2013; Brown et al., 2013; Rojas et al., 2014), bipolar disorder (Michael et al., 2009), and traumatic head injury (Garnett et al., 2001; Shutter et al., 2004; Yeo et al., 2006). Although the mechanism(s) linking Cho to abnormal function remain to be determined, and indeed might differ across disorders, abnormal Cho levels appear to be a marker of atypical brain metabolism in general. Given previous evidence showing abnormal white matter in RD (Niogi and McCandliss, 2006) the current findings encourage speculation that the observed elevation in Cho reflects abnormal myelination in these children.
Conclusions
The current pediatric sample is a first to examine the role of multiple neurometabolites in across a range of reading abilities in developing readers. The major findings revealed an inverse relationship between both Glu and Cho and reading and phonological skills. Follow-up behavioral testing on a large subset of these children indicated that Glu levels measured at age 7 were still predictive of reading performance 24 months later. This unprecedented examination of reading acquisition and the role of neurometabolites in emergent reading provides new information on potential neurobiologic pathways (e.g., hyperexcitability and abnormal white matter organization) in atypical development, and points to new directions for research on gene-brain-behavior pathways in reading disability.
Footnotes
This study is supported by NICHD P01 HD001994 to Haskins Laboratories (Carol Fowler) and NICHD R01 HD048830 to Yale University (K.R.P.). The 4T MR system was partially purchased by a generous gift from the W.M. Keck Foundation. Data used in the preparation of this article were obtained from the NIH Pediatric MRI Data Repository created by the NIH MRI Study of Normal Brain Development. This is a multisite, longitudinal study of typically developing children from ages newborn through young adulthood conducted by the Brain Development Cooperative Group and supported by NICHD, NIDA, NIHM, and NINDS (Contract nos. N01-HD02-3343, N01-MH9-0002, and N01-NS-9-2314, -2315, -2316, -2317, -2319, -2320). This paper reflects the views of the authors and may not reflect the opinions or views of the NIH.
The authors declare no competing financial interests.
References
- Baruth JM, Wall CA, Patterson MC, Port JD. Proton magnetic resonance spectroscopy as a probe into the pathophysiology of autism spectrum disorders (ASD): a review. Autism Res. 2013;6:119–133. doi: 10.1002/aur.1273. [DOI] [PubMed] [Google Scholar]
- Beaulieu C, Plewes C, Paulson LA, Roy D, Snook L, Concha L, Phillips L. Imaging brain connectivity in children with diverse reading ability. Neuroimage. 2005;25:1266–1271. doi: 10.1016/j.neuroimage.2004.12.053. [DOI] [PubMed] [Google Scholar]
- Behar KL, Rothman DL, Spencer DD, Petroff OA. Analysis of macromolecule resonances in 1H NMR spectra of human brain. Magn Reson Med. 1994;32:294–302. doi: 10.1002/mrm.1910320304. [DOI] [PubMed] [Google Scholar]
- Bradley L, Bryant PE. Difficulties in auditory organisation as a possible cause of reading backwardness. Nature. 1978;271:746–747. doi: 10.1038/271746a0. [DOI] [PubMed] [Google Scholar]
- Braze D, Tabor W, Shankweiler DP, Mencl WE. Speaking up for vocabulary reading skill differences in young adults. J Learn Disabil. 2007;40:226–243. doi: 10.1177/00222194070400030401. [DOI] [PMC free article] [PubMed] [Google Scholar]
- Brennan BP, Rauch SL, Jensen JE, Pope HG., Jr A critical review of magnetic resonance spectroscopy studies of obsessive-compulsive disorder. Biol Psychiatry. 2013;73:24–31. doi: 10.1016/j.biopsych.2012.06.023. [DOI] [PMC free article] [PubMed] [Google Scholar]
- Brown MS, Singel D, Hepburn S, Rojas DC. Increased glutamate concentration in the auditory cortex of persons with autism and first-degree relatives: a 1H MRS study. Autism Res. 2013;6:1–10. doi: 10.1002/aur.1260. [DOI] [PMC free article] [PubMed] [Google Scholar]
- Bruno JL, Lu ZL, Manis FR. Phonological processing is uniquely associated with neuro-metabolic concentration. Neuroimage. 2013;67:175–181. doi: 10.1016/j.neuroimage.2012.10.092. [DOI] [PMC free article] [PubMed] [Google Scholar]
- Buzsáki G, Wang XJ. Mechanisms of gamma oscillations. Annu Rev Neurosci. 2012;35:203–225. doi: 10.1146/annurev-neuro-062111-150444. [DOI] [PMC free article] [PubMed] [Google Scholar]
- Carrey N, MacMaster FP, Sparkes SJ, Khan SC, Kusumakar V. Glutamatergic changes with treatment in attention deficit hyperactivity disorder: a preliminary case series. J Child Adolesc Psychopharmacol. 2002;12:331–336. doi: 10.1089/104454602762599871. [DOI] [PubMed] [Google Scholar]
- Carrey NJ, MacMaster FP, Gaudet L, Schmidt MH. Striatal creatine and glutamate/glutamine in attention-deficit/hyperactivity disorder. J Child Adolesc Psychopharmacol. 2007;17:11–17. doi: 10.1089/cap.2006.0008. [DOI] [PubMed] [Google Scholar]
- Centanni T, Booker A, Sloan A, Chen F, Maher B, Carraway R, Khodaparast N, Rennaker R, LoTurco J, Kilgard M. Knockdown of the dyslexia-associated gene Kiaa0319 impairs temporal responses to speech stimuli in rat primary auditory cortex. Cereb Cortex. 2013 doi: 10.1093/cercor/bht028. in press. [DOI] [PMC free article] [PubMed] [Google Scholar]
- Che A, Girgenti MJ, LoTurco J. The dyslexia-associated gene Dcdc2 is required for spike-timing precision in mouse neocortex. Biol Psychiatry. 2014 doi: 10.1016/j.biopsych.2013.08.018. in press. [DOI] [PMC free article] [PubMed] [Google Scholar]
- Courvoisie H, Hooper SR, Fine C, Kwock L, Castillo M. Neurometabolic functioning and neuropsychological correlates in children with ADHD-H: preliminary findings. J Neuropsychiatry Clin Neurosci. 2004;16:63–69. doi: 10.1176/appi.neuropsych.16.1.63. [DOI] [PubMed] [Google Scholar]
- de Diego-Adeliño J, Portella MJ, Gómez-Ansón B, López-Moruelo O, Serra-Blasco M, Vives Y, Puigdemont D, Pérez-Egea R, Álvarez E, Pérez V. Hippocampal abnormalities of glutamate/glutamine, N-acetylaspartate and choline in patients with depression are related to past illness burden. J Psychiatry Neurosci. 2013;38:107–116. doi: 10.1503/jpn.110185. [DOI] [PMC free article] [PubMed] [Google Scholar]
- Dougherty RF, Ben-Shachar M, Deutsch GK, Hernandez A, Fox GR, Wandell BA. Temporal-callosal pathway diffusivity predicts phonological skills in children. Proc Natl Acad Sci U S A. 2007;104:8556–8561. doi: 10.1073/pnas.0608961104. [DOI] [PMC free article] [PubMed] [Google Scholar]
- Dunn LM, Dunn ES. The Peabody Picture Vocabulary Test-III. Circle Pines, MN: American Guidance Service; 1997. [Google Scholar]
- Edden RA, Crocetti D, Zhu H, Gilbert DL, Mostofsky SH. Reduced GABA concentration in attention-deficit/hyperactivity DisorderReduced GABA concentration in ADHD. Arch Gen Psychiatry. 2012;69:750–753. doi: 10.1001/archgenpsychiatry.2011.2280. [DOI] [PMC free article] [PubMed] [Google Scholar]
- Essa MM, Vijayan RK, Castellano-Gonzalez G, Memon MA, Braidy N, Guillemin GJ. Neuroprotective effect of natural products against Alzheimer's disease. Neurochem Res. 2012;37:1829–1842. doi: 10.1007/s11064-012-0799-9. [DOI] [PubMed] [Google Scholar]
- Fletcher JM. Learning about learning disabilities. Ed 4. London: Academic; 2012. Classification and identification of learning disabilities. [Google Scholar]
- Frye RE, Liederman J, Malmberg B, McLean J, Strickland D, Beauchamp MS. Surface area accounts for the relation of gray matter volume to reading-related skills and history of dyslexia. Cereb Cortex. 2010;20:2625–2635. doi: 10.1093/cercor/bhq010. [DOI] [PMC free article] [PubMed] [Google Scholar]
- Gallinat J, Kunz D, Senkowski D, Kienast T, Seifert F, Schubert F, Heinz A. Hippocampal glutamate concentration predicts cerebral theta oscillations during cognitive processing. Psychopharmacology (Berl) 2006;187:103–111. doi: 10.1007/s00213-006-0397-0. [DOI] [PubMed] [Google Scholar]
- Garnett MR, Corkill RG, Blamire AM, Rajagopalan B, Manners DN, Young JD, Styles P, Cadoux-Hudson TA. Altered cellular metabolism following traumatic brain injury: a magnetic resonance spectroscopy study. J Neurotrauma. 2001;18:231–240. doi: 10.1089/08977150151070838. [DOI] [PubMed] [Google Scholar]
- Gass A, Richards TL. Serial proton magnetic resonance spectroscopy of normal-appearing gray and white matter in MS. Neurology. 2013;80:17–18. doi: 10.1212/WNL.0b013e31827b1b4c. [DOI] [PubMed] [Google Scholar]
- Giraud AL, Kleinschmidt A, Poeppel D, Lund TE, Frackowiak RS, Laufs H. Endogenous cortical rhythms determine cerebral specialization for speech perception and production. Neuron. 2007;56:1127–1134. doi: 10.1016/j.neuron.2007.09.038. [DOI] [PubMed] [Google Scholar]
- Gray CM, König P, Engel AK, Singer W. Oscillatory responses in cat visual cortex exhibit inter-columnar synchronization which reflects global stimulus properties. Nature. 1989;338:334–337. doi: 10.1038/338334a0. [DOI] [PubMed] [Google Scholar]
- Henry PG, Dautry C, Hantraye P, Bloch G. Brain GABA editing without macromolecule contamination. Magn Reson Med. 2001;45:517–520. doi: 10.1002/1522-2594(200103)45:3<517::AID-MRM1068>3.0.CO;2-6. [DOI] [PubMed] [Google Scholar]
- Hoeft F, Meyler A, Hernandez A, Juel C, Taylor-Hill H, Martindale JL, McMillon G, Kolchugina G, Black JM, Faizi A, Deutsch GK, Siok WT, Reiss AL, Whitfield-Gabrieli S, Gabrieli JD. Functional and morphometric brain dissociation between dyslexia and reading ability. Proc Natl Acad Sci U S A. 2007;104:4234–4239. doi: 10.1073/pnas.0609399104. [DOI] [PMC free article] [PubMed] [Google Scholar]
- Hornickel J, Kraus N. Unstable representation of sound: a biological marker of dyslexia. J Neurosci. 2013;33:3500–3504. doi: 10.1523/JNEUROSCI.4205-12.2013. [DOI] [PMC free article] [PubMed] [Google Scholar]
- Horwitz B, Rumsey JM, Donohue BC. Functional connectivity of the angular gyrus in normal reading and dyslexia. Proc Natl Acad Sci U S A. 1998;95:8939–8944. doi: 10.1073/pnas.95.15.8939. [DOI] [PMC free article] [PubMed] [Google Scholar]
- Kalia M. Brain development: anatomy, connectivity, adaptive plasticity, and toxicity. Metabolism. 2008;57:S2–S5. doi: 10.1016/j.metabol.2008.07.009. [DOI] [PubMed] [Google Scholar]
- Klingberg T, Hedehus M, Temple E, Salz T, Gabrieli JD, Moseley ME, Poldrack RA. Microstructure of temporo-parietal white matter as a basis for reading ability: evidence from diffusion tensor magnetic resonance imaging. Neuron. 2000;25:493–500. doi: 10.1016/S0896-6273(00)80911-3. [DOI] [PubMed] [Google Scholar]
- Landi N, Frost SJ, Mencl WE, Preston JL, Jacobsen LK, Lee M, Yrigollen C, Pugh KR, Grigorenko EL. The COMT Val/Met polymorphism is associated with reading-related skills and consistent patterns of functional neural activation. Dev Sci. 2013;16:13–23. doi: 10.1111/j.1467-7687.2012.01180.x. [DOI] [PMC free article] [PubMed] [Google Scholar]
- Laycock R, Crewther DP, Crewther SG. The advantage in being magnocellular: a few more remarks on attention and the magnocellular system. Neurosci Biobehav Rev. 2008;32:1409–1415. doi: 10.1016/j.neubiorev.2008.04.008. [DOI] [PubMed] [Google Scholar]
- Lehongre K, Ramus F, Villiermet N, Schwartz D, Giraud AL. Altered low-gamma sampling in auditory cortex accounts for the three main facets of dyslexia. Neuron. 2011;72:1080–1090. doi: 10.1016/j.neuron.2011.11.002. [DOI] [PubMed] [Google Scholar]
- LoTurco JJ, Blanton MG, Kriegstein AR. Initial expression and endogenous activation of NMDA channels in early neocortical development. J Neurosci. 1991;11:792–799. doi: 10.1523/JNEUROSCI.11-03-00792.1991. [DOI] [PMC free article] [PubMed] [Google Scholar]
- LoTurco JJ, Owens DF, Heath MJ, Davis MB, Kriegstein AR. GABA and glutamate depolarize cortical progenitor cells and inhibit DNA synthesis. Neuron. 1995;15:1287–1298. doi: 10.1016/0896-6273(95)90008-X. [DOI] [PubMed] [Google Scholar]
- Lyon GR, Shaywitz SE, Shaywitz BA. A definition of dyslexia. Ann Dyslexia. 2003;53:1–14. doi: 10.1007/s11881-003-0001-9. [DOI] [Google Scholar]
- Mason GF, Rothman DL. Graded image segmentation of brain tissue in the presence of inhomogeneous radio frequency fields. Magn Reson Imaging. 2002;20:431–436. doi: 10.1016/S0730-725X(02)00510-6. [DOI] [PubMed] [Google Scholar]
- Mason GF, Chu WJ, Hetherington HP. A general approach to error estimation and optimized experiment design, applied to multislice imaging of T1 in human brain at 4.1 T. J Magn Reson. 1997;126:18–29. doi: 10.1006/jmre.1997.1143. [DOI] [PubMed] [Google Scholar]
- Maisog JM, Einbinder ER, Flowers DL, Turkeltaub PE, Eden GF. A meta-analysis of functional neuroimaging studies of dyslexia. Ann N Y Acad Sci. 2008;1145:237–259. doi: 10.1196/annals.1416.024. [DOI] [PubMed] [Google Scholar]
- Michael N, Erfurth A, Pfleiderer B. Elevated metabolites within dorsolateral prefrontal cortex in rapid cycling bipolar disorder. Psychiatry Res Neuroimaging. 2009;172:78–81. doi: 10.1016/j.pscychresns.2009.01.002. [DOI] [PubMed] [Google Scholar]
- Morillon B, Lehongre K, Frackowiak RS, Ducorps A, Kleinschmidt A, Poeppel D, Giraud AL. Neurophysiological origin of human brain asymmetry for speech and language. Proc Natl Acad Sci U S A. 2010;107:18688–18693. doi: 10.1073/pnas.1007189107. [DOI] [PMC free article] [PubMed] [Google Scholar]
- Muthukumaraswamy SD, Edden RA, Jones DK, Swettenham JB, Singh KD. Resting GABA concentration predicts peak gamma frequency and fMRI amplitude in response to visual stimulation in humans. Proc Natl Acad Sci U S A. 2009;106:8356–8361. doi: 10.1073/pnas.0900728106. [DOI] [PMC free article] [PubMed] [Google Scholar]
- Niogi SN, McCandliss BD. Left lateralized white matter microstructure accounts for individual differences in reading ability and disability. Neuropsychologia. 2006;44:2178–2188. doi: 10.1016/j.neuropsychologia.2006.01.011. [DOI] [PubMed] [Google Scholar]
- Perlov E, Philipsen A, Matthies S, Drieling T, Maier S, Bubl E, Hesslinger B, Buechert M, Henning J, Ebert D, Tebartz Van Elst L. Spectroscopic findings in attention-deficit/hyperactivity disorder: review and meta-analysis. World J Biol Psychiatry. 2009;10:355–365. doi: 10.1080/15622970802176032. [DOI] [PubMed] [Google Scholar]
- Peterson RL, Pennington BF. Developmental dyslexia. Lancet. 2012;379:1997–2007. doi: 10.1016/S0140-6736(12)60198-6. [DOI] [PMC free article] [PubMed] [Google Scholar]
- Pfefferbaum A, Adalsteinsson E, Spielman D, Sullivan EV, Lim KO. In vivo spectroscopic quantification of the N-acetyl moiety, creatine, and choline from large volumes of brain gray and white matter: effects of normal aging. Magn Reson Med. 1999;41:276–284. doi: 10.1002/(SICI)1522-2594(199902)41:2<276::AID-MRM10>3.0.CO;2-8. [DOI] [PubMed] [Google Scholar]
- Pignatelli M, Beyeler A, Leinekugel X. Neural circuits underlying the generation of theta oscillations. J Physiol Paris. 2012;106:81–92. doi: 10.1016/j.jphysparis.2011.09.007. [DOI] [PubMed] [Google Scholar]
- Poelmans G, Pauls DL, Buitelaar JK, Franke B. Integrated genome-wide association study findings: identification of a neurodevelopmental network for attention deficit hyperactivity disorder. Am J Psychiatry. 2011;168:365–377. doi: 10.1176/appi.ajp.2010.10070948. [DOI] [PubMed] [Google Scholar]
- Pugh KR, Mencl WE, Shaywitz BA, Shaywitz SE, Fulbright RK, Constable RT, Skudlarski P, Marchione KE, Jenner AR, Fletcher JM, Liberman AM, Shankweiler DP, Katz L, Lacadie C, Gore JC. The angular gyrus in developmental dyslexia: task-specific differences in functional connectivity within posterior cortex. Psychol Sci. 2000;11:51–56. doi: 10.1111/1467-9280.00214. [DOI] [PubMed] [Google Scholar]
- Pugh KR, Frost SJ, Sandak R, Landi N, Moore D, Della Porta G, Cornelissen P, Hansen P, Kringelbach M, Pugh K. The neural basis of reading. New York: Oxford UP; 2010. Mapping the word reading circuitry in skilled and disabled readers; pp. 281–305. [DOI] [Google Scholar]
- Pugh KR, Landi N, Preston JL, Mencl WE, Austin AC, Sibley D, Fulbright RK, Seidenberg MS, Grigorenko EL, Constable RT, Molfese P, Frost SJ. The relationship between phonological and auditory processing and brain organization in beginning readers. Brain Lang. 2013;125:173–183. doi: 10.1016/j.bandl.2012.04.004. [DOI] [PMC free article] [PubMed] [Google Scholar]
- Rae C, Lee MA, Dixon RM, Blamire AM, Thompson CH, Styles P, Talcott J, Richardson AJ, Stein JF. Metabolic abnormalities in developmental dyslexia detected by 1H magnetic resonance spectroscopy. Lancet. 1998;351:1849–1852. doi: 10.1016/S0140-6736(97)99001-2. [DOI] [PubMed] [Google Scholar]
- Richardson AJ, Cox IJ, Sargentoni J, Puri BK. Abnormal cerebral phospholipid metabolism in dyslexia indicated by phosphorus-31 magnetic resonance spectroscopy. NMR Biomed. 1997;10:309–314. doi: 10.1002/(SICI)1099-1492(199710)10:7<309::AID-NBM484>3.0.CO;2-0. [DOI] [PubMed] [Google Scholar]
- Richlan F, Kronbichler M, Wimmer H. Functional abnormalities in the dyslexic brain: a quantitative meta-analysis of neuroimaging studies. Hum Brain Mapp. 2009;30:3299–3308. doi: 10.1002/hbm.20752. [DOI] [PMC free article] [PubMed] [Google Scholar]
- Richlan F, Sturm D, Schurz M, Kronbichler M, Ladurner G, Wimmer H. A common left occipito-temporal dysfunction in developmental dyslexia and acquired letter-by-letter reading? PLoS One. 2010;5:e12073. doi: 10.1371/journal.pone.0012073. [DOI] [PMC free article] [PubMed] [Google Scholar]
- Richlan F, Kronbichler M, Wimmer H. Structural abnormalities in the dyslexic brain: a meta-analysis of voxel-based morphometry studies. Hum Brain Mapp. 2013;34:3055–3065. doi: 10.1002/hbm.22127. [DOI] [PMC free article] [PubMed] [Google Scholar]
- Rojas DC, Singel D, Steinmetz S, Hepburn S, Brown MS. Decreased left perisylvian GABA concentration in children with autism and unaffected siblings. Neuroimage. 2014;86:28–34. doi: 10.1016/j.neuroimage.2013.01.045. [DOI] [PMC free article] [PubMed] [Google Scholar]
- Ross AJ, Sachdev PS. Magnetic resonance spectroscopy in cognitive research. Brain Res Rev. 2004;44:83–102. doi: 10.1016/j.brainresrev.2003.11.001. [DOI] [PubMed] [Google Scholar]
- Rothman DL. 1H NMR studies of human brain metabolism and physiology. In: Gillies E, editor. NMR in physiology and biomedicine. San Diego: Academic; 1994. pp. 353–372. [Google Scholar]
- Rothman DL, Petroff OA, Behar KL, Mattson RH. Localized 1H NMR measurements of gamma-aminobutyric acid in human brain in vivo. Proc Natl Acad Sci U S A. 1993;90:5662–5666. doi: 10.1073/pnas.90.12.5662. [DOI] [PMC free article] [PubMed] [Google Scholar]
- Sagvolden T, Johansen EB, Aase H, Russell VA. A dynamic developmental theory of attention-deficit/hyperactivity disorder (ADHD) predominantly hyperactive/impulsive and combined subtypes. Behav Brain Sci. 2005;28:397–419. doi: 10.1017/S0140525X05000075. discussion 419–468. [DOI] [PubMed] [Google Scholar]
- Sagvolden T, Johansen EB, Wøien G, Walaas SI, Storm-Mathisen J, Bergersen LH, Hvalby Ø, Jensen V, Aase H, Russell VA, Killeen PR, Dasbanerjee T, Middleton FA, Faraone SV. The spontaneously hypertensive rat model of ADHD: the importance of selecting the appropriate reference strain. Neuropharmacology. 2009;57:619–626. doi: 10.1016/j.neuropharm.2009.08.004. [DOI] [PMC free article] [PubMed] [Google Scholar]
- Sanacora G, Mason GF, Rothman DL, Behar KL, Hyder F, Petroff OA, Berman RM, Charney DS, Krystal JH. Reduced cortical γ-aminobutyric acid levels in depressed patients determined by proton magnetic resonance spectroscopy. Arch Gen Psychiatry. 1999;56:1043–1047. doi: 10.1001/archpsyc.56.11.1043. [DOI] [PubMed] [Google Scholar]
- Sanacora G, Rothman DL, Mason G, Krystal JH. Clinical studies implementing glutamate neurotransmission in mood disorders. Ann N Y Acad Sci. 2003;1003:292–308. doi: 10.1196/annals.1300.018. [DOI] [PubMed] [Google Scholar]
- Schlaggar BL, McCandliss BD. Development of neural systems for reading. Annu Rev Neurosci. 2007;30:475–503. doi: 10.1146/annurev.neuro.28.061604.135645. [DOI] [PubMed] [Google Scholar]
- Shaywitz BA, Fletcher JM, Holahan JM, Shaywitz SE. Discrepancy compared to low achievement definitions of reading disability results from the Connecticut longitudinal study. J Learn Disabil. 1992;25:639–648. doi: 10.1177/002221949202501003. [DOI] [PubMed] [Google Scholar]
- Shen J, Rycyna RE, Rothman DL. Improvements on an in vivo automatic shimming method (FASTERMAP) Magn Reson Med. 1997;38:834–839. doi: 10.1002/mrm.1910380521. [DOI] [PubMed] [Google Scholar]
- Shen J, Yang J, Choi IY, Li SS, Chen Z. A new strategy for in vivo spectral editing. Application to GABA editing using selective homonuclear polarization transfer spectroscopy. J Magn Reson. 2004;170:290–298. doi: 10.1016/j.jmr.2004.05.022. [DOI] [PubMed] [Google Scholar]
- Shutter L, Tong KA, Holshouser BA. Proton MRS in acute traumatic brain injury: role for glutamate/glutamine and choline for outcome prediction. J Neurotrauma. 2004;21:1693–1705. doi: 10.1089/neu.2004.21.1693. [DOI] [PubMed] [Google Scholar]
- Singh KD. Which “neural activity” do you mean? fMRI, MEG, oscillations and neurotransmitters. Neuroimage. 2012;62:1121–1130. doi: 10.1016/j.neuroimage.2012.01.028. [DOI] [PubMed] [Google Scholar]
- Snowling MJ. Phonemic deficits in developmental dyslexia. Psychol Res. 1981;43:219–234. doi: 10.1007/BF00309831. [DOI] [PubMed] [Google Scholar]
- Sperling AJ, Lu ZL, Manis FR, Seidenberg MS. Motion-perception deficits and reading impairment: it's the noise, not the motion. Psychol Sci. 2006;17:1047–1053. doi: 10.1111/j.1467-9280.2006.01825.x. [DOI] [PubMed] [Google Scholar]
- Torgesen J, Wagner R, Rashotte C. Test of word reading efficiency (TOWRE) Austin, Texas: Pro-Ed; 1999. [Google Scholar]
- Valentine GW, Mason GF, Gomez R, Fasula M, Watzl J, Pittman B, Krystal JH, Sanacora G. The antidepressant effect of ketamine is not associated with changes in occipital amino acid neurotransmitter content as measured by 1H-MRS. Psychiatry Res. 2011;191:122–127. doi: 10.1016/j.pscychresns.2010.10.009. [DOI] [PMC free article] [PubMed] [Google Scholar]
- Wagner RK, Torgesen JK, Rashotte CA. Comprehensive test of phonological processing. Austin, Texas: Pro-Ed; 1999. [Google Scholar]
- Wechsler D. Wechsler abbreviated scale of intelligence. San Antonio, TX: The Psychological Corporation; 1999. [Google Scholar]
- Woodcock RW, McGrew KS, Mather N, Schrank FA. Woodcock-Johnson III diagnostic supplement to the tests of cognitive abilities. Itasca, IL: Riverside; 2003. [Google Scholar]
- Yeo RA, Phillips JP, Jung RE, Brown AJ, Campbell RC, Brooks WM. Magnetic resonance spectroscopy detects brain injury and predicts cognitive functioning in children with brain injuries. J Neurotrauma. 2006;23:1427–1435. doi: 10.1089/neu.2006.23.1427. [DOI] [PubMed] [Google Scholar]