

Abstract
Background
Higher long-term cumulative lead exposure predicts faster cognitive decline in older men, but evidence of an association in women is lacking.
Objective
To determine if there is an association between lead exposure and cognitive decline in women.
Methods
This study considers a sample of 584 women from the Nurses’ Health Study who live in or near Boston, Massachusetts. We quantified lead exposure using biomarkers of lead exposure assessed in 1993–2004 and evaluated cognitive decline by repeated performance on a telephone battery of cognitive tests primarily assessing learning, memory, executive function, and attention completed in 1995–2008. All cognitive test scores were z-transformed for use in analyses. We used linear mixed models with random effects to quantify the association between each lead biomarker and change in cognition overall and on each individual test.
Results
Consideration of individual tests showed greater cognitive decline with increased tibia lead concentrations, a measure of long-term cumulative exposure, for story memory and category fluency. The estimated excess annual decline in overall cognitive test z-score per SD increase in tibia bone lead concentration was suggestive, although the confidence intervals included the null (0.024 standard units, 95% confidence interval: −0.053 , 0.004 – an additional decline in function equivalent to being 0.33 years older). We found little support for associations between cognitive decline and patella or blood lead, which provide integrated measures of exposure over shorter timeframes.
Conclusions
Long-term cumulative lead exposure may be weakly associated with faster cognitive decline in community-dwelling women, at least in some cognitive domains.
Keywords: cognition, cognitive decline, cohort, epidemiology, lead
1. Introduction
Poor or declining cognitive function adversely affects health and quality of life of both patients (Bassuk et al., 2000; Gaugler et al., 2007) and caregivers (Schulz and Beach, 1999; Shaw et al., 1997). This burden is growing as the population ages. Lead has direct neurotoxic effects including disruption of calcium-dependent enzymes and neurotransmission (Braga et al., 1999; Lasley and Gilbert, 2000), promotion of oxidative stress (Adonaylo and Oteiza, 1999; Ahamed and Siddiqui, 2007), and alteration of cell membrane fluidity or permeability (Adonaylo and Oteiza, 1999), which may lead to central nervous system dysfunction and cognitive decline in older adults. Lead may also have indirect effects on cognition through its association with hypertension and other cardiovascular outcomes (Navas-Acien et al., 2007) that are associated with worse cognition (Manolio et al., 2003; Qiu et al., 2005). While lead exposures have declined over time (Muntner et al., 2005), sources remain, and due to long-term storage of lead in bone, past exposures may exert effects later in life (Hu et al., 1998).
Previous studies support an association between higher current or past occupational lead exposure and lower current cognitive performance (e.g. cognitive test scores assessed at a single point in time) in older adults (Shih et al., 2007). Studies of the association between current or prior environmental lead exposures and current cognitive performance in older, community-dwelling populations, who typically have lower levels of exposure, are less consistent (Bandeen-Roche et al., 2009; Gao et al., 2008; Muldoon et al., 1996; Shih et al., 2006; van Wijngaarden et al., 2009; van Wijngaarden et al., 2011; Weisskopf et al., 2007; Weisskopf et al., 2004; Weuve et al., 2009; Wright et al., 2003). Only two studies have exclusively considered women (Muldoon et al., 1996; Weuve et al., 2009), and while one of these only assessed associations with blood lead, a measure of recent exposure, they do suggest an association, notwithstanding the relatively lower lead burden typically experienced by women.
The association between exposure to lead and rate of change in cognition is less well studied, but is potentially more relevant. Associations between lead and cognitive decline are less susceptible to confounding bias and imply a relationship between lead and the pathological process leading to a diagnosis of dementia. Higher lead does appear to be associated with faster cognitive decline in predominately male occupational and community-dwelling cohorts (Khalil et al., 2009; Schwartz et al., 2005; Schwartz et al., 2000; Weisskopf et al., 2007; Weisskopf et al., 2004). Data from the only study to include a significant number of women, the Baltimore Memory Study, also suggest an association between higher cumulative lead exposure and faster cognitive decline in several cognitive domains; however, these associations were significantly attenuated after adjustment for race and socioeconomic status (Bandeen-Roche et al., 2009).
The association between lead and cognitive decline may be different in community-dwelling women for several reasons. First, community-dwelling women typically have lower lead exposures, possibly due to relative lack of occupational exposure. Second, women may experience several periods of rapid bone turnover during pregnancy, lactation, and menopause, leading to release of stored lead from bone (Jackson et al., 2010; Machida et al., 2009). The impact of this is uncertain. It may depend on changes in bioavailable lead during and after these events (i.e. we would expect higher levels of bioavailable lead during rapid bone turnover, and there is potential for lower levels of bioavailable lead following such events, absent changes in external exposures) and whether there is a susceptible period for the adverse effects of lead on cognition coincidental with rapid bone turnover events. Third, sex differences in response to lead exposure have been noted in other contexts (Jedrychowski et al., 2009; Schneider et al., 2011).
To date, no study has investigated the relationship between lead exposure and cognitive decline exclusively in community-dwelling women, and the single analysis considering a substantial number of such women failed to strongly support an association (Bandeen-Roche et al., 2009). The current analyses extends previous work evaluating the association between past lead exposure and current cognitive performance in a sample of older, community-dwelling women (Weuve et al., 2009) to explore whether exposure to lead is associated with cognitive decline.
2. Materials and methods
2.1. Study sample
The current sample is a subset of Nurses’ Health Study (NHS) participants who had been previously evaluated for lead exposure. The NHS is a large cohort of women who were registered nurses at recruitment in 1976. Participants complete extensive surveys on healthrelated behaviors and medical history every two years (Colditz et al., 1997). Lead exposure had been assessed in 1993–1995 for 301 nurses recruited for a case-control study of lead and hypertension, and in 2001–2004 for 320 nurses recruited for a study of lead and osteoporosis and selected to be similar to the controls in the prior case-control study (Korrick et al., 1999; Weuve et al., 2009). Eligibility criteria for both groups required residence in the greater Boston area, as well as no history of major chronic disease (with the exception of hypertension in the cases from the case-control study) or obesity (Weuve et al., 2009). To be eligible for inclusion in the current study, each participant had to complete at least one cognitive assessment, be free of stroke, Alzheimer’s disease, and Parkinson’s disease at the time of the first cognitive assessment, and have complete information on age and education. Over the course of cognitive follow-up, participants were censored at the time of stroke. Of the 621 nurses who completed lead exposure assessment, 584 met our eligibility criteria.
2.2. Exposure assessment
Bone lead concentrations (micrograms lead per gram bone mineral) were measured using K-x-ray fluorescence (K-XRF) at two sites, the mid-tibial shaft and the patella (Weuve et al., 2009), and reflect cumulative lead exposure over periods of several years, with tibia bone lead representing a longer time period than patella bone lead (Wilker et al., 2011). Negative estimates of bone lead concentration are possible when lead concentrations are close to zero and were used in this analysis without imposition of a minimum detectable limit (Kim et al., 1995). The K-XRF analysis also provides uncertainty estimate for each bone lead concentration that is theoretically equivalent to the SD of repeated measures. Bone lead measurements in the first 301 nurses were done using a prototype instrument developed by ABIOMED (Danvers, Massachusetts) that was replaced by an improved instrument used on the remaining nurses. Data from the two machines were combined using a linear correction factor, determined through a calibration analysis (Nie et al., 2008).
We measured lead concentrations in whole blood collected in trace-metal-free tubes with ethylenediaminetetraacetic acid using graphite furnace atomic absorption with Zeeman background correction (ESA Laboratories, Chelmsford, MA, USA). Instrument calibration occurred after every 20 samples using the National Institute of Standards and Technology Standard Reference Material (NIST SRM 955a, lead in blood). 10% of samples were duplicates, 10% were controls, and 10% were blanks. Coefficients of variation ranged from 8% for lead concentrations of 10–30 µg/dl to 1% for higher concentrations (Weuve et al., 2009). Blood lead levels below the minimum detection limit of 1 µg/dl (107/584, or 18% of the current sample) were re-coded to 0.71 µg/dl (the detection limit divided by the square root of two).
2.3. Cognitive assessment
Of the 584 nurses who were eligible for the current study, 72 were members of a separate NHS sub-study of cognitive decline, and completed up to four waves of cognitive testing between 1995 and 2007. The remaining 512 were invited to complete up to two waves of cognitive testing between 2002 and 2008, either for this study (n=498) or through a combination of unrelated pilot studies in the NHS and additional testing for this study (n=14). We combined all these sources to provide the largest possible sample for the current analysis; please see Figure A.1 for additional information.
Regardless of data source, trained interviewers administered cognitive tests using telephone interviews. Up to seven cognitive tests were administered during the interview, with each interview yielding up to 9 cognitive scores and assessing a variety of domains: (i) the Telephone Interview for Cognitive Status (TICS) (overall function), (ii) immediate recall of a 10 word list, a subtask of the Telephone Interview for Cognitive Status (short term memory) (iii) delayed recall of a 10 word list (learning and memory), (iv) East Boston Memory test, immediate, (story recall -short term episodic memory), (v) East Boston Memory test, delayed (story recall - episodic learning and memory), (vi) category fluency (naming animals - executive function and memory) and (vii) phonemic fluency (naming words beginning with the letter F - executive function and memory), (viii) alphabetizing span test (repeat a list of words in alphabetical order - working memory and attention), and (ix) digit span backwards (repeat a string of digits in reverse order -working memory and attention). While these tasks cover a variety of domains, they do not assess spatial cognition.
Telephone-based cognitive assessment has previously been shown to be a valid and reliable method by which to assess cognition in domains commonly affected by dementia (Brant et al., 1988; Monteiro et al. 1998; Rankin et al. 2005; Rapp et al., 2012; Unverzagt et al., 2007). Other studies have reported good validity relative to in-person administration of the same or similar tests and good reliability across repeated telephone administration for several of the tests included in the current battery. In 4,757 persons age 55–80, age and depression adjusted correlations across in-person and telephone administration of cognitive tests within 12 months of each other were 0.71 for phonemic fluency, 0.82 for category fluency, and 0.79 for digit span backwards; the adjusted correlation between the in-person Modified Mini Mental State Examination and the TICS, administered via telephone was 0.89 (Rankin et al. 2005). In a randomized controlled trial of modality of repeated cognitive testing in 110 community-dwelling older women (mean age 72.4), test-rest reliability for telephone administered cognitive tests over six months for category fluency, verbal fluency, and digit span backwards was 0.88, 0.71, and 0.57 (Rapp et al. 2012). Correlations between initial in-person examination at baseline and telephone testing at 6 months for these three tests ranged from 0.33 to 0.71 while correlations between initial telephone testing followed by in-person examination ranged from 0.51 to 0.88.
In a larger subset of NHS participants with cognitive assessments, inter-interviewer reliability on this telephone administered cognitive battery was greater than 0.95 on all tests (Lee et al. 2003). In a validation study among 61 women of similar age and education to our participants from the Religious Orders Study (Bennet et al. 2002), the correlation between overall performance on our telephone battery and overall performance on an in-person cognitive battery was 0.81. Moreover, performance on this telephone cognitive assessment is associated with apolipoprotein E genotype (Kang et al., 2005) and subsequent dementia diagnosis (Weuve et al. 2009), supporting its validity as a measure of cognitive function in domains related to dementia in this cohort.
The cognitive battery differed slightly by date of administration and data source; in particular, the 72 nurses who underwent cognitive assessment as part of another sub-study were not asked to complete either the phonemic fluency test or the alphabetizing span test. We z-transformed each set of cognitive test scores based on the distribution of test scores at the first assessment, with higher values indicating better performance. During the data cleaning process we also identified one participant with implausible improvement from the third to fourth assessment on several cognitive tests; we excluded all data from the fourth assessment for this individual.
2.4. Statistical analysis
We used linear mixed models with random effects and sandwich variance estimates to evaluate the association between baseline lead exposure and rate of change during follow-up in each individual test, overall cognitive function, and overall verbal memory performance, one of the first domains to decline in Alzheimer disease (Tabert et al., 2006). Separate models were used for each combination of a single lead biomarker (blood, patella, or tibia) and a single metric of cognitive performance (individual cognitive test performance, overall cognition, or verbal memory performance). Mixed models allow for differences in the number of repeat measures across participants; therefore, both persons with a single cognitive assessment and those with 2, 3, or 4 assessments are included in our dataset and contribute to our primary estimates.
As we were concerned that sampling for and re-use of data from the original case-control study of lead and hypertension could induce bias, we weighted all analyses by empirically derived sampling weights (Richardson et al., 2007). We identified NHS participants who had been eligible for the original case-control study of lead and hypertension, eligible for the study of lead and osteoporosis, or both. We then used information from NHS questionnaires and logistic regression models to predict each nurse’s probability of participation and computed weights as the inverse of the predicted probability of participation. Predictors used in these models were chosen to capture known sampling strategy (Korrick et al., 1999; Weuve et al., 2009) and factors that may predict the decision to participate: age, body mass index, husband’s education, education, presence of depressive symptoms based on the five item SF-36 Mental Health Inventory (Ware et al., 1993), smoking status, alcohol intake, usual blood pressure, whether the participant had previously provided toenail samples, and presence of emphysema, osteoporosis, balance problems, and bodily pain. We evaluated model fit using the c-statistic and the Hosmer-Lemeshow test. Prior to using the weights, we normalized the weights by dividing each individual weight by the mean weight. Characteristics of the weights prior to normalization and a comparison of weighted and un-weighted analyses are available in Tables A.1. and A.2.
To assess the association between lead and individual test performance, we used a model including a random intercept for individual. To assess the association between lead and overall cognitive function we used a model including a random intercept for individual and fixed effects for each cognitive test. This model provides a single estimate of the association between lead and rate of change in overall cognitive test performance. We used a similar approach for analyses of verbal memory, treating the four tests of verbal memory, immediate and delayed recall of the 10 word list and immediate and delayed recall of the East Boston Memory test, as repeat measures of verbal memory.
The trajectory of cognitive test scores over time is complex. Our final models included a linear and quadratic term for age at first cognitive assessment, an indicator for second or subsequent assessment (to capture improvement due to practice effects), a linear term for change in age from the first cognitive assessment, interactions between the linear and quadratic terms for age at first cognitive assessment and indicator for second or subsequent assessment, and interactions between the linear and quadratic terms for age at first cognitive assessment and the linear term for change in age. For all three biomarkers, lead was modeled linearly, and we included cross-product terms for lead by change in age from first cognitive assessment and lead by indicator for second or subsequent assessment. All analyses were adjusted for predictors of cognitive function and potential confounders identified a priori and measured at the NHS questionnaire closest to lead assessment, including source of cognitive and lead data, alcohol consumption, smoking status, education, husband’s education, menopausal status/hormone therapy use, physical activity, ibuprofen use, aspirin use, vitamin E supplementation, the % of the participant’s census tract that is self-reported white race/ethnicity, and the median household income of the participant’s census tract. For each covariate, we included a main effect as well as interactions between each covariate and both change in age from the first cognitive test and the indicator for second or subsequent assessment, to account for confounding of both starting level and change in cognitive test scores over time. We used missing indicators to account for missing covariate data; however, if fewer than five participants were missing data for a variable, we re-coded missing data to the median value. An example of the form of our final models, corresponding to a generic model for the association between lead biomarker and change in individual test performance over time, is provided as Equation A.
-
(A)
Yij = B0 + B1* baselineagei +B2*baselineagei2 + B3*notfirsttestij + B4*changeinageij + B5*baselineagei*changeinageij +B6*baselineagei2*changeinageij + B7*baselineagei*notfirsttestij +B8*baselineagei2* notfirsttestij + B9*leadbiomarkeri + B10*leadbiomarkeri*changeinageij + B11*leadbiomarkeri*notfirsttestij + B12ik*Covariateik + B13ik*Covariateik*changeinageij + B14ik*Covariateik*notfirsttestij+ bi
Where Yij is the cognitive test score for person i at time j, baselineagei is the age for each person i at baseline, notfirsttestij is an indicator for whether the cognitive assessment was a first or subsequent assessment for person i at time j, changeinageij is the difference between baseline age and current age for person i at time j, leadbiomarkeri is the value of the lead biomarker for person i at baseline, covariateik is the value of covariate k for person i at baseline, and bi is a random intercept for each person.
The cross-product term for lead by change in age from the first cognitive assessment (B10 in Equation A) is of primary interest as it corresponds to the association between lead exposure and rate of change in cognitive test scores over time and is reported in the results section and Tables 2 and 3 below. We report associations corresponding to a one SD unit increase in lead biomarker level, and 95% confidence intervals (CI).
Table 2.
Adjusted Difference in One Year Change in Cognitive Test Z-Score for Each Cognitive Test per One SD Increase in Lead Biomarker Concentrationa in Weighted Analyses
| Difference in One Year Change in Z- Scoreb |
(95% CI) | |
|---|---|---|
| Tibia Lead | ||
| Telephone Interview for Cognitive Status | 0.010 | −0.039, 0.058 |
| Immediate recall of the 10 word list | 0.058 | 0.000, 0.107 |
| Delayed recall of the 10 word list | −0.019 | −0.068, 0.039 |
| East Boston Memory Test, immediate recall | −0.058 | −0.107, 0.000 |
| East Boston Memory Test, delayed recall | −0.058 | −0.127, 0.010 |
| Category fluency | −0.058 | −0.097, −0.010 |
| Phonemic fluency | 0.136 | −0.584, 0.847 |
| Alphabetizing span test | −0.711 | −1.539, 0.117 |
| Digit span backwards | 0.010 | −0.058, 0.078 |
| Patella Lead | ||
| Telephone Interview for Cognitive Status | 0.000 | −0.058, 0.047 |
| Immediate recall of the 10 word list | 0.012 | −0.023, 0.058 |
| Delayed recall of the 10 word list | −0.012 | −0.070, 0.047 |
| East Boston Memory Test, immediate recall | −0.047 | −0.093, 0.012 |
| East Boston Memory Test, delayed recall | −0.023 | −0.105, 0.058 |
| Category fluency | −0.035 | −0.082, 0.023 |
| Phonemic fluency | 0.548 | −0.140, 1.224 |
| Alphabetizing span test | 0.280 | −0.443, 0.991 |
| Digit span backwards | 0.000 | −0.058, 0.070 |
| Blood Lead | ||
| Telephone Interview for Cognitive Status | −0.026 | −0.077, 0.024 |
| Immediate recall of the 10 word list | 0.038 | −0.026, 0.104 |
| Delayed recall of the 10 word list | 0.004 | −0.051, 0.060 |
| East Boston Memory Test, immediate recall | −0.026 | −0.087, 0.034 |
| East Boston Memory Test, delayed recall | 0.017 | −0.068, 0.102 |
| Category fluency | −0.013 | −0.060, 0.032 |
| Phonemic fluency | 0.727 | −0.379, 1.835 |
| Alphabetizing span test | 0.196 | −0.750, 1.142 |
| Digit span backwards | −0.049 | −0.124, 0.026 |
Abbreviations: confidence interval, CI
9.7 ug/g bone mineral for tibia, 11.7 ug/g bone mineral for patella, and 1.9 ug/dL for blood lead.
In addition to variables for time, adjusted for data source (cognitive and lead), alcohol consumption, smoking status, education, husband's education, menopausal status/hormone replacement therapy use, aspirin use, physical activity, ibuprofen use, aspirin use, vitamin E supplementation, % of residential census tract of white race/ethnicity, and median income of residential census track, including both main effects and interactions with change in age from baseline cognitive test and a marker for second or subsequent interview
Table 3.
Adjusted Difference in One Year Change in Cognitive Test Z-Score for a One SD Increase in Lead Biomarker Concentrationa in Weighted Analyses
| Overall Cognition | Verbal Memory | |||
|---|---|---|---|---|
| Difference in One Year Change in Z- Scoreb |
(95% CI) | Difference in One Year Change in Z- Scoreb |
(95% CI) | |
| Tibia Lead | −0.024 | −0.053, 0.004 | −0.017 | −0.058, 0.025 |
| Patella Lead | −0.014 | −0.044, 0.016 | −0.017 | −0.057, 0.023 |
| Blood Lead | −0.013 | −0.044, 0.017 | 0.006 | −0.037, 0.050 |
Abbreviations: Confidence interval, CI
9.7 ug/g bone mineral for tibia, 11.7 ug/g bone mineral for patella, and 1.9 ug/dL for blood lead.
In addition to variables for time, adjusted for data source (cognitive and lead), alcohol consumption, smoking status, education, husband's education, menopausal status/hormone replacement therapy use, aspirin use, physical activity, ibuprofen use, aspirin use, vitamin E supplementation, % of residential census tract of white race/ethnicity, and median income of residential census track, including both main effects and interactions with change in age from baseline cognitive test and a marker for second or subsequent interview.
Figure 1 illustrates how our statistical model captures the complex relationships among time, lead, and cognitive test scores. This figure plots trajectories of predicted overall cognitive test z-scores for two theoretical women, one with the mean tibia lead concentration and one with a tibia lead concentration one SD (9.7 µg/g) above the mean, assuming these women complete cognitive assessments every 3 years starting at age 65 and are described by the reference value of all covariates. An adverse association between higher lead exposure and faster cognitive decline would be visible as steeper decline in cognitive test scores from the second to fourth cognitive assessments for the woman with a higher tibia lead concentration. The modeled practice effect can be observed in the improvement in scores from visit 1 to visit 2.
Figure 1.
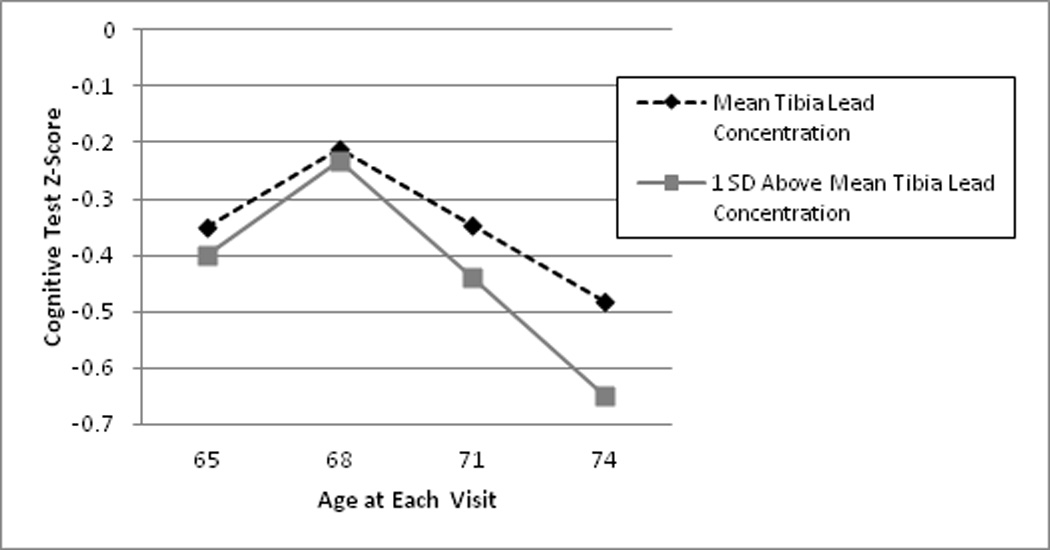
Comparison of the predicted overall cognitive test z-score trajectory for a participant with the mean tibia lead concentration and a participant with a tibia lead concentration one SD (9.7 ug/g) above the mean, assuming completion of the first cognitive testing session at age 65, subsequent sessions at three year intervals, and reference level values for all covariates. An adverse association between higher lead and cognitive trajectory would be evident by steeper downward slope from interviews 2 through 4 in predicted cognitive test scores for the woman with a higher tibia lead concentration. The rise from interview 1 to 2 combines the impact of the adverse association between higher lead and cognitive trajectory and a positive impact of modeled practice effects common to repeated neuropsychological tests. Please note that this figure plots two hypothetical trajectories over four assessments estimated using the analytical model, not an observed trajectory from any of the 43 (7%) of the 584 women in our analytical sample that had four assessments.
2.5. Sensitivity analyses
We performed several sensitivity analyses. First, we excluded participants with high uncertainty for either bone lead measurement (>15 µg/g bone for tibia and/or >10 µg/g bone for patella, n=28). Second, we excluded persons who reported diagnosis of Parkinson’s disease or Alzheimer’s disease during follow-up (n=3). Third, we performed additional analyses to confirm that the association was not dependent on the combination of participants with different followup intervals (the primary models include all persons, regardless of the number of follow-up assessments). To do so, we repeated our analyses to ensure that the association persisted in this subset by (a) excluding data from the initial visit, and (b) excluding persons who did not complete at least three assessments. Fourth, we evaluated the possibility of a log-linear relationship between lead and change in cognition through use of log-transformed lead measures.
The institutional review boards of the Brigham and Women’s Hospital and the Harvard School of Public Health approved this study. Participants provided written informed consent prior to participation in the original studies of lead exposure and provided verbal consent prior to participation in telephone cognitive testing. All analyses were completed using SAS (Cary, NC), version 9.2.
3. Results
3.1. Descriptive Statistics
Of the 621 with lead measurements, 584 (94%) women met our eligibility criteria. The mean tibia lead concentration was 10.5 µg/g bone mineral (SD: 9.7), the mean patella lead concentration was 12.6 µg/g bone mineral (SD: 11.7), and the mean blood lead concentration was 2.9 µg/dL (SD: 1.9). Characteristics of our sample and mean lead concentrations by various characteristics are shown in Table 1. Variation in lead levels by age, alcohol, and menopausal status/hormone replacement therapy are consistent with previous reports (Korrick et al., 2002). On average, participants were 61 years old (SD: 6) at lead assessment and 67 years old (SD: 6) at the first cognitive assessment. The mean time between cognitive assessments was 3 years (SD: 0.6). Of the 584 participants who completed at least one cognitive assessment, 59 completed one, 462 completed two, 20 completed three, and 43 completed four cognitive assessments. This pattern is principally attributable to design, not drop-out. Additional information on the distribution of lead biomarkers and cognitive test scores is available in Appendix B.
Table 1.
Age-standardized Mean (SD) Lead Biomarker Measurements by Sample Characteristics at the Time of Lead Assessment
| N | % | Mean (SD) Tibia Lead Concentration (ug/g) |
Mean (SD) Patella Lead Concentration (ug/g) |
Mean (SD) Blood Lead Concentration (ug/dL) |
|
|---|---|---|---|---|---|
| Agea | |||||
| 45–54 | 92 | 15.8% | 10.6 (8.3) | 14.6 (11.0) | 2.6 (2.0) |
| 55–59 | 132 | 22.6% | 8.9 (8.7) | 10.7 (10.3) | 2.8 (1.9) |
| 60–64 | 183 | 31.3% | 9.1 (9.4) | 11.5 (10.9) | 3.0 (1.9) |
| 65–69 | 138 | 23.6% | 12.8 (10.4) | 13.0 (12.3) | 3.0 (1.6) |
| 70–74 | 39 | 6.7% | 13.6 (12.7) | 18.4 (16.0) | 3.1 (2.2) |
| Menopausal Status/Hormone Replacement | |||||
| Therapya | |||||
| Premenopausal | 44 | 7.5% | 10.3 (8.2) | 13.5 (11.8) | 2.3 (1.5) |
| Postmenopausal, Current User | 181 | 31.0% | 10.5 (8.2) | 14.0 (10.1) | 2.2 (1.4) |
| Postmenopausal, Past User | 221 | 37.8% | 9.9 (10.9) | 11.4 (12.2) | 3.1 (1.8) |
| Postmenopausal, Never User | 138 | 23.6% | 11.5 (10.0) | 12.4 (12.6) | 3.6 (2.3) |
| Education | |||||
| Registered Nurse | 338 | 57.9% | 10.8 (9.8) | 13.4 (11.1) | 3.0 (2.0) |
| Bachelors Degree | 160 | 27.4% | 10.6 (9.1) | 10.8 (12.6) | 2.7 (1.6) |
| Masters or Doctoral Degree | 86 | 14.7% | 9.1 (10.3) | 12.2 (11.8) | 2.8 (1.8) |
| Husband's Education | |||||
| High School or Less | 137 | 23.5% | 11.8 (10.4) | 14.7 (13.4) | 3.2 (2.3) |
| College | 148 | 25.3% | 9.8 (9.2) | 12.3 (12.4) | 2.8 (1.6) |
| Graduate School | 163 | 27.9% | 9.6 (10.1) | 11.9 (10.4) | 2.8 (1.8) |
| Unknown/None | 136 | 23.3% | 10.5 (8.4) | 11.3 (9.8) | 2.9 (1.7) |
| Smoking | |||||
| Never | 233 | 39.9% | 9.8 (9.1) | 11.2 (10.8) | 2.7 (1.8) |
| Past | 306 | 52.4% | 11.0 (10.3) | 13.8 (12.6) | 3.0 (2.0) |
| Current | 45 | 7.7% | 12.3 (8.8) | 13.3 (9.0) | 3.6 (1.7) |
| Alcohol | |||||
| <1 g/day | 140 | 24.0% | 8.9 (9.3) | 11.7 (10.9) | 2.6 (1.5) |
| 1–4 g/day | 200 | 34.3% | 10.8 (10.3) | 12.6 (12.1) | 2.9 (2.0) |
| 5–14 g/day | 155 | 26.5% | 11.1 (9.7) | 13.2 (13.1) | 3.1 (2.1) |
| 15+ g/day | 68 | 11.6% | 11.5 (10.0) | 13.9 (10.4) | 3.3 (1.6) |
| Missing | 21 | 3.6% | 8.7 (8.5) | 8.4 (7.8) | 2.8 (1.8) |
| Physical Activity | |||||
| 1st Quartile | 144 | 24.7% | 10.3 (9.0) | 11.9 (10.7) | 2.9 (1.7) |
| 2nd Quartile | 146 | 25.0% | 11.7 (8.7) | 12.5 (11.9) | 2.9 (1.8) |
| 3rd Quartile | 146 | 25.0% | 10.2 (9.7) | 12.6 (11.1) | 2.9 (2.1) |
| 4th Quartile | 145 | 24.8% | 9.2 (11.0) | 13.2 (12.9) | 2.9 (1.8) |
| Missing | 3 | 0.5% | 23.2 (8.3) | 13.1 (4.6) | 3.2 (2.8) |
| Ibuprofen Use | |||||
| Yes | 151 | 25.9% | 10.8 (8.9) | 13.4 (12.2) | 2.8 (2.0) |
| No | 433 | 74.1% | 10.3 (10.0) | 12.4 (11.3) | 2.9 (1.9) |
| Aspirin Use | |||||
| 0 days per month | 372 | 63.7% | 9.5 (9.2) | 11.3 (10.9) | 2.8 (1.7) |
| 1 day per month to 2 days per week | 86 | 14.7% | 12.1 (9.6) | 15.0 (11.6) | 3.3 (2.0) |
| 3+days per week | 74 | 12.7% | 11.5 (10.7) | 15.0 (13.2) | 3.2 (2.5) |
| Missing | 52 | 8.9% | 13.1 (7.9) | 14.5 (9.0) | 2.6 (1.6) |
| Vitamin E Supplementation | |||||
| Yes | 215 | 36.8% | 10.0 (9.6) | 12.4 (10.9) | 2.7 (1.7) |
| No | 319 | 54.6% | 10.7 (9.8) | 13.1 (12.1) | 3.1 (2.0) |
| Missing | 50 | 8.6% | 10.3 (8.5) | 10.7 (9.1) | 2.7 (1.6) |
| % of participant's census tract that is white | |||||
| <90% | 130 | 22.3% | 11.0 (10.1) | 13.2 (10.3) | 2.9 (1.6) |
| 90–95% | 159 | 27.2% | 9.5 (8.4) | 12.2 (10.0) | 2.9 (1.8) |
| 95%+ | 295 | 50.5% | 10.6 (10.5) | 12.4 (13.2) | 2.9 (2.0) |
| Census tract median income | |||||
| <$75,000 | 200 | 34.3% | 10.8 (9.6) | 13.9 (11.3) | 2.9 (1.9) |
| $75,000–$100,000 | 220 | 37.7% | 10.7 (11.2) | 11.9 (12.8) | 2.9 (1.9) |
| $100,000+ | 164 | 28.1% | 10.0 (8.0) | 11.7 (9.8) | 3.0 (1.9) |
These lead biomarker measures were not age-standardized.
3.2. Sampling weights
Models used to create sampling weights satisfactorily predicted participation, and Hosmer-Lemeshow tests failed to suggest lack of fit. Summary measures describing the weights prior to normalization are available in Table A.1. Compared to the weighted associations between measures of lead exposure and rate of cognitive change, the un-weighted associations were often further from the null (Table A.2), suggesting that sampling for and re-use of case-control data for our alternate outcome, cognition, may have introduced bias. As such, we report weighted analyses throughout.
3.3. Association with decline on individual cognitive tests
When considering the association between lead and rate of change in cognitive test scores on individual cognitive tests, we found adverse associations between tibia lead concentrations and cognitive decline in scores on the East Boston Memory Test, immediate recall, a measure of story memory, and category fluency (naming animals), a measure of executive function and memory (Table 2). We found suggestive, but non-significant, adverse associations between tibia lead concentration on the East Boston Memory Test, delayed recall, a measure of story learning and memory, and the alphabetizing span test, which primarily assesses working memory and attention. Surprisingly, we observed a positive association between tibia lead and change in scores on immediate recall of the 10 word list, a measure of short term memory. There was little support for an association between patella or blood lead and cognitive decline on any individual test. These results were materially unchanged across our sensitivity analyses.
3.4. Association with decline in overall cognitive function
Our analyses suggest a weak association between higher levels of tibia lead and faster rate of decline in overall cognitive function over time, although the confidence interval crosses the null (Table 3). To put the effect size of the estimate in context, we compared the predicted one year cognitive decline associated with every one SD increase in tibia bone lead concentration to the average one year cognitive decline in our cohort and found that the magnitude of the lead association was 33% of the average yearly cognitive decline in our data. In other words, a woman would have to age an additional 0.33 years to produce the same additional decline in cognitive test score predicted for a one SD increase in tibia lead exposure. Higher tibia lead concentrations did not appear to be associated with decline in verbal memory. There was little evidence to support an association between patella lead or blood lead and rate of decline in overall cognition or verbal memory.
3.5. Sensitivity Analyses
Our results were similar across sensitivity analyses excluding those with high bone lead measurement uncertainty or diagnosed neurodegenerative disease (data not shown). The association between tibia lead and overall cognitive decline was stronger in analyses limited to those 63 nurses with three or more tests (difference in 1 year change in total cognitive test z-score for a 1 SD increase in tibia lead: −0.040, 95% CI: −0.068, −0.012) and in analyses excluding data from the initial visit, which did not require modeling practice effects (difference in 1 year change in total cognitive test z-score for a 1 SD increase in tibia lead: −0.033, 95% CI: −0.062, − 0.004). Associations from models assuming a log-linear association between lead and change in cognitive test were generally consistent, but less statistically significant, than models assuming a linear relation.
4. Discussion
Our findings suggest that lead, particularly long-term cumulative exposure to lead, may be related to cognitive decline in community-dwelling women. However, the size of the effect is small and appears to be limited to certain cognitive domains. The suggestion of an association between tibia lead and overall cognition is consistent with findings from the Normative Aging Study, a cohort of community-dwelling older men, where higher tibia and patella bone lead concentrations predicted a decline in Mini Mental State Examination scores (Weisskopf et al., 2004), a test of general cognitive function. While previous work in largely male-dominated cohorts has implicated lead in change in cognition in a variety of domains, use of different cognitive tests, focus on different cognitive domains, and report on summary domain measures rather than individual tests makes comparison to previous work difficult. However, past studies have noted associations or point estimates suggesting an adverse association between tibia bone lead concentrations and change in measures of learning and memory (Bandeen-Roche et al., 2009; Schwartz et al., 2000; Weisskopf et al., 2007), working memory and attention (Weisskopf et al., 2007), and executive function (Bandeen-Roche et al., 2009; Khalil et al., 2009; Schwartz et al., 2005; Weisskopf et al., 2007), which is consistent with our findings.
The magnitude of our association between tibia lead concentrations and cognitive decline is relatively weak. While this may be a function of the relatively low levels of lead exposure experienced by our community-dwelling sample, other factors may also contribute. Misclassification of lead levels in post-menopausal women (>90% of the study sample) may play a role. Women often experience a period of rapid bone mineral density loss during and after menopause (Seeman, 2003). While there is little evidence suggesting this changes bone lead concentrations, low bone mineral density can make measurements of lead concentrations less precise (McNeill et al., 1999), which would likely result in bias towards the null. Similarly, while neurobehavioral tests are generally reliable, small changes in cognition can be difficult to detect without extensive testing, and we were limited to looking at cognitive tests that could be assessed via telephone within a short amount of time. While previous work in men has noted associations between lead and change in measures of spatial cognition (Khalil et al., 2009; Schwartz et al., 2000), visuosapatial/visuomotor tasks (Weisskopf et al., 2007), reaction time (Schwartz et al., 2000; Weisskopf et al., 2007), eye-hand coordination (Bandeen-Roche et al., 2009), and manual dexterity (Schwartz et al., 2005; Schwartz et al., 2000), we were unable to assess these domains individually or as a part of our measure of overall cognition given our use of telephone-administered cognitive tests. Finally, we were unable to closely investigate the impact of timing of exposure, given the timing of collection and nature of the biomarkers used to quantify lead exposure.
Our study has some limitations. The strongest threat to study validity is the possibility of selection bias. First, participants meeting the original eligibility criteria were extremely healthy, possibly selecting for a non-susceptible population. This cannot account for the presence of an adverse association, but may contribute to the small magnitude of the adverse associations. Second, re-use of case-control data could induce bias. To address this, we weighted our analyses by empirically derived sampling weights (Richardson et al., 2007). Finally, loss to follow-up could induce selection bias. However, although we have many fewer participants with three or four cognitive assessments, this is largely by design. In addition, the possibility of residual or unmeasured confounding remains, although we adjusted for many potential confounders, including several measures of socio-economic status; moreover, the homogeneity of our population in terms of profession at enrollment reduces potential for confounding by socioeconomic factors. We have relatively few persons with 3 or 4 cognitive assessments. Nonetheless, our sensitivity analyses indicate that the effects are similar when we restrict to persons with a larger number of assessments. Finally, the exposure to lead experienced by these women is relatively low and we cannot exclude a stronger association at higher exposures; however, the exposures experienced by our cohort reflect those experienced by a community-dwelling female population, making our results more relevant to the general population of women.
In conclusion, our study suggests that lead exposure is weakly associated with cognitive decline in women, at least in some domains. This is in line with previous findings of adverse associations between lead and cognitive decline in predominately male cohorts.
Supplementary Material
Highlights.
Evidence of an association between lead and cognitive decline in women is lacking.
Higher long-term lead exposure predicted faster decline on some cognitive tests. Associations were weak, perhaps due to low lead exposures in these women.
Acknowledgements
This work was supported by the National Institute of Environmental Health Sciences, National Institutes of Health (grants R01 ES005257, R01 ES008074, R21 ES019712, P30 ES000002); and the National Institute of Aging, National Institutes of Health (grant F31 AG038233 to MCP). The funding source had no role in the study design; collection, analysis, or interpretation of the data; writing of the report; or in the decision to submit the article for publication.
Funding Sources: This work was supported by the National Institute of Environmental Health Sciences, National Institutes of Health (grants R01 ES005257, R01 ES008074, R21 ES019712, P30 ES000002); and the National Institute of Aging, National Institutes of Health (grant F31 AG038233 to MCP). The funding source had no role in the study design; collection, analysis, or interpretation of the data; writing of the report; or in the decision to submit the article for publication. The authors report no conflicts of interest.
Abbreviations
- CI
confidence interval
- K-XRF
k-x-ray fluorescence
- NHS
Nurses’ Health Study
- TICS
Telephone Interview for Cognitive Status
Footnotes
This is a PDF file of an unedited manuscript that has been accepted for publication. As a service to our customers we are providing this early version of the manuscript. The manuscript will undergo copyediting, typesetting, and review of the resulting proof before it is published in its final citable form. Please note that during the production process errors may be discovered which could affect the content, and all legal disclaimers that apply to the journal pertain.
The authors report no conflicts of interest.
Ethics. This study was approved by the institutional review boards of the Brigham and Women’s Hospital and the Harvard School of Public Health. Participants provided written informed consent prior to participation in the original studies of lead exposure and provided verbal consent prior to participation in telephone cognitive testing.
Contributor Information
Melinda C Power, Email: melindacpower@gmail.com.
Susan Korrick, Email: resak@channing.harvard.edu.
Eric J Tchetgen Tchetgen, Email: etchetge@hsph.harvard.edu.
Linda H Nie, Email: hnie@purdue.edu.
Francine Grodstein, Email: phfrg@channing.harvard.edu.
Howard Hu, Email: howard.hu@utoronto.ca.
Jennifer Weuve, Email: jweuve@hsph.harvard.edu.
Joel Schwartz, Email: joel@hsph.harvard.edu.
Marc G Weisskopf, Email: mweissko@hsph.harvard.edu.
References
- Adonaylo VN, Oteiza PI. Pb2+ promotes lipid oxidation and alterations in membrane physical properties. Toxicology. 1999;132:19–32. doi: 10.1016/s0300-483x(98)00134-6. [DOI] [PubMed] [Google Scholar]
- Ahamed M, Siddiqui MK. Low level lead exposure and oxidative stress: current opinions. Clin Chim Acta. 2007;383:57–64. doi: 10.1016/j.cca.2007.04.024. [DOI] [PubMed] [Google Scholar]
- Bandeen-Roche K, et al. Cumulative lead dose and cognitive function in older adults. Epidemiology. 2009;20:831–839. doi: 10.1097/EDE.0b013e3181b5f100. [DOI] [PMC free article] [PubMed] [Google Scholar]
- Bassuk SS, et al. Cognitive impairment and mortality in the community-dwelling elderly. Am J Epidemiol. 2000;151:676–688. doi: 10.1093/oxfordjournals.aje.a010262. [DOI] [PubMed] [Google Scholar]
- Bennett DA, et al. Natural history of mild cognitive impairment in older persons. Neurology. 2002;59(2):198–205. doi: 10.1212/wnl.59.2.198. [DOI] [PubMed] [Google Scholar]
- Braga MF, et al. Nanomolar concentrations of lead inhibit glutamatergic and GABAergic transmission in hippocampal neurons. Brain Res. 1999;826:22–34. doi: 10.1016/s0006-8993(99)01194-4. [DOI] [PubMed] [Google Scholar]
- Brandt J, et al. "The Telephone Interview for Cognitive Status.". Neuropsychiatry, Neuropsychology, & Behavioral Neurology. 1988;1(2):111–117. [Google Scholar]
- Colditz GA, et al. The Nurses' Health Study: 20-year contribution to the understanding of health among women. J Womens Health. 1997;6:49–62. doi: 10.1089/jwh.1997.6.49. [DOI] [PubMed] [Google Scholar]
- Gao S, et al. Trace element levels and cognitive function in rural elderly Chinese. J Gerontol A Biol Sci Med Sci. 2008;63:635–641. doi: 10.1093/gerona/63.6.635. [DOI] [PMC free article] [PubMed] [Google Scholar]
- Gaugler JE, et al. Predicting nursing home admission in the U.S: a meta-analysis. BMC Geriatr. 2007;7:13. doi: 10.1186/1471-2318-7-13. [DOI] [PMC free article] [PubMed] [Google Scholar]
- Hu H, et al. Bone lead as a biological marker in epidemiologic studies of chronic toxicity: conceptual paradigms. Environ Health Perspect. 1998;106:1–8. doi: 10.1289/ehp.981061. [DOI] [PMC free article] [PubMed] [Google Scholar]
- Jackson LW, et al. Association between bone turnover, micronutrient intake, and blood lead levels in pre- and postmenopausal women, NHANES 1999–2002. Environ Health Perspect. 2010;118:1590–1596. doi: 10.1289/ehp.1002158. [DOI] [PMC free article] [PubMed] [Google Scholar]
- Jedrychowski W, et al. Gender specific differences in neurodevelopmental effects of prenatal exposure to very low-lead levels: the prospective cohort study in three-year olds. Early Hum Dev. 2009;85:503–510. doi: 10.1016/j.earlhumdev.2009.04.006. [DOI] [PMC free article] [PubMed] [Google Scholar]
- Kang JH, et al. Apolipoprotein E, cardiovascular disease and cognitive function in aging women. Neurobiol Aging. 2005;26:475–484. doi: 10.1016/j.neurobiolaging.2004.05.003. [DOI] [PubMed] [Google Scholar]
- Khalil N, et al. Association of cumulative lead and neurocognitive function in an occupational cohort. Neuropsychology. 2009;23:10–19. doi: 10.1037/a0013757. [DOI] [PubMed] [Google Scholar]
- Kim R, et al. K x-ray fluorescence measurements of bone lead concentration: the analysis of low-level data. Phys Med Biol. 1995;40:1475–1485. doi: 10.1088/0031-9155/40/9/007. [DOI] [PubMed] [Google Scholar]
- Korrick SA, et al. Lead and hypertension in a sample of middle-aged women. Am J Public Health. 1999;89:330–335. doi: 10.2105/ajph.89.3.330. [DOI] [PMC free article] [PubMed] [Google Scholar]
- Korrick SA, et al. Correlates of bone and blood lead levels among middle-aged and elderly women. Am J Epidemiol. 2002;156:335–343. doi: 10.1093/aje/kwf042. [DOI] [PubMed] [Google Scholar]
- Lasley SM, Gilbert ME. Glutamatergic components underlying lead-induced impairments in hippocampal synaptic plasticity. Neurotoxicology. 2000;21:1057–1068. [PubMed] [Google Scholar]
- Lee S, et al. Education, Other Socioeconomic Indicators, and Cognitive Function. American Journal of Epidemiology. 2003;157(8):712–720. doi: 10.1093/aje/kwg042. [DOI] [PubMed] [Google Scholar]
- Machida M, et al. High bone matrix turnover predicts blood levels of lead among perimenopausal women. Environ Res. 2009;109:880–886. doi: 10.1016/j.envres.2009.06.005. [DOI] [PubMed] [Google Scholar]
- Manolio TA, et al. Hypertension and cognitive function: pathophysiologic effects of hypertension on the brain. Curr Hypertens Rep. 2003;5:255–261. doi: 10.1007/s11906-003-0029-6. [DOI] [PubMed] [Google Scholar]
- McNeill FE, et al. Factors affecting in vivo measurement precision and accuracy of 109Cd K x-ray fluorescence measurements. Phys Med Biol. 1999;44:2263–2273. doi: 10.1088/0031-9155/44/9/313. [DOI] [PubMed] [Google Scholar]
- Monteiro IM, et al. Reliability of Routine Clinical Instruments for the Assessment of Alzheimer's Disease Administered by Telephone. Journal of Geriatric Psychiatry and Neurology. 1998;11(1):18–24. doi: 10.1177/089198879801100105. [DOI] [PubMed] [Google Scholar]
- Muldoon SB, et al. Effects of blood lead levels on cognitive function of older women. Neuroepidemiology. 1996;15:62–72. doi: 10.1159/000109891. [DOI] [PubMed] [Google Scholar]
- Muntner P, et al. Continued decline in blood lead levels among adults in the United States: the National Health and Nutrition Examination Surveys. Arch Intern Med. 2005;165:2155–2161. doi: 10.1001/archinte.165.18.2155. [DOI] [PubMed] [Google Scholar]
- Navas-Acien A, et al. Lead exposure and cardiovascular disease--a systematic review. Environ Health Perspect. 2007;115:472–482. doi: 10.1289/ehp.9785. [DOI] [PMC free article] [PubMed] [Google Scholar]
- Nie H, et al. Application and methodology of in vivo K x-ray fluorescence of Pb in bone (impact of KXRF data in the epidemiology of lead toxicity, and consistency of the data generated by updated systems) X-Ray Spectrometry. 2008;37:69–75. [Google Scholar]
- Qiu C, et al. The age-dependent relation of blood pressure to cognitive function and dementia. Lancet Neurol. 2005;4:487–499. doi: 10.1016/S1474-4422(05)70141-1. [DOI] [PubMed] [Google Scholar]
- Rankin M, et al. Correlation Analysis of the In-clinic and Telephone Batteries from the AREDS Cognitive Function Ancillary Study. AREDS Report No. 15. Ophthalmic Epidemiology. 2005;12(4):271–277. doi: 10.1080/09286580591003815. [DOI] [PMC free article] [PubMed] [Google Scholar]
- Rapp SR, et al. Validation of a Cognitive Assessment Battery Administered over the Telephone. Journal of the American Geriatrics Society. 2012;60(9):1616–1623. doi: 10.1111/j.1532-5415.2012.04111.x. [DOI] [PMC free article] [PubMed] [Google Scholar]
- Richardson DB, et al. Analyses of case-control data for additional outcomes. Epidemiology. 2007;18:441–445. doi: 10.1097/EDE.0b013e318060d25c. [DOI] [PubMed] [Google Scholar]
- Schneider JS, et al. Sex-based differences in gene expression in hippocampus following postnatal lead exposure. Toxicol Appl Pharmacol. 2011;256:179–190. doi: 10.1016/j.taap.2011.08.008. [DOI] [PMC free article] [PubMed] [Google Scholar]
- Schulz R, Beach SR. Caregiving as a risk factor for mortality: the Caregiver Health Effects Study. JAMA. 1999;282:2215–2219. doi: 10.1001/jama.282.23.2215. [DOI] [PubMed] [Google Scholar]
- Schwartz BS, et al. Occupational lead exposure and longitudinal decline in neurobehavioral test scores. Epidemiology. 2005;16:106–113. doi: 10.1097/01.ede.0000147109.62324.51. [DOI] [PubMed] [Google Scholar]
- Schwartz BS, et al. Past adult lead exposure is associated with longitudinal decline in cognitive function. Neurology. 2000;55:1144–1150. doi: 10.1212/wnl.55.8.1144. [DOI] [PubMed] [Google Scholar]
- Seeman E. Reduced bone formation and increased bone resorption: rational targets for the treatment of osteoporosis. Osteoporos Int. 2003;14(Suppl 3):S2–S8. doi: 10.1007/s00198-002-1340-9. [DOI] [PubMed] [Google Scholar]
- Shaw WS, et al. Longitudinal analysis of multiple indicators of health decline among spousal caregivers. Ann Behav Med. 1997;19:101–109. doi: 10.1007/BF02883326. [DOI] [PubMed] [Google Scholar]
- Shih RA, et al. Environmental lead exposure and cognitive function in community-dwelling older adults. Neurology. 2006;67:1556–1562. doi: 10.1212/01.wnl.0000239836.26142.c5. [DOI] [PubMed] [Google Scholar]
- Shih RA, et al. Cumulative lead dose and cognitive function in adults: a review of studies that measured both blood lead and bone lead. Environ Health Perspect. 2007;115:483–492. doi: 10.1289/ehp.9786. [DOI] [PMC free article] [PubMed] [Google Scholar]
- Tabert MH, et al. Neuropsychological prediction of conversion to Alzheimer disease in patients with mild cognitive impairment. Arch Gen Psychiatry. 2006;63:916–924. doi: 10.1001/archpsyc.63.8.916. [DOI] [PubMed] [Google Scholar]
- Unverzagt FW, et al. The Indiana University Telephone-Based Assessment of Neuropsychological Status: A new method for large scale neuropsychological assessment. Journal of the International Neuropsychological Society. 2007;13(05):799–806. doi: 10.1017/S1355617707071020. [DOI] [PMC free article] [PubMed] [Google Scholar]
- van Wijngaarden E, et al. Bone lead levels are associated with measures of memory impairment in older adults. Neurotoxicology. 2009;30:572–580. doi: 10.1016/j.neuro.2009.05.007. [DOI] [PMC free article] [PubMed] [Google Scholar]
- van Wijngaarden E, et al. Blood lead levels in relation to cognitive function in older U.S. adults. Neurotoxicology. 2011;32:110–115. doi: 10.1016/j.neuro.2010.11.002. [DOI] [PubMed] [Google Scholar]
- Ware J, et al. SF-36 Health Survey: Manual Interpretation and Guide. Boston, MA: Nimrod Press; 1993. [Google Scholar]
- Weisskopf MG, et al. Cumulative lead exposure and cognitive performance among elderly men. Epidemiology. 2007;18:59–66. doi: 10.1097/01.ede.0000248237.35363.29. [DOI] [PubMed] [Google Scholar]
- Weisskopf MG, et al. Cumulative lead exposure and prospective change in cognition among elderly men: the VA Normative Aging Study. Am J Epidemiol. 2004;160:1184–1193. doi: 10.1093/aje/kwh333. [DOI] [PubMed] [Google Scholar]
- Weuve J, et al. Cumulative exposure to lead in relation to cognitive function in older women. Environ Health Perspect. 2009;117:574–580. doi: 10.1289/ehp.11846. [DOI] [PMC free article] [PubMed] [Google Scholar]
- Wilker E, et al. Longitudinal changes in bone lead levels: the VA Normative Aging Study. J Occup Environ Med. 2011;53:850–855. doi: 10.1097/JOM.0b013e31822589a9. [DOI] [PMC free article] [PubMed] [Google Scholar]
- Wright RO, et al. Lead exposure biomarkers and mini-mental status exam scores in older men. Epidemiology. 2003;14:713–718. doi: 10.1097/01.EDE.0000081988.85964.db. [DOI] [PubMed] [Google Scholar]
Associated Data
This section collects any data citations, data availability statements, or supplementary materials included in this article.