Abstract
Background
Characterizing the smoking patterns for different birth cohorts is essential for evaluating the impact of tobacco control interventions and predicting smoking-related mortality, but the process of estimating birth cohort smoking histories has received limited attention.
Purpose
Smoking history summaries were estimated beginning with the 1890 birth cohort in order to provide fundamental parameters that can be used in studies of cigarette smoking intervention strategies
Methods
U.S. National Health Interview Surveys conducted from 1965 to 2009 were used to obtain cross-sectional information on current smoking behavior. Surveys that provided additional detail on history for smokers including age at initiation and cessation, and smoking intensity were used to construct smoking histories for participants up to the date of survey. After incorporating survival differences by smoking status, age-period cohort models with constrained natural splines were used to estimate the prevalence of current, former and never smokers in cohorts beginning in 1890. This approach was then used to obtain yearly estimates of initiation, cessation and smoking intensity for the age-specific distribution for each birth cohort. These rates were projected forward through 2050 based on recent trends.
Results
This summary of smoking history shows clear trends by gender, cohort and age over time. If current patterns persist, a slow decline in smoking prevalence is projected from 2010 through 2040.
Conclusions
A novel method of generating smoking histories has been applied to develop smoking histories that can be used in micro-simulation models, and has been incorporated in the National Cancer Institute’s Smoking History Generator. These aggregate estimates developed by age, gender and cohort will provide a complete source of smoking data over time.
Introduction
The first Surgeon General’s Report (SGR) on smoking and health provided a comprehensive review for harmful effects of cigarette smoking.1 Quantifying the effect of antismoking campaigns in the U.S. is an important measure of progress in controlling the impact of smoking as an significant cause of death.2 The National Cancer Institute’s Cancer Intervention and Surveillance Modeling Network (CISNET) estimated the impact on lung cancer deaths of tobacco control that followed the SGR.1,3 Since chronic diseases can have long latency, it is essential to capture detail in the life-course exposure to a causal agent like smoking. A variety of models were used by CISNET, but all shared common simulated smoking histories.4 Age-period cohort models were applied to smoking data from the National Health Interview Survey (NHIS) to estimate smoking histories, including smoking prevalence, duration and intensity, which were used to quantify the related disease risk.
Although the NHIS began collecting information on smoking in 1965, no cohort has yet been followed over their lifetime, and most have been surveyed only over relatively short epochs. Surveys began collecting information on smoking initiation and cessation in 1970, but direct estimates of initiation probabilities for a cohort using retrospectively constructed smoking histories from cross-sectional surveys are biased downward because smokers are less likely to survive for interview. Various approaches have been used for adjustment when constructing smoking history summaries for birth cohorts,5–10 including: (1) incorporating external data from cohort studies that estimate the smoking effect on survival, and (2) extrapolating from age trends to a point when bias is negligible.
Harris5 reported estimates of smoking prevalence for 1900–1980 by 10-year birth cohorts beginning with 1881. Estimates of the impact of smoking on differential mortality were obtained from a U.S. veterans’ study for men11 and an American Cancer Society study for women.12 A limitation of this approach is that some data for survival analyses may not be representative; veterans may be more or less healthy than the U.S. population. In addition, Harris estimated only smoking prevalence, which is not sufficient for determining smoking effects on disease. In a novel approach, Anderson et al.10 developed cohort data using NHIS data through 2000. They did not directly allow for deaths and alternative transitions that modify the population structure, but calibrated estimates to allow for differential mortality by smoking status.
In the current paper, the work of Anderson et al.10 was extended through 2009 using an novel methodology, which captures age, period and cohort effects while accounting for differential mortality that modify the population structure between smokers and nonsmokers. Instead of separately analyzing 5-year birth cohorts and then determining single year estimates through interpolation, a single model was developed for the entire data set which directly yielded maximum likelihood estimates of the smoking parameters. Prevalence of current, former, and never smokers, smoking intensity (cigarettes per day [CPD]), and yearly initiation and cessation probabilities were estimated by age and year of birth (1890–2035). In addition, a future scenario, which assumes that the most recent patterns in initiation and cessation rates are maintained beyond Year 2009, is generated to project through the Year 2050.
Methods
Data
Data were obtained from 33 NHIS surveys administered from 1965–2009 (1965–1966, 1970, 1974, 1976–1980, 1983, 1985, 1987–1988, 1990–1995, 1997–2009). Each provided smoking status (current, former, or never), which was used for cross-sectional estimates of the smoking prevalence by age and survey year. A subset (1970, 1978–1980, 1987–1988, 1992, 1995, 1997–2001) collected age of smoking initiation and cessation, which was used to retrospectively reconstruct smoking histories up until the date of survey.
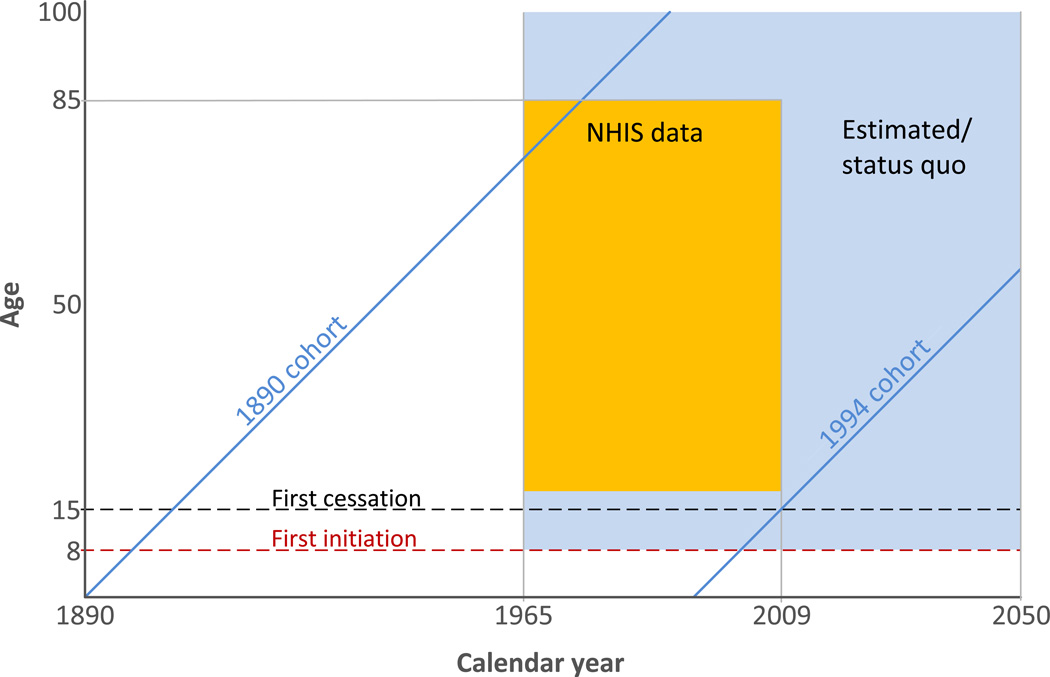
The objective was to characterize U.S. smoking history by gender to age 99 for calendar years 1965–2050 beginning with the 1890 birth cohort. Figure 1 shows the time perspectives required to summarize smoking histories. Lifetime smoking experience for birth cohorts was reconstructed beginning with those born after 1889, covering all but the upper left corner of the window for the population after 1974 (green area in Figure 1). Cross-sectional surveys are available for the box covering years 1965–2009 and ages 18–84 (colored in yellow). The 1890 birth cohort was represented in the 1965 survey by subjects 75 and older. Survey participants must be at least 18, so the most recent cohort was born in 1991 and would have had a very short smoking history. Hence, extrapolation beyond the range of observed data was necessary to obtain estimates for the entire time window in Figure 1.
Figure 1.
Age, period and cohorts used in this analysis. The earliest birth cohort is 1890 and the latest cohort providing cessation data is 1994. Cessation probabilities were assumed to be 0 before age 15 (black dashed line) and initiation probabilities were assumed to be 0 before age 8 (red dashed line). NHIS data are available for ages 18–85 and year 1965–2009 (yellow box). Ages and years with projected estimates from the model are shown in green.
Smoking History Model
A simple, but typical compartment model for smoking history was adopted, which begins with the transition from never to current smoker, followed by the transition to former smoker. Yearly transition probabilities were conditional on a hypothetical scenario of no transitions, described in more detail in Appendix A (available at www.ajpmonline.org). Smoking history parameters were estimated using an age, period and cohort model. Letting a represent age, t period or calendar year, and c cohort or year of birth, temporal indicators are related by c = t − a.
First, the initiation probability was estimated, that is, the conditional probability that an individual in cohort c started smoking at age a, given that she was a nonsmoker at a−1. These were used to estimate the cumulative proportion of ever smokers at age a using life table methods, but as a cohort gets older this estimate is biased because of mortality differences by smoking status.13
Beginning at age 15, current to former smoker transition was parameterized by the smoking cessation probability conditional on the subject being alive and currently smoking. This differs from NHIS, which reports status at interview and cannot account for relapse in which a subject would not yet have become a former smoker under the definition adopted here. For a given cohort, the cumulative proportion of smokers who had not quit by age a is 1 minus the product of the conditional probabilities of not quitting. It was assumed that the cessation probability did not depend on age at initiation, smoking intensity or other factors. As initiation usually occurs in a narrow age range, variation in time from initiation tends to have a diminished effect on mortality as the cohort ages.
Never smokers are the complement of ever smokers, determined by subtracting the ever smoker prevalence from 1. Because current smokers represented ever smokers who had not quit, the assumption that cessation was independent of smoking history implied that current smoker prevalence was the product of ever smoker prevalence and the complement of cumulative probability of cessation. Finally, former smokers were those who had smoked but quit before age a, which was the difference between the ever smoker and current smoker prevalence.
Estimation Of Smoking Parameters
To complete smoking histories, each temporal effect was represented as a nonparametric function applied to the range of interest using an age-period cohort model. The generalized inverse solution was calculated by PROC GENMOD in SAS® to resolve the well-known identifiability problem, which usually constrained cohort slope to be zero. Fitted values used as outcomes are an estimable combination of three temporal factors and thus identical for any arbitrary constraint.14–17 The methods are described in greater detail in Appendix A (available at www.ajpmonline.org).
For years covered by surveys, that is, 1965–2009, the prevalence of ever smokers was first estimated by age and cohort using an age-cohort linear logistic model. As for all of the models below, constrained natural cubic splines18 provided nonparametric additive effects. Unadjusted estimates of annual age-specific smoking initiation probabilities by cohort were obtained using NHIS surveys. For each age, the number of individuals who started smoking was determined among never smokers to that point. Retrospectively estimated cohort-specific initiation probabilities are affected by differential mortality between never and ever smokers. Consequently, a multiplicative constant was determined that aligned actuarial and cross-sectional estimates of ever smokers at an age when there is little bias from differential mortality. Cohorts born before 1935 have survey data only for ages over 30, the age at which differential mortality begins to introduce bias. In recent cohorts almost all smoking initiation occurred before 30, but it was not uncommon for those born early in the twentieth century, especially women, to initiate later in life.10 Later smoking initiation would also tend to postpone the effect of differential mortality.
As smoking cessation is often not successful, a rule was adopted for cessation to assure that those who were considered to quit were likely to remain as former smokers. Subjects who report quitting must have quit smoking at least 2 years before interview; otherwise their period of observation was regarded as being truncated at the given age at cessation. For each year of age following smoking initiation, a binary response was created using the chosen definition of quitting. Conditional cessation probabilities were used to generate the cumulative probability of quitting by age for each cohort. An upper age limit of 85 was a selection criterion for NHIS surveys. Since cessation probabilities were already high by age 85 and smoking prevalence was low (due to high death rates), cessation probabilities were assumed to remain at the level for age 85 in subsequent ages. To project beyond information available from surveys, the age effect was assumed to remain unchanged and period and cohort effects stayed at the 1979 level.
Because reported numbers of cigarettes smoked per day (CPD) were clumped at half or whole packs, smoking dose was classified as an ordered categorical response: CPD≤5; 5< CPD≤15; 15<CPD≤25; 25<CPD≤35; 35<CPD≤45; and 45<CPD. An age-period cohort cumulative logistic model was fitted to the data using constrained natural splines for temporal effects. The fitted estimates of probabilities for each dose category were used to estimate the smoking intensity distribution. Estimates for cohorts born before 1920 were constrained to be the same as the 1920 birth cohort. Similarly, estimates for cohorts born after 2002 were arbitrarily constrained to be identical to those of the 2002 cohort, who would be 7 in 2009, the year before earliest age at initiation.
Because the 1979 cohort is the most recent cohort providing smoking history data through age 30 in the surveys, the cohort effect for initiation and cessation was assumed to remain constant for this and subsequent cohorts. The data were also projected forward beyond Year 2009 assuming recent trends in initiation and cessation rates are maintained, thereby providing a status quo future projection through the Year 2050.
Results
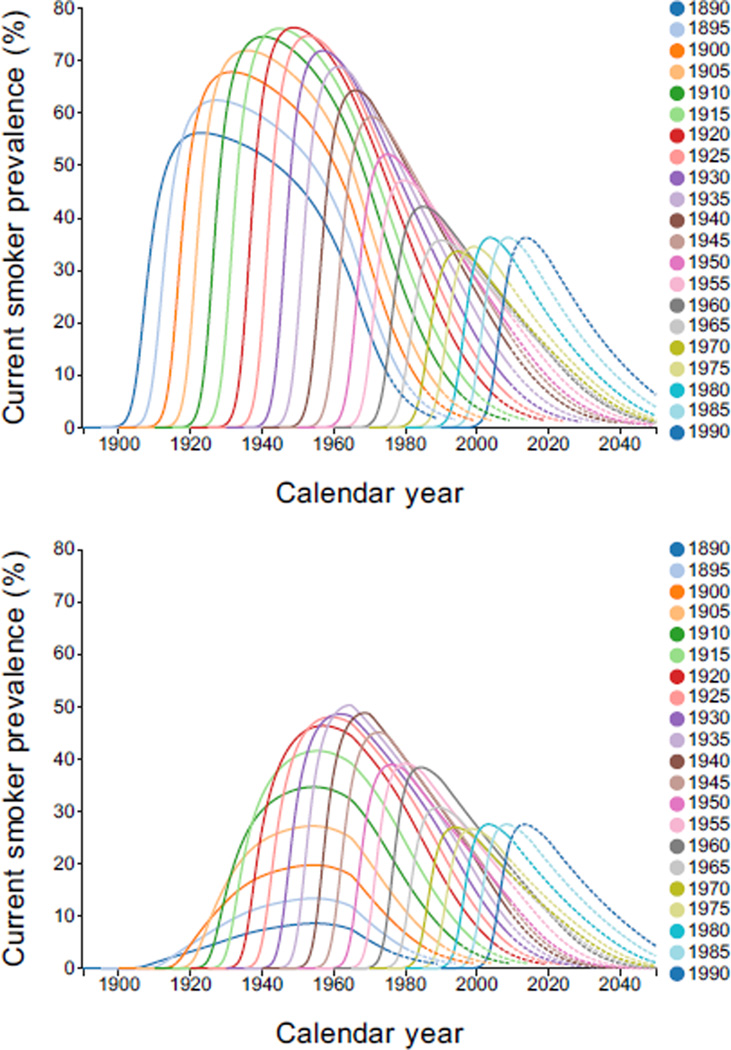
Current smoker prevalence was estimated by year, but only quinquennial cohorts are shown in Figure 2. For men, the patterns have remained somewhat consistent, increasing to a peak, followed by a decline. In cohorts born after 1920, the decline was steeper, reflecting increased cessation probabilities. Peaks increased until the 1920 cohort and subsequently declined. For women, the prevalence in early cohorts was lower than for men, and the increase for the 1890 cohort continued much longer. Peaks for many cohorts born before 1920 tended to occur around 1950, consistent with change in public acceptance of female smoking. In recent cohorts, pattern and level were only slightly lower than their male counterparts.
Figure 2.
Current smoker prevalence by gender, calendar year, and birth cohort. Dashed lines indicate regions of extrapolation. Interactive Plot: [Males, Females].
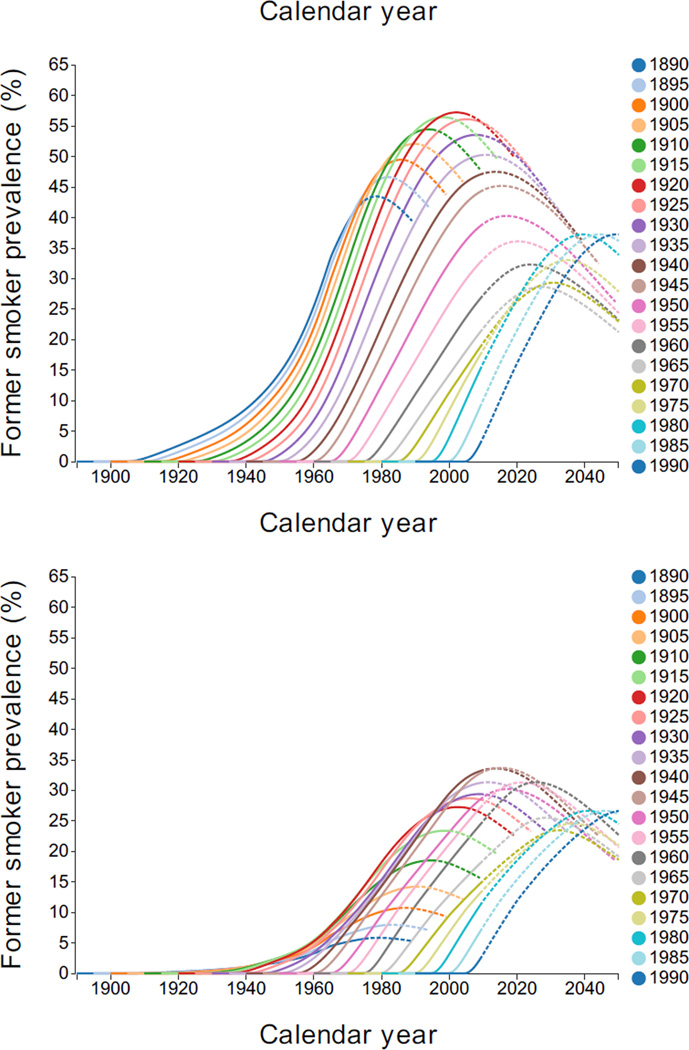
Figure 3 shows former smoker prevalence by year, quinquennial birth cohort, and gender. Males born after 1920 showed more decline with age than those born earlier. Among women, the pattern for early cohorts differed from men, since smoking prevalence tended to increase at older ages.
Figure 3.
Former smoker prevalence by gender, calendar year, and birth cohort. Dashed lines indicate regions of extrapolation. Interactive Plot: [Males, Females].
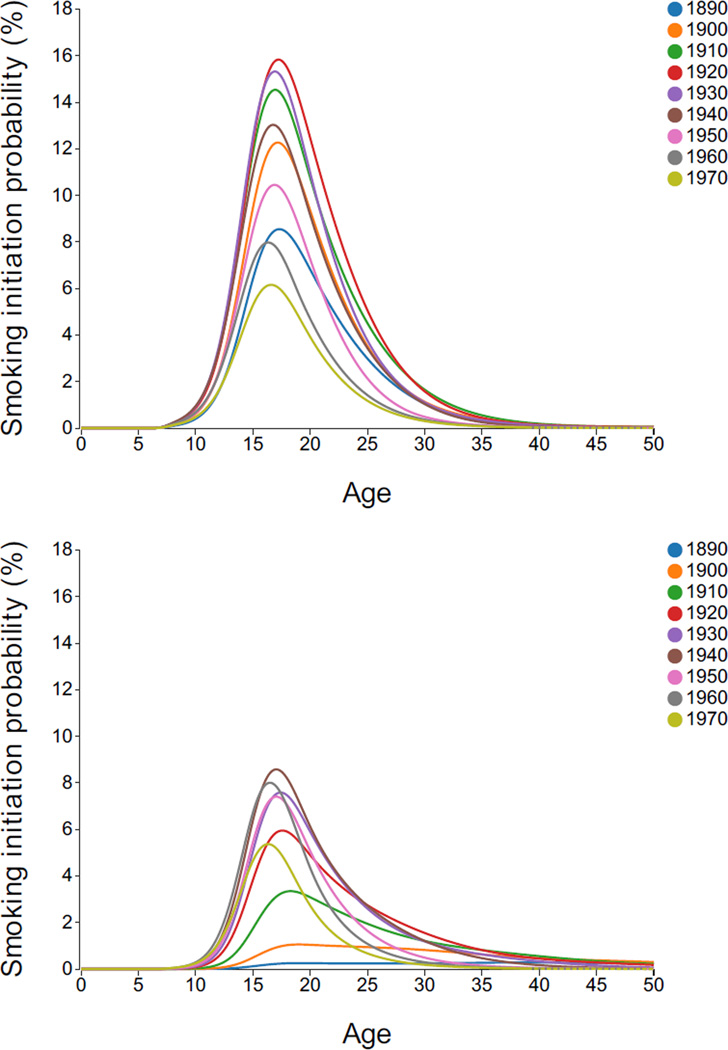
Annual initiation probabilities are shown in Figure 4 by age, decennial birth cohort, and gender. For men, a similar shape remained, beginning to increase at age 10, achieved a peak in late teens and then declining, with few initiating smoking after 30, except in earliest cohorts. Women had considerably lower initiation probabilities, especially in early cohorts. Earliest cohorts remained near the peak well into late 30s, but recent cohort patterns are similar to men.
Figure 4.
Annual smoking initiation probabilities by gender, age and birth cohort. Dashed lines indicate regions of extrapolation. Interactive Plot: [Males, Females].
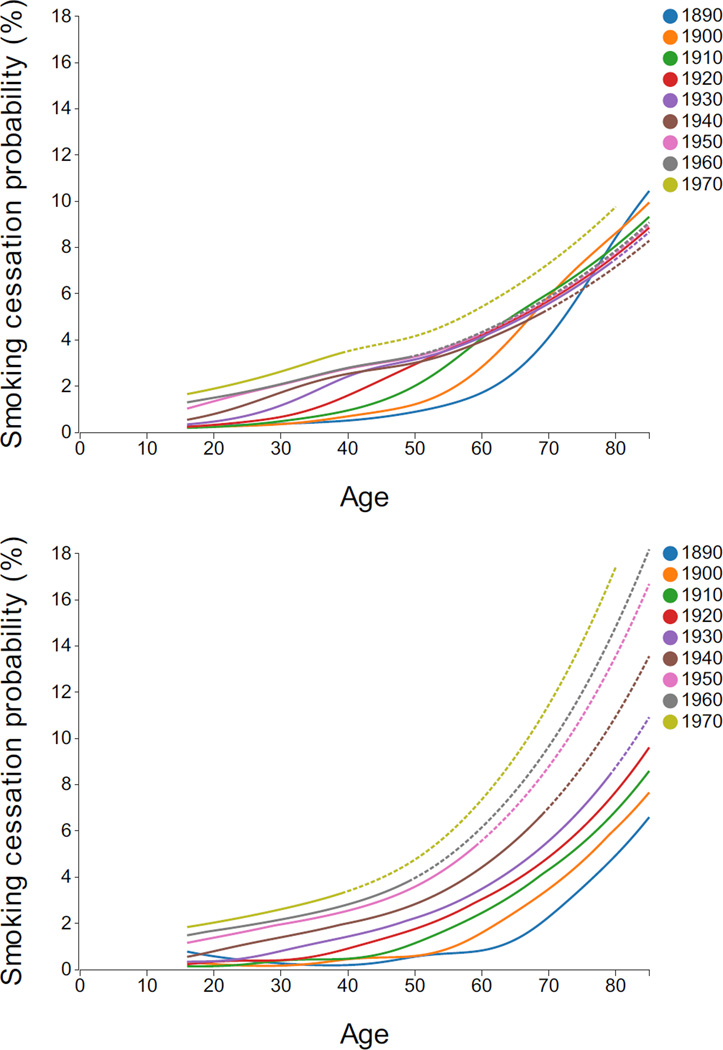
Annual cessation probabilities by age, decennial birth cohort, and gender are displayed in Figure 5. The cessation probabilities increased with age at accelerating rates, especially after age 60 and especially for the most recent cohorts.
Figure 5.
Annual smoking cessation probabilities by gender, age and birth cohort. Dashed lines indicate regions of extrapolation. Interactive Plot: [Males, Females].
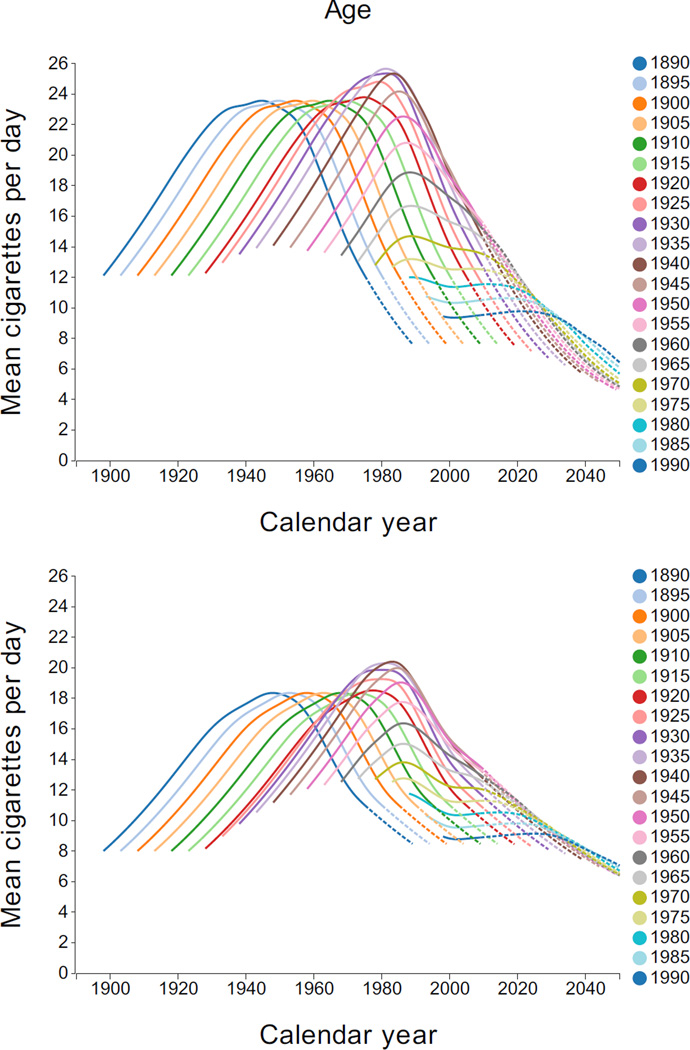
A central value near the mean for each smoking intensity category, along with the estimated probability of that intensity was used to determine mean smoking intensity. Figure 6 shows the estimated mean CPD by year, quinquennial birth cohort, and gender. Male levels were higher than female. For early cohorts, the mean CPD tended to increase and then decline with age. However, this pattern is not as apparent in recent cohorts, which tends to be lower and to vary little with age.
Figure 6.
Mean cigarettes per day by gender, calendar year, and birth cohort. Dashed lines indicate regions of extrapolation. Interactive Plot: [Males, Females].
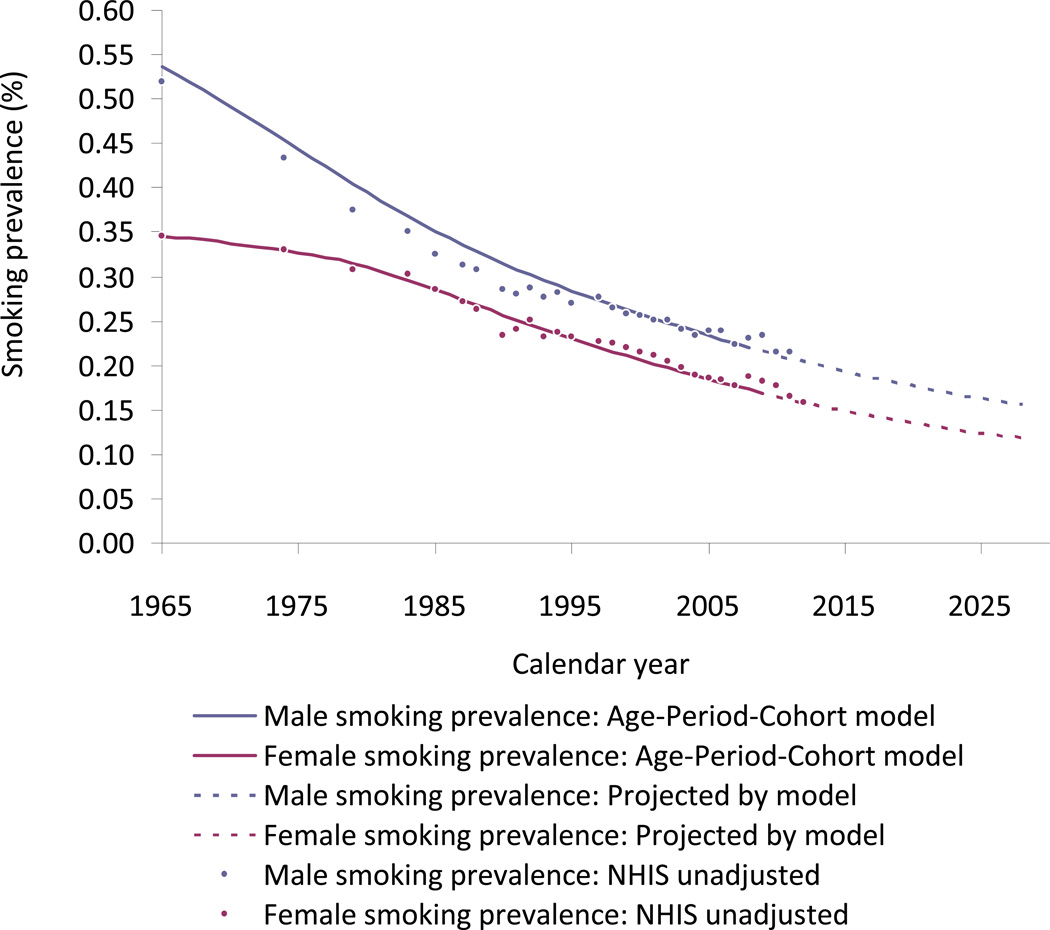
The estimates of smoking prevalence (ages 18 years and above, weighted by population from SEER Stat 8.01)19 by year from 1975 through 2030 are shown in Figure 7. Male smoking prevalence falls at a decreasing rate over time approaching 16% in 2030. Female smoking prevalence declines more slowly initially due to increased smoking among some cohorts, but then follows a trend similar to that of male smokers, approaching a rate of 11% in 2030. The estimates and projections from the model are compared to actual estimates from NHIS by year, and are shown to predict well except that the model over-predicts male prevalence between 1965 and 1990. This over-prediction was largely confined to the group aged 25–34 years.
Figure 7.
Estimates of smoking prevalence (ages 18 years and above, weighted by population from SEER Stat 8.01) by year from 1975 through 2030 compared to unadjusted NHIS results. Interactive Plot: [Male/Female].
Discussion
The National Cancer Institute’s previously developed Smoking History Generator (SHG)4 was extended up to 2009, and an improved methodology was developed that provided a status quo scenario through 2050. This approach improves previous efforts to assess smoking because it does not simply assess the impact of smoking at a particular point in time based on estimates of smoking prevalence from surveys.2 Instead, it captures population dynamics affecting duration of exposure resulting from changing initiation and cessation rates, and analysis by birth cohort offers an important temporal perspective that has been used to reconstruct the smoking exposure history. Harris5 recognized the importance of this perspective and used it to estimate smoking prevalence for cohorts going back to the late nineteenth century. The results presented here not only update those estimates, but also extend essential details on smoking history needed to for quantifying the impact of smoking on health by estimating initiation and cessation that yields smoking duration, and smoking intensity.
Some of the impact of societal forces affecting smoking can be gleaned from prevalence curves (Figure 2). Males early in the twentieth century showed a rapid increase followed by decline beginning even before the 1964 SGR.1 Patterns are more complex for women, in which the peak declines to a plateau from 1950–1960 before declining further. Women also had extended initiation rates for the 1890–1920 cohorts (Figure 4). Although different in earlier cohorts, female smoking patterns are now similar to that of male patterns. Temporal patterns are also apparent for prevalence for intensity (Figure 6), which showed distinct age patterns by cohort. These distinctive temporal patterns are important in quantifying disease risk.
In developing the smoking history estimates, simplifying assumptions were made to consider transitions from nonsmoker to smoker and smoker to former smoker. Due to survey limitations, former smokers were defined as those who had not relapsed within 2 years without allowing for more complex behavior including relapse after the second year or multiple transitions between smoking states. In addition, cessation probabilities did not depend on age at initiation, past cessation history, or smoking intensity. The model generally fits the NHIS data well. An exception is age 25–34 smoking prevalence, which may result from not incorporating their relatively high relapse rate. More comprehensive models might incorporate stochastic processes, transitions among additional smoking compartments (e.g., former smokers), covariates that modify transition rates (e.g., light smokers may be more likely to quit) and smoking status-specific death rates.
While data since 2009 indicate that the projections fit reasonably well, the projections depend primarily on cohorts through 1980. Nevertheless, initiation and cessation may have slowed in recent cohorts, and it will be important to monitory changes in order to maintain the relevance of parameters in the model.
The results are also subject to data limitations. In general, analysis of smoking behavior prior to 1965 depends on the recall of information on smoking cessation and initiation. Prior to 1974, smoking data were collected either as self-report or by proxy with any other adult member of the household. Proxy status is reasonably valid for current smoking status,20,21 but may not be valid for age of initiation and cessation, or for the intensity of smoking. In particular, the information used from the 1970 NHIS may be biased.
The smoking history estimates developed here are incorporated into the revised NCI’s SHG (resources.cisnet.cancer.gov/projects/#shg). The SHG can be used in computational models to assess the impact of smoking on public health risks, and the effect of tobacco control strategies designed to change smoking patterns. Using Human Mortality Database cohort life tables for all causes22,23 and relative risk estimates from cohort studies, smoking status–specific mortality rates are also provided. Other cause mortality rates can be obtained by subtracting probabilities for that cause from the all-cause mortality.24 Life tables for current, former, and never smokers can then be obtained using the prevalence estimates along with relative risks.25
The extended SHG with NHIS data through 2009 will be used by the members of the CISNET group to explore the impact of past and future tobacco control policies, such as cigarette taxes, smokefree air laws, and media campaigns.26–31 Currently, the potential effects of tobacco control policies30 relative to the status quo scenario are being incorporated into the SHG.
Estimates of smoking histories by single year of age (0–99) and birth cohort (1890–2040) are also available for current, former and never smoker prevalence, annual initiation and cessation probability, and smoking intensity distribution. Previous empirical studies of tobacco control policies do not distinguish their effects by cohort, as distinct by age or gender. For example, those smokers who initiated smoking before the implementation of recent smokefree air laws and price increases may have had different reactions to new product introductions and media campaigns than those initiating after these policies were implemented. The aggregated yearly smoking data by gender, age or cohort may be used to empirically distinguish age, period and birth-cohort effects of policies on smoking prevalence, initiation, cessation and intensity.
Supplementary Material
Acknowledgments
This work was supported by the National Cancer Institute of the U.S. National Institutes of Health (grant CA152956).
Footnotes
Publisher's Disclaimer: This is a PDF file of an unedited manuscript that has been accepted for publication. As a service to our customers we are providing this early version of the manuscript. The manuscript will undergo copyediting, typesetting, and review of the resulting proof before it is published in its final citable form. Please note that during the production process errors may be discovered which could affect the content, and all legal disclaimers that apply to the journal pertain.
No financial disclosures were reported by the authors of this paper.
References
- 1.Surgeon General’s Advisory Committee on Smoking and Health. Smoking and Health: Report of the Advisory Committee to the Surgeon General of the Public Health Service. U.S. Department of Health, Education, and Welfare, Public Health Service, Office of the Surgeon General; 1964. 1964. [Google Scholar]
- 2.Warner KE. Effects of the antismoking campaign: An update. Am J Public Health. 1989;79:144–151. doi: 10.2105/ajph.79.2.144. [DOI] [PMC free article] [PubMed] [Google Scholar]
- 3.Moolgavkar SH, Holford TR, Levy DT, et al. Impact of the reduction in tobacco smoking on lung cancer mortality in the U.S. during the period 1975–2000. J Natl Cancer Inst. 2012;104:541–548. doi: 10.1093/jnci/djs136. [DOI] [PMC free article] [PubMed] [Google Scholar]
- 4.Jeon J, Meza R, Krapcho M, Clarke LD, Byrne J, Levy DT. Actual and counterfactual smoking prevalence rates in the U.S. population via microsimulation. Risk Anal. 2012;32:S51–S68. doi: 10.1111/j.1539-6924.2011.01775.x. [DOI] [PMC free article] [PubMed] [Google Scholar]
- 5.Harris JE. Cigarette smoking among successive birth cohorts of men and women in the United States during 1900–80. J Natl Cancer Inst. 1983;71:473–479. [PubMed] [Google Scholar]
- 6.U.S. Public Health Service. The health consequences of smoking for women: A report of the Surgeon General. Rockville MD: Department of Health and Human Services, Public Health Service, Office of the Assistant Secretary of Health, Office on Smoking and Health; 1980. Office of the Surgeon General U.S. [Google Scholar]
- 7.U.S. Public Health Service. The health consequences of smoking: Cancer and chronic lung disease in the workplace, a report of the Surgeon General. Rockville MD: USDHHS, Public Health Service, Office on Smoking and Health; 1985. Office of the Surgeon General, United States. Office on Smoking and Health. [Google Scholar]
- 8.Burns DM, Lee LL, Gilpin B, Tolley HD, Vaughn JW, Shanks T. Cigarette smoking behavior in the United States. In: Burns DM, Garfinkel L, Samet JH, editors. Changes in Cigarette Related Disease Risks and Their Implications for Prevention and Control. Bethesda: National Cancer Institute; 1997. [Google Scholar]
- 9.National Cancer Institute. Strategies to control tobacco use in the United States: A blueprint for public health action in the 1990s. Rockville, MD: U.S. Department of Health and Human Services, Public Health Service, National Cancer Institute; 1991. [Google Scholar]
- 10.Anderson CM, Burns DM, Dodd KW, Feuer EJ. Birth-cohort-specific estimates of smoking behaviors for the U.S. population. Risk Anal. 2012;32:S14–S24. doi: 10.1111/j.1539-6924.2011.01703.x. [DOI] [PMC free article] [PubMed] [Google Scholar]
- 11.Rogot E, Murray JL. Smoking and causes of death among U.S. veterans: 16 years of observation. Public Health Rep. 1980;95:213–222. [PMC free article] [PubMed] [Google Scholar]
- 12.Hammond EC. Smoking in relation to the death rates of one million men and women. J Natl Cancer Inst Monogr. 1980;19:127–204. [PubMed] [Google Scholar]
- 13.Chiang CL. The Life Table and Its Applications. Malabar FL: Krieger Publishing Co; 1984. [Google Scholar]
- 14.Fienberg SE, Mason WM. Identification and estimation of age-period-cohort models in the analysis of discrete archival data. In: Schuessler KF, editor. Sociological Methodology. San Francisco: Jossey-Bass, Inc.; 1978. pp. 1–67. 1979. [Google Scholar]
- 15.Holford TR. The estimation of age, period and cohort effects for vital rates. Biometrics. 1983;39:311–324. [PubMed] [Google Scholar]
- 16.Holford TR. An alternative approach to statistical age-period-cohort analysis. J Clin Epidemiol. 1985;38:831–836. doi: 10.1016/0021-9681(85)90106-7. [DOI] [PubMed] [Google Scholar]
- 17.Holford TR. Understanding the effects of age, period and cohort on incidence and mortality rates. Annu Rev Public Health. 1991;12:425–457. doi: 10.1146/annurev.pu.12.050191.002233. [DOI] [PubMed] [Google Scholar]
- 18.Durrleman S, Simon R. Flexible regression models with cubic splines. Stat Med. 1989;8:551–561. doi: 10.1002/sim.4780080504. [DOI] [PubMed] [Google Scholar]
- 19.SEER*Stat Database: Populations—Total U.S. (1969–2011)<Single Ages to 85+, Katrina/Rita Adjustment> - Linked To County Attributes—Total U.S., 1969–2011 Counties, National Cancer Institute, DCCPS, Surveillance Research Program, Surveillance Systems Branch, released October 2012. National Cancer Institute, DCCPS, Surveillance Research Program, Surveillance Systems Branch; 2012. [Google Scholar]
- 20.Hyland A, Cummings KM, Lynn WR, Corle D, Giffen CAE. Effect of proxy-reported smoking status on population estimates of smoking prevalence. Am J Epidemiol. 1997;145:746–751. doi: 10.1093/aje/145.8.746. [DOI] [PubMed] [Google Scholar]
- 21.Gilpin EA, Pierce JP, Cavin SW, et al. Estimates of population smoking prevalence: self-vs proxy reports of smoking status. Am J Public Health. 1994;84:1576–1579. doi: 10.2105/ajph.84.10.1576. [DOI] [PMC free article] [PubMed] [Google Scholar]
- 22.Human Mortality Database. 2013 www.motality.org. [Google Scholar]
- 23.Life Tables for the United States Social Security Area 1900–2080. U.S. Department of Health and Human Services; 1992. Office of the Actuary. [Google Scholar]
- 24.National Center for Health Statistics. Statistics. 2013 www.cdc.gov/nchs.
- 25.Rosenberg MA, Feuer EJ, Yu B, et al. Cohort life tables by smoking status, removing lung cancer as a cause of death. Risk Anal. 2012;32:S25–S38. doi: 10.1111/j.1539-6924.2011.01662.x. [DOI] [PMC free article] [PubMed] [Google Scholar]
- 26.Levy DT, Nikolayev L, Mumford E. Recent trends in smoking and the role of public policies: Results from the SimSmoke and tobacco control policy simulation model. Addiction. 2005;100:1526–1536. doi: 10.1111/j.1360-0443.2005.01205.x. [DOI] [PubMed] [Google Scholar]
- 27.Fichtenberg CM, Glantz SA. Association of the California tobacco control program with declines in cigarette consumption and mortality from heart disease. N Engl J Med. 2000;343:1772–1777. doi: 10.1056/NEJM200012143432406. [DOI] [PubMed] [Google Scholar]
- 28.Fichtenberg CM, Glantz SA. Effect of smoke-free workplaces on smoking behaviour: Systematic review. BMJ. 2002;325:188–191. doi: 10.1136/bmj.325.7357.188. [DOI] [PMC free article] [PubMed] [Google Scholar]
- 29.Levy DT, Chaloupka F, Gitchell J. The effects of tobacco control policies on smoking rates: A tobacco control scorecard. J Public Health Manag Pract. 2004;10:338–353. doi: 10.1097/00124784-200407000-00011. [DOI] [PubMed] [Google Scholar]
- 30.Levy DT, Bauer JE, Lee H-R. Simulation modeling and tobacco control: Creating more robust public health policies. Am J Public Health. 2006;96:494–498. doi: 10.2105/AJPH.2005.063974. [DOI] [PMC free article] [PubMed] [Google Scholar]
- 31.Levy DT, Ross H, Powell L, Bauer JE, Lee H-R. The role of public policies in reducing smoking prevalence and deaths caused by smoking in Arizona: Results from the Arizona tobacco policy simulation model. J Public Health Manag Pract. 2007;13:59–67. doi: 10.1097/00124784-200701000-00010. [DOI] [PubMed] [Google Scholar]
Associated Data
This section collects any data citations, data availability statements, or supplementary materials included in this article.


