

Abstract
Background
Despite the common occurrence of aortic stenosis, the cellular causes of the disorder are unknown, in part because of the absence of experimental models. We hypothesized that atherosclerosis and early bone matrix expression in the aortic valve occurs secondary to experimental hypercholesterolemia and that treatment with atorvastatin modifies this transformation.
Methods and Results
To test this hypothesis, we developed an experimental hypercholesterolemic rabbit model. New Zealand White rabbits (n=48) were studied: group 1 (n=16), normal diet; group 2 (n=16), 1% (wt/wt) cholesterol diet; and group 3 (n=16), 1% (wt/wt) cholesterol diet plus atorvastatin (3 mg/kg per day). The aortic valves were examined with hematoxylin and eosin stain, Masson trichrome, macrophage (RAM 11), proliferation cell nuclear antigen (PCNA), and osteopontin immunostains. Cholesterol and highly sensitive C-reactive protein (hsCRP) serum levels were obtained by standard assays. Computerized morphometry and digital image analysis were performed for quantifying PCNA (% area). Electron microscopy and immunogold labeling were performed for osteopontin. Semiquantitative RT-PCR was performed for the osteoblast bone markers [alkaline phosphatase, osteopontin, and osteoblast lineage-specific transcription factor (Cbfa-1)]. There was an increase in cholesterol, hsCRP, PCNA, RAM 11, and osteopontin and osteoblast gene markers (alkaline phosphatase, osteopontin, and Cbfa-1) in the cholesterol-fed rabbits compared with control rabbits. All markers except hsCRP were reduced by atorvastatin.
Conclusions
These findings of increased macrophages, PCNA levels, and bone matrix proteins in the aortic valve during experimental hypercholesterolemia provide evidence of a proliferative atherosclerosis–like process in the aortic valve associated with the transformation to an osteoblast-like phenotype that is inhibited by atorvastatin. (Circulation. 2002; 105:2660-2665.)
Keywords: valves, cardiovascular diseases, lipids, atherosclerosis, physiology
Degenerative aortic valvular disease is a common medical condition. With the decline of acute rheumatic fever, calcific aortic stenosis has become the most common indication for surgical valve replacement. Despite the high prevalence of aortic stenosis, few studies have investigated the mechanisms responsible for aortic valve disease. Recent epidemiological analysis of the risk factors leading to aortic valve disease have identified causative factors similar to those of vascular atherosclerosis, such as smoking, male sex, hypertension, and elevated cholesterol levels.1 In histological analysis, Mohler et al2,3 have determined that mature lamellar bone formation and osteopontin bone expression are present in calcified human aortic valves. O'Brien et al4 have also identified the presence of apolipoproteins in calcified human aortic valves. However, the mechanism by which bone matrix production develops in the aortic valve remains unknown because of the lack of experimental models.
Vascular calcification is a well-known complication of late-stage vascular atherosclerotic lesions secondary to elevated cholesterol levels in patients with familial type II hyperlipidemia.5,6 Recently, Pohle et al7 correlated the effects of hyperlipidemia with progressive aortic valve and vascular calcification. The cellular mechanism by which vascular calcification develops, as reported in in vitro models and knockout mice,8,9 is the transformation of vascular fibroblast cells into osteoblast cells, which produce extraosseous calcification. This osteoblast transformation is the critical step in the development of vascular calcification and bone formation.
We have previously demonstrated in an experimental rabbit model that hypercholesterolemia produces a hyperlipidemic lesion in the aortic valve.10 In the current study, we investigated whether hypercholesterolemia causes an atherosclerotic proliferative valve lesion associated with the expression of an osteoblast-like phenotype. We also tested whether atorvastatin would inhibit this process in the aortic valve.
Methods
Animals and Valve Specimens
Male New Zealand White rabbits weighing 2.5 to 3.0 kg were assigned to a control (n=16) or 1.0% cholesterol-fed group (n=16) or to a cholesterol-fed plus atorvastatin group (n=16). All animals were fed ad libitum for 8 weeks. Control rabbits were fed a standard diet. Cholesterol-fed animals received a diet supplemented with 1.0% (wt/wt) cholesterol (Purina Mills), and the cholesterol-fed and atorvastatin group were given atorvastatin 3.0 mg/kg daily orally for the statin treatment arm.11 After this 8-week period, the rabbits were anesthetized with intramuscular ketamine/xylazine (40/5 mg/kg) and then underwent euthanasia with intracardiac administration of 1 mL of Beuthanasia (Schering-Plough, Union, NJ). All experiments were performed in an animal facility accredited by the Association for Assessment and Accreditation of Laboratory Animal Care, Inc. (ACUC-A3283–01, 1–08–382). Immediately after dissection from the heart, one leaflet from each aortic valve was fixed in 4% buffered formalin for 24 hours and then embedded in paraffin. Paraffinembedded sections (6 μm) were cut and stained with hematoxylin and eosin and Masson trichrome stain for histopathological examination.
Lipid Levels and Highly Sensitive C-Reactive Protein Measurements
Blood samples were centrifuged at 2000 rpm for 10 minutes at 4°C, and the serum was stored at −70°C. Total serum cholesterol levels were measured by standard enzymatic techniques. The highly sensitive C-reactive protein (hsCRP) levels in the serum were measured by an automated latex particle–enhanced immunoturbidometric method from Kamiya.
Immunohistochemistry
The immunostaining of the aortic valves, to identify macrophage cells, proliferating cell nuclear antigen (PCNA), and osteopontin, was performed for confirmation of foam cell formation, cellular proliferation, and bone matrix protein expression. PCNA (a DNA polymerase) is a marker for cellular proliferation (Dako).12 Macrophage immunostaining identifies the presence of foam cell formation (RAM 11, Dako).13 Osteopontin is a glycosylated phosphoprotein important in mineralization. The anti-osteopontin was obtained from the University of Iowa Hybridoma Bank.14 After fixation, slides were treated sequentially with 3.0% H2O2 for 15 minutes and normal rabbit serum for 20 minutes, washed with PBS (wt/wt) for 10 minutes, and incubated in 1:100 anti-PCNA, 1:50 RAM 11, and 1:50 osteopontin for 16 hours at 4°C. To develop color, slides were incubated in 3-amino-9-ethylcarbazole (Sigma Chemical Co) and washed with H2O for 5 minutes. The samples were scored semiquantitatively by two observers who were blinded to the treatment arms, and the results are expressed qualitatively and demonstrated in the photomicrographs. There is no systematic difference between readers in the grading of stains by paired t tests (P=0.33). The κ value for agreement between readers is 0.58, indicating moderate agreement. In only 1 of 18 stains did the 2 readers disagree by more than 1 grade.
Quantification of PCNA Staining
To provide a degree of quantification to our analysis, PCNA expression was determined by means of digital image analysis.14 This method uses a microscope attached to a computer for capture and quantification of histological images. The device works on the principle of Beer's law, which states that the concentration of a substance is directly proportional to its optical density. The PCNA nuclear antibody is visualized with the use of the bright-field chromogen diaminobenzidine (DAB). All DAB-positive nuclei are captured by one camera set for a specific wavelength of light. All nuclei, whether DAB-positive or DAB-negative, are visualized with a diluted hematoxylin solution and captured by a second camera, which is set for a different wavelength of light. The technologist captures the nuclei with a ×40 lens, and the instrument digitalizes the images into a series of picture elements or pixels for quantification. This method has been successfully used in our laboratory to quantify immunomarkers in a number of different pathological specimens.15
Immunogold Electron Microscopy
The valve leaflets were fixed in 4% formaldehyde plus 0.2% glutaraldehyde in phosphate buffer overnight, rinsed in phosphate buffer, partially dehydrated to 80% ethanol, and embedded in LR White resin. Thin sections (≈0.1 μm) were mounted on nickel grids and labeled with an antibody to osteopontin. The mouse monoclonal antibody was made against the N-terminal of osteopontin that included the amino acid sequences 3 to 13.16 Before labeling, the sections were treated with PBS with 0.05% Tween 20 (PBS-T), 1% (wt/vol) glycine and 2% (wt/vol) normal goat serum for 15 minutes. Sections were then incubated in undiluted primary antibody for 2 hours at room temperature. After rinsing extensively in PBS-T, the sections were incubated for 60 minutes in goat anti-mouse antibody conjugated to 10 nm gold diluted 1:50 in PBS-T. Grids were rinsed in PBS-T, rinsed in water, and dried. Sections were examined after staining with uranyl acetate and lead citrate.
Reverse Transcriptase–Polymerase Chain Reaction
Immediately after dissection from the heart, the two remaining leaflets from each aortic valve were frozen immediately for RNA extraction. Total RNA was isolated from the leaflets by pulverizing the tissue under liquid nitrogen and homogenizing it in a small volume of tissue lysis buffer (RNA Wiz, Ambion) followed by extraction with chloroform and precipitation with isopropanol. Aliquots of RNA (20 to 30 μg) were then treated with RNase-free DNase1 to remove contaminating genomic DNA, to prevent the possibility of false-positive signals in the polymerase chain reaction (PCR).
Reverse transcriptase–PCR (RT-PCR) analysis was performed for the expression of osteoblast marker genes, including alkaline phosphatase, osteopontin, and osteoblast-specific transcription factor (Cbfa-1), using the protocol described by Rickard et al.16,17 The primers for Cbfa-1 were synthesized as described by Komori et al.18
Statistics
Comparison was made among the 3 groups by means of ANOVA. The Scheffé method of adjustment was performed for multiple pairwise comparisons. All statistical tests were 2-tailed, and a value of P<0.05 was considered significant.
Results
Serum Cholesterol and hsCRP Levels
As shown in the Table and in Figure 1A, total serum cholesterol levels were significantly higher in the cholesterol-fed animals compared with control animals (3235±329 mg/dL versus 51±12 mg/dL, P<0.001). Atorvastatin-treated rabbits had lower cholesterol levels than the rabbits receiving the cholesterol diet alone (1943±17 mg/dL, P<0.001). There was an increase in hsCRP serum levels in the cholesterol-fed rabbits compared with control rabbits (0.16±0.13 versus 0.04±0.004, P<0.001), which was reduced by atorvastatin (0.09±0.05) but not significantly, as shown in the Table and in Figure 1B.
Plasma Cholesterol and hsCRP Levels, PCNA Quantification, and Osteoblast Markers in the Rabbit Treatment Groups.
| Group I Control | Group II High-Cholesterol Diet |
Group III High-Cholesterol Diet+Atorvastatin |
|
|---|---|---|---|
| Total cholesterol, mg/dL | 50.7±12.4 | 3235±328.8* | 1943±17.3† |
| PCNA quantification (% area) | 4.4±3.4 | 82.8±7.3* | 21.9±10.1† |
| hsCRP, mg/dL | 0.039±0.004 | 0.16±0.13* | 0.093±0.05 |
| Alkaline phosphatase (RT-PCR) (475 bp) | 1.8±3.12 | 3.6±1.3 | 0.21±0.37 |
| Osteopontin (RT-PCR) (347 bp) | 2.77±0.92 | 6.40±2.25* | 3.43±0.91† |
| Cbfa-1 (RT-PCR) (289 bp) | 1.62±0.36 | 3.90±1.28* | 2.30±0.71† |
P<0.001 compared with control,
P<0.001 compared with high-cholesterol diet.
Figure 1.
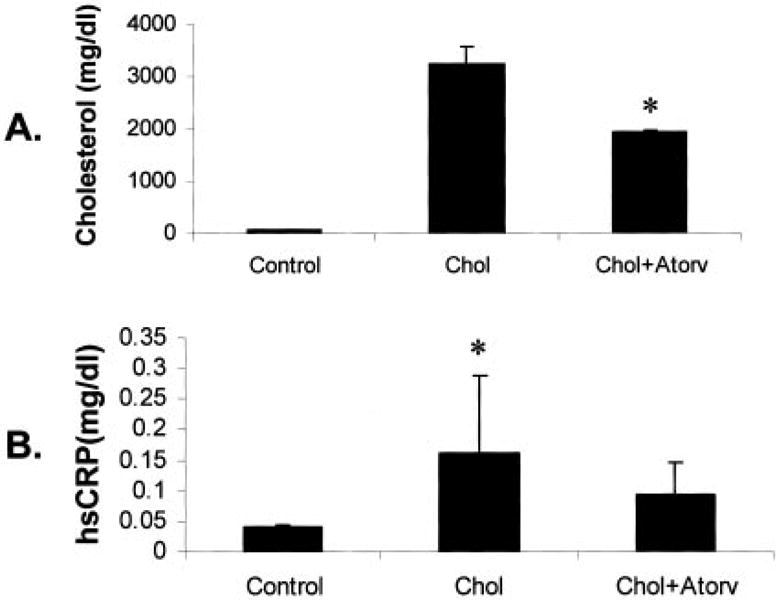
Serum cholesterol and hsCRP levels. A, Total serum cholesterol levels in each treatment group. B, Total hsCRP levels in serum of each treatment group. Chol indicates cholesterol-fed; Atorv, atorvastatin treatment. *P<0.001.
Light Microscopy and Immunostaining
The normal aortic valve surface from control animals appeared thin and intact, with a smooth endothelial cell layer covering the entire surface and a thin collagen layer in the spongiosa layer of the valve, as demonstrated by hematoxylin and eosin stain and Masson trichrome stain (Figure 2, A1 and B1). There were no macrophages or proliferation in the aortic valves of normal control rabbits (Figure 2, C1 and D1). In contrast, the aortic valves from the hypercholesterolemic animals had fatty plaque formation with scant accumulation of basophilic material. Foam cells converged to form a large lipid-laden lesion on the aortic endocardial surface of the valve leaflets (Figure 2, A2). There was also an increase in the blue collagen trichrome stain in the hypercholesterolemic aortic valves, as demonstrated in Figure 2, B2. The endothelial layer on the valve surface appeared disrupted by infiltration of extracellular lipid deposits, myofibroblast cells,19 and foam cells that stain positive for macrophages (RAM 11), as shown in Figure 2, C2. These lesions developed primarily at the base of the leaflets and decreased in extent toward the leaflet tips. The hypercholesterolemic aortic valves also demonstrated a marked increase in myofibroblast PCNA staining along the base of the aortic valve, as demonstrated in Figure 2, D2. The atorvastatin-treated rabbits had a marked decrease in the amount of atherosclerotic plaque burden, macrophage infiltration, and proliferation (Figure 2, A3, B3, C3, and D3), and these changes were most pronounced at the base of the leaflets.
Figure 2.
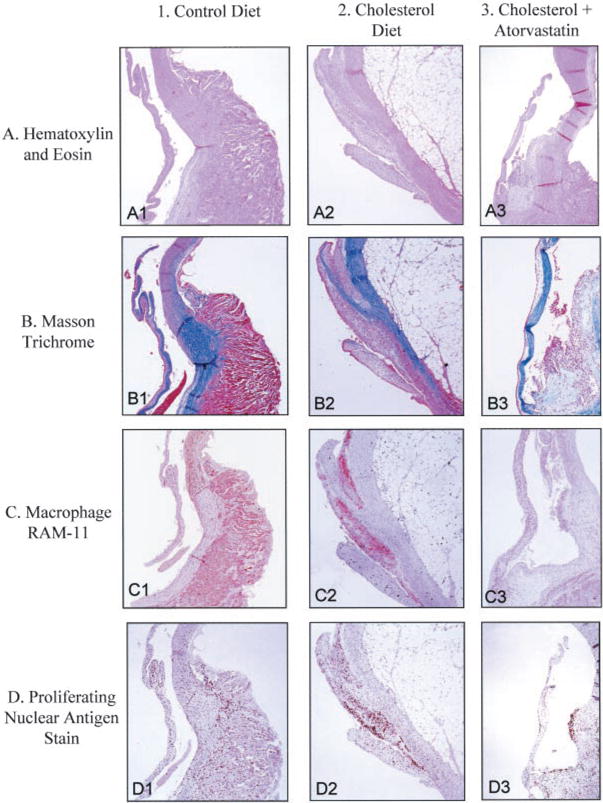
Light microscopy of rabbit aortic valves and aorta. Left column, control diet; middle column, cholesterol diet; right column, cholesterol diet plus atorvastatin. In each panel, aortic valve leaflet is positioned on the left, with aorta on the right. All frames ×12.5 magnification. A, Hematoxylin and eosin stain; B, Masson trichrome stain; C, macrophage, RAM 11; D, PCNA stain.
PCNA Analysis
PCNA-positive cells were detected in the endothelial layer of the aortic valve in the hypercholesterolemic animals, indicating a high level of cellular proliferation (Figure 2, D2). The total density of PCNA-positive cells in the aortic valve as quantified by digital image analysis was 82.8±7.3 cells/mm2 in hypercholesterolemic animals and 4.4±3.4 cells/mm2 in control animals (P<0.001). The total density of PCNA-positive cells in the atorvastatin-treated rabbits was reduced to 21.9±10.1 cells/mm2, which represents a significant decrease compared with the cholesterol-fed animals without atorvastatin (P<0.001). Quantification of the PCNA in the control, cholesterol, and the cholesterol-plus-atorvastatin diets after 8 weeks of treatment is shown in the Table and Figure 3.
Figure 3.
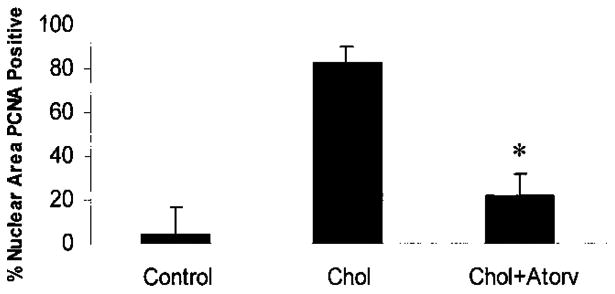
Quantification of PCNA in each treatment group. *P<0.001.
Osteopontin Expression by Immunostaining and Immunogold Electron
Immunostaining for osteopontin in the control aortic valves demonstrated a low level of osteopontin protein expression (Figure 4, A1). In the hypercholesterolemic aortic valves, there was an increase in osteopontin expression throughout the valve leaflet, as shown in Figure 4, A2, and this was decreased significantly by atorvastatin (Figure 4, A3). At the ultrastructural level, the protein expression changes were confirmed in the three treatment arms. In the control group, the osteopontin expression colocalized with the endoplasmic reticulum of the aortic valve (Figure 4, B1). In the hypercholesterolemic valves, there was a marked accumulation of lipids with a change in the pattern of osteopontin localization, as demonstrated in Figure 4, B2. The gold particles accumulated near the lipid infiltrates, with a prominent increase in the amount of gold label in these areas as well as the endoplasmic reticulum, as found in the control aortic valves. The atorvastatin-treated aortic valves had an appearance similar to the control aortic valves, with the osteopontin expression near the endoplasmic reticulum with very little evidence of lipid infiltration, as demonstrated in Figure 4, B3.
Figure 4.
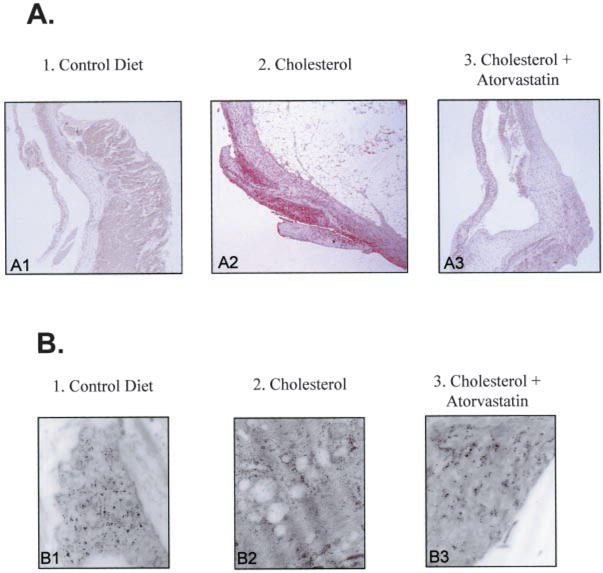
Evidence for osteopontin production in aortic valve. Left column, control diet; middle column, cholesterol diet; right column, cholesterol diet plus atorvastatin. A, Osteopontin immunostain light microscopy, aortic valve on the left and aorta on the right. All frames ×12.5 magnification. B, Osteopontin immunogold electron microscopy (magnification, 150 000).
Expression of Osteoblast Marker Genes in Aortic Valves
To demonstrate that hypercholesterolemia induces the expression of osteoblast-specific gene markers in the aortic valve, we performed RT-PCR from the total RNA isolated from the valve leaflets to measure the relative levels of alkaline phosphatase (475 bp), osteopontin (347 bp), and Cbfa-1 (289 bp). The control and high-cholesterol–treated animals expressed increased alkaline phosphatase RNA levels, whereas the atorvastatin-treated animals expressed very low levels of alkaline phosphatase (Figure 5A). Similarly, the hypercholesterolemic animals expressed increased levels of osteopontin and Cbfa-1 compared with the normal and atorvastatin-treated animals (Figure 5, B and C). The levels of alkaline phosphatase, osteopontin, and Cbfa-1 were normalized to GAPDH, and the relative levels are shown in the Table.
Figure 5.
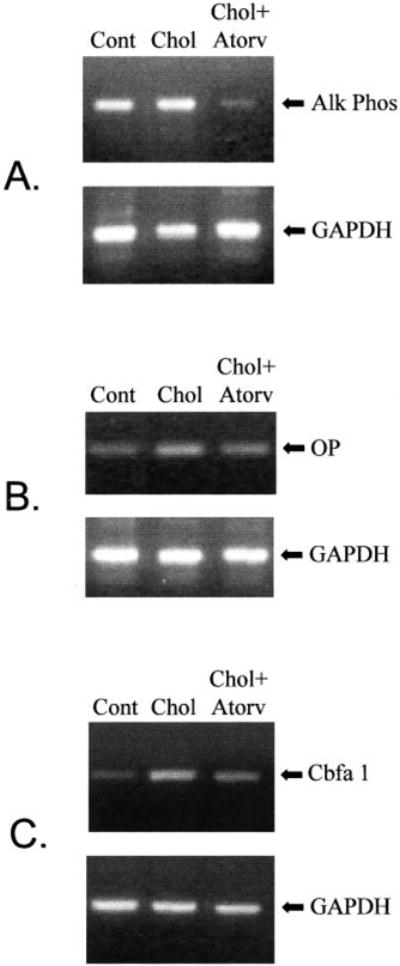
Semiquantitative RT-PCR. A, RT-PCR with the total RNA from aortic valves for alkaline phosphatase (AlkPhos) (475bp), results normalized to GAPDH (451 bp). B, RT-PCR with the total RNA from aortic valves for osteopontin (OP) (347bp), results normalized to GAPDH (451 bp). C, RT-PCR with the total RNA from the aortic valves for Cbfa-1 (289bp), results normalized to GAPDH (451 bp). Cont indicates control; Chol, cholesterol-fed; Atorv, atorvastatin treatment.
Discussion
Recent epidemiological studies have revealed that the risk factors for arterial atherosclerosis—male sex, smoking, and elevated serum cholesterol—are similar to the risk factors associated with development of aortic valve stenosis.1 Our data demonstrate that experimental hypercholesterolemia produces biochemical and morphological evidence of atherosclerotic changes in the aortic valve that are similar to the changes found in the early stages of vascular atherosclerotic lesion formation.20 Specifically, there is marked endothelial cell disruption, cellular proliferation, and foam cell formation on the aortic valve surface of animals fed a high-cholesterol diet The atherosclerotic lesion in this model develops primarily at the base of the leaflets and decreases toward the tip of the leaflets. This is similar to that described in the valve leaflets of patients with familial hypercholesterolemia.5 In this model, the hypercholesterolemic aortic valve not only developed an atherosclerotic lesion that is proliferative, but a lesion that expresses high levels of bone matrix proteins and osteoblast bone markers. The hsCRP levels are also increased in this model of experimental hypercholesterolemia, indicating an inflammatory state. This observation is consistent with the recent findings of Galante and coworkers,21 who demonstrated an increase in CRP levels in patients with aortic valve stenosis. Atorvastatin, which has been shown to reduce hsCRP in humans,22 decreased the hsCRP production in this model but not significantly.
The hypercholesterolemic rabbits in this study also expressed certain genes that are characteristic of later stages of osteoblast differentiation. Alkaline phosphatase is highly expressed on osteoblastic differentiation and is concentrated on the membranes of matrix vesicles, which appear to be required for the initiation of mineralization. Although alkaline phosphatase gene expression was similar in the control and hypercholesterolemic aortic valve tissue, there was an increase in gene expression of osteopontin and Cbfa-1 in the hypercholesterolemic valves. The similar alkaline phosphatase gene expression is not unexpected because alkaline phosphatase is not an absolute osteoblast specific protein, and some tissues normally express high levels of this enzyme. Furthermore, the levels of mRNA do not necessarily correlate with the protein (enzyme) levels. Osteopontin is an acidic phosphoprotein highly expressed in fully differentiated osteoblasts that may be involved in cell-matrix attachment and bone mineralization.23 Cbfa-1 is only one of two osteoblast-specific transcripts so far identified that are not expressed in fibroblasts,24 the other being osteocalcin. Cbfa-1 has all the attributes of a “master gene” differentiation factor for the osteoblast lineage. During embryonic development, Cbfa-1 expression precedes osteoblast differentiation and is restricted to mesenchymal cells destined to become osteoblasts.25 In addition to its critical role in osteoblast commitment and differentiation, Cbfa-1 appears to control the rate of bone formation by differentiated osteoblasts.26 Thus, our data indicate that there is a transformation of the aortic valve myofibroblasts to osteoblast-like cells or an invasion of osteoblast precursors, and this osteoblast phenotype may play a critical role in the subsequent process of valvular calcification.
There have been several studies linking the upregulation of osteopontin with alkaline phosphatase activity to generate free phosphate. The elevation in free phosphate may provide the mechanism by which osteopontin is involved in normal bone calcification and also extraosseous calcification.27 The increase in gene and protein expression for osteopontin in the hypercholesterolemic rabbit valves gives further evidence supporting the hypothesis that elevated cholesterol is responsible for early bone matrix gene expression in the aortic valve, similar to the processes responsible for vascular calcification.
In summary, these findings describe in an in vivo experimental model in which hypercholesterolemia induces both cellular proliferation and an osteoblast phenotype that may be a critical mechanism in progression of aortic valvular disease. Whether these early atherosclerotic changes and early bone matrix and protein expression result ultimately in mineralization and calcification will require chronic hypercholesterolemia studies. Our data also demonstrate that atorvastatin reduces the gene expression of osteoblast markers, including osteopontin, Cbfa-1, and the enzyme alkaline phosphatase. These changes coincide with a reduction in the extent of atherosclerotic changes in the aortic valve. Recent retrospective clinical studies demonstrate that treatment with HMG CoA reductase inhibitors in patients with calcific aortic stenosis may slow the rate of disease progression.28 These findings suggest that such therapy may have a potential role in patients in the early stages of this disease process to prolong the time to severe aortic stenosis and need for surgical aortic valve replacement.
Acknowledgments
This work was completed with the support of an American Heart Association Beginning Grant-in-Aid (0060372Z) and the Northwestern Medical Foundation grant RGF-02-03. The work was completed in the Feinberg Cardiovascular Institute at Northwestern University Medical School. The authors would like to thank Kay Rasmussen, Trisha Smith, Sameer Gupta, and Parag Jain for technical support.
Contributor Information
Nalini M. Rajamannan, Division of Cardiology, Department of Medicine, Northwestern University Medical School, Chicago, Ill.
Malayannan Subramaniam, Department of Biochemistry and Molecular Biology, Mayo Clinic, Rochester, Minn.
Margaret Springett, Department of Electron Microscopy, Mayo Clinic, Rochester, Minn.
Thomas C. Sebo, Department of Laboratory Medicine and Pathology, Mayo Clinic, Rochester, Minn.
Marek Niekrasz, Center for Comparative Medicine, Northwestern University Medical School, Chicago, Ill.
Joseph P. McConnell, Department of Laboratory Medicine and Pathology, Mayo Clinic, Rochester, Minn.
Ravinder J. Singh, Department of Laboratory Medicine and Pathology, Mayo Clinic, Rochester, Minn.
Neil J. Stone, Division of Cardiology, Department of Medicine, Northwestern University Medical School, Chicago, Ill.
Robert O. Bonow, Division of Cardiology, Department of Medicine, Northwestern University Medical School, Chicago, Ill.
Thomas C. Spelsberg, Department of Biochemistry and Molecular Biology, Mayo Clinic, Rochester, Minn.
References
- 1.Stewart BF, Siscovick D, Lind BK, et al. Clinical factors associated with calcific aortic valve disease: Cardiovascular Health Study. J Am Coll Cardiol. 1997;29:630–634. doi: 10.1016/s0735-1097(96)00563-3. [DOI] [PubMed] [Google Scholar]
- 2.Mohler ER, Gannon F, Reynolds, et al. Bone formation and inflammation in cardiac valves. Circulation. 2001;103:1522–1528. doi: 10.1161/01.cir.103.11.1522. [DOI] [PubMed] [Google Scholar]
- 3.Mohler ER, III, Adam LP, McClelland P, et al. Detection of osteopontin in calcified human aortic valves. Arterioscler Thromb. 1997;17:547–552. doi: 10.1161/01.atv.17.3.547. [DOI] [PubMed] [Google Scholar]
- 4.O'Brien KD, Reichenbach DD, Marcovina SM, et al. Apolipoproteins B, (a), and E accumulate in the morphologically early lesion of ‘degenerative’ valvular aortic stenosis. Arterioscler Thromb. 1996;16:523–532. doi: 10.1161/01.atv.16.4.523. [DOI] [PubMed] [Google Scholar]
- 5.Sprecher DL, Schaefer EJ, Kent KM, et al. Cardiovascular features of homozygous familial hypercholesterolemia: analysis of 16 patients. Am J Cardiol. 1984;54:20–30. doi: 10.1016/0002-9149(84)90298-4. [DOI] [PubMed] [Google Scholar]
- 6.Hoeg JM, Feuerstein IM, Tucker EE. Detection and quantification of calcific atherosclerosis by ultrafast computed tomography in children and young adults with homozygous familial hypercholesterolemia. Arterioscler Thromb. 1994;14:1066–1074. doi: 10.1161/01.atv.14.7.1066. [DOI] [PubMed] [Google Scholar]
- 7.Pohle K, Maffert R, Ropers D, et al. Progression of aortic valve calcification. Circulation. 2001;104:1927–1932. doi: 10.1161/hc4101.097527. [DOI] [PubMed] [Google Scholar]
- 8.Parhami F, Morrow AD, Balucan J, et al. Lipid oxidation products have opposite effects on calcifying vascular cell and bone cell differentiation: a possible explanation for the paradox of arterial calcification in osteoporotic patients. Arterioscler Thromb. 1997;17:680–687. doi: 10.1161/01.atv.17.4.680. [DOI] [PubMed] [Google Scholar]
- 9.Ducy P, Schink T, Karsenty G. The osteoblast: a sophisticated fibroblast under central surveillance. Science. 2000;289:1501–1504. doi: 10.1126/science.289.5484.1501. [DOI] [PubMed] [Google Scholar]
- 10.Rajamannan NM, Sangiorgi G, Springett M, et al. Experimental hypercholesterolemia induces apoptosis in the aortic valve. J Heart Valve Dis. 2001;1:371–374. [PubMed] [Google Scholar]
- 11.Bustos C, Hernandex-Presa MA, Ortego M, et al. HMG-CoA reductase inhibition by atorvastatin reduces neointimal inflammation in a rabbit model of atherosclerosis. J Am Coll Cardiol. 1998;32:2057–2064. doi: 10.1016/s0735-1097(98)00487-2. [DOI] [PubMed] [Google Scholar]
- 12.Stadius ML, Gown AM, Kernoff R, et al. Cell proliferation after balloon injury of iliac arteries in the cholesterol-fed New Zealand white rabbit. Arterioscler Thromb. 1994;14:727–733. doi: 10.1161/01.atv.14.5.727. [DOI] [PubMed] [Google Scholar]
- 13.Naito M, Nomura H, Esaki T, et al. Characteristics of macrophage-derived foam cells isolated from atherosclerotic lesions of rabbits. Atherosclerosis. 1997;135:241–247. doi: 10.1016/s0021-9150(97)00177-9. [DOI] [PubMed] [Google Scholar]
- 14.Sebo TJ. Digital image analysis. Mayo Clin Proc. 1995;70:81–82. doi: 10.1016/S0025-6196(11)64670-3. [DOI] [PubMed] [Google Scholar]
- 15.Sebo TJ, Cheville JC, Riehle DL, et al. Predicting prostate carcinoma volume and stage at radical prostatectomy by assessing needle biopsy specimens for percent surface area and cores positive for carcinoma, perineural invasion, Gleason score, DNA ploidy and proliferation, and preoperative serum prostate specific antigen: a report of 454 cases. Cancer. 2001;91:2196–2204. doi: 10.1002/1097-0142(20010601)91:11<2196::aid-cncr1249>3.0.co;2-#. [DOI] [PubMed] [Google Scholar]
- 16.Gorski JP, Griffen D, Dudley G, et al. Bone acific glycoportien-75 is a major synthetic product of osteoblastic cells and localized as 75- and/or 50-kDa forms in mineralized phases of bone and growth plate and in serum. J Biol Chem. 1990;26:14956–14963. [PubMed] [Google Scholar]
- 17.Rickard DJ, Kassem M, Hefferan T, et al. Isolation and characterization of osteoblast precursor cells from humans bone marrow. J Bone Miner Res. 1996;11:312–324. doi: 10.1002/jbmr.5650110305. [DOI] [PubMed] [Google Scholar]
- 18.Komori T, Yagi H, Nomura S, et al. Targeted disruption of Cbfa1 results in a complete lack of bone formation owing to maturational arrest of osteoblasts. Cell. 1997;89:755–784. doi: 10.1016/s0092-8674(00)80258-5. [DOI] [PubMed] [Google Scholar]
- 19.Mohler ER, III, Chawla MK, Chang AW, et al. Identification and characterization of calcifying valve cells from human and canine aortic valves. Heart Valve Dis. 1999;8:254–260. [PubMed] [Google Scholar]
- 20.Aliev G, Burnstock G. Watanabe rabbits with heritable hypercholesterolaemia: a model of atherosclerosis. Histol Histopathol. 1998;13:797–817. doi: 10.14670/HH-13.797. [DOI] [PubMed] [Google Scholar]
- 21.Galante A, Pietroiusti A, Vellini M, et al. C-Reactive protein is increase in patients with degenerative aortic valvular stenosis. J Am Coll Cardiol. 2001;34:1078–1081. doi: 10.1016/s0735-1097(01)01484-x. [DOI] [PubMed] [Google Scholar]
- 22.Jialal I, Stein D, Balis D, et al. Effect of hydroxymethyl glutaryl coenzyme a reductase inhibitor therapy on high sensitive C-reactive protein levels. Circulation. 2001;103(15):1933–1935. doi: 10.1161/01.cir.103.15.1933. [DOI] [PubMed] [Google Scholar]
- 23.Giachelli C, Bae N, Lombardi D, et al. Molecular cloning and characterization of 2B7, a rat mRNA which distinguishes smooth muscle cell phenotypes in vitro and is identical osteopontin (secreted phosphoprotein I, 2aR) Biochem Biophys Res Commun. 1991;177:867–873. doi: 10.1016/0006-291x(91)91870-i. [DOI] [PubMed] [Google Scholar]
- 24.Karsenty G, Ducy P, Starbuck M, et al. Cbfa1 as a regulator of osteoblast differentiation and function. Bone. 1999;25:107–108. doi: 10.1016/s8756-3282(99)00111-8. [DOI] [PubMed] [Google Scholar]
- 25.Ducy P, Desbois C, Boyce B, et al. Increased bone formation in osteocalcindeficient mice. Nature. 1996;382:448–452. doi: 10.1038/382448a0. [DOI] [PubMed] [Google Scholar]
- 26.Ducy P, Zhang R, Geoffroy V, et al. Osf2/Cbfa1: a transcriptional activator of osteoblast differentiation. Cell. 1997;89:747–754. doi: 10.1016/s0092-8674(00)80257-3. [DOI] [PubMed] [Google Scholar]
- 27.Beck GR, Zerler B, Moran E. Phosphate is specific signal for induction of osteopontin gene expression. Proc Natl Acad Sci U S A. 2000;97:8352–8357. doi: 10.1073/pnas.140021997. [DOI] [PMC free article] [PubMed] [Google Scholar]
- 28.Novaro GM, Tiong TY, Pearce GL, et al. Effect of hydroxymethylglutaryl coenzyme A reductase inhibitors on the progression of calcific aortic stenosis. Circulation. 2001;104:2205–2209. doi: 10.1161/hc4301.098249. [DOI] [PubMed] [Google Scholar]