

Abstract
Exome sequencing in families affected by rare genetic disorders has the potential to rapidly identify new disease genes (genes in which mutations cause disease), but the identification of a single causal mutation among thousands of variants remains a significant challenge. We developed a scoring algorithm to prioritize potential causal variants within a family according to segregation with the phenotype, population frequency, predicted effect, and gene expression in the tissue(s) of interest. To narrow the search space in families with multiple affected individuals, we also developed two complementary approaches to exome-based mapping of autosomal-dominant disorders. One approach identifies segments of maximum identity by descent among affected individuals; the other nominates regions on the basis of shared rare variants and the absence of homozygous differences between affected individuals. We showcase our methods by using exome sequence data from families affected by autosomal-dominant retinitis pigmentosa (adRP), a rare disorder characterized by night blindness and progressive vision loss. We performed exome capture and sequencing on 91 samples representing 24 families affected by probable adRP but lacking common disease-causing mutations. Eight of 24 families (33%) were revealed to harbor high-scoring, most likely pathogenic (by clinical assessment) mutations affecting known RP genes. Analysis of the remaining 17 families identified candidate variants in a number of interesting genes, some of which have withstood further segregation testing in extended pedigrees. To empower the search for Mendelian-disease genes in family-based sequencing studies, we implemented them in a cross-platform-compatible software package, MendelScan, which is freely available to the research community.
Introduction
High-throughput-sequencing (HTS) technologies hold incredible promise for uncovering the genetic basis of human disease, particularly for rare inherited conditions. Sequencing the exons of all known protein-coding genes—the exome—offers a powerful approach to rapidly screening for candidate disease-causing mutations in coding regions.1 Early applications of exome sequencing to rare Mendelian disorders demonstrated that it was possible to identify new disease genes (genes in which mutations cause disease) by sequencing the exomes of just a few unrelated individuals2–6 or family members.7–13 For many disorders, however, pinpointing the responsible mutation or associated gene by exome sequencing remains challenging. Each individual harbors thousands of coding variants, of which a significant fraction (∼5%–10%) are absent from public databases such as dbSNP14 or have no allele frequency data. The genomes of healthy individuals contain ∼100 loss-of-function variants,15 further complicating the identification of disease-causing mutations.
To date, exome sequencing studies of rare inherited disorders have generally used a winnowing strategy in which variants are progressively filtered for removal of those deemed unlikely to cause disease.1 Current statistical frameworks16,17 and analytic tools such as KGGSeq,18 VAAST,19 and VAR-MD20 filter and prioritize variants on the basis of segregation, predicted pathogenicity, dbSNP information, and genotype quality. Despite some successes, a strict filtering approach carries certain risks. Incomplete penetrance, genetic heterogeneity, and incorrect pedigree information21 can hamper segregation analysis. Rare and disease-causing variants are increasingly represented in dbSNP and other databases. Further, the complexity of the human transcriptome hampers accurate prediction of a sequence variant’s probable effect at the molecular level in the tissue(s) of interest.22
To aid the analysis of sequencing data from families affected by rare disorders, we developed a strategy for prioritizing genetic variants on the basis of segregation with disease, prevalence in human populations, predicted annotation, and the relative expression of the affected gene in the tissue(s) of interest. To further narrow the search for disease genes, we also developed two complementary approaches for identifying regions consistent with a disease-causing haplotype. We showcase our methods on exome data from families affected by retinitis pigmentosa (RP [MIM 268000]), a heterogeneous group of inherited retinal degenerations characterized by night blindness and progressive vision loss.23 Nearly 3,100 mutations in more than 50 different genes have been reported to cause nonsyndromic RP,24 but these genes account for only ∼60% of affected individuals, suggesting that many genes have yet to be discovered.25
In eight of our 24 families (29%), we found a pathogenic variant segregating with disease in a known RP gene. All eight causal mutations were among the top-scoring variants in those respective families, despite the fact that some proved to be X-linked (two families) or recessive (CNGB1 [MIM 600724]) forms of the disease. Several families had known linkage regions from traditional linkage analysis of extended pedigrees, and all of these regions were successfully recapitulated by our methods for mapping disease genes. Taken together, our methods provide a powerful analysis framework for exome sequencing of rare Mendelian disorders, and we make them freely available in the software package MendelScan.
Subjects and Methods
Subjects
A subset of 24 families was selected from a previously described cohort of 230 families affected by autosomal-dominant RP (adRP).26,27 The families were chosen on the basis of pedigree analysis, a lack of common RP-causing mutations, and the availability of DNA (Table 1). Within each family, individuals were chosen according to affectation status (two to seven affected individuals and zero to two controls per family), kinship coefficient, availability of DNA, and sample consent. Only unaffected parents of probands (noncarriers) were chosen as controls. In total, 91 individuals were selected for exome sequencing (Table S1, available online).
Table 1.
Families Selected for Exome Sequencing from a Cohort of Families Affected by adRP or Dominant-Acting X-Linked RP but Lacking Common Mutations
| Family ID | Ethnicity | Affected Individuals Sequenced | Unaffected Individuals Sequenced | Total Samples Sequenced |
|---|---|---|---|---|
| ADRP01 | white | 2 | 0 | 2 |
| ADRP02 | black | 5 | 0 | 5 |
| ADRP03 | white | 3 | 1 | 4 |
| ADRP04 | white | 2 | 0 | 2 |
| ADRP05 | white | 3 | 0 | 3 |
| ADRP06 | Hispanic | 3 | 0 | 3 |
| ADRP07 | white | 3 | 1 | 4 |
| ADRP08 | black | 7 | 1 | 8 |
| ADRP09 | white | 3 | 1 | 4 |
| ADRP10 | white | 2 | 0 | 2 |
| ADRP11 | white | 2 | 0 | 2 |
| ADRP12 | white | 3 | 0 | 3 |
| ADRP13 | white | 2 | 1 | 3 |
| ADRP14 | white | 3 | 0 | 3 |
| ADRP15 | white | 4 | 1 | 5 |
| ADRP16 | white | 5 | 2 | 7 |
| ADRP17 | Hispanic | 2 | 0 | 2 |
| ADRP18 | white | 2 | 1 | 3 |
| ADRP19 | Hispanic | 2 | 0 | 2 |
| ADRP20 | white | 6 | 0 | 6 |
| ADRP21 | white | 3 | 1 | 4 |
| ADRP22 | white | 3 | 1 | 4 |
| ADRP23 | white | 6 | 2 | 8 |
| ADRP24 | white | 2 | 0 | 2 |
Numbers reflect the samples that underwent exome sequencing. One family (ADRP12) received a provisional diagnosis of X-linked RP; the rest were provisionally diagnosed with adRP.
This research adhered to the tenets of the Declaration of Helsinki. Informed consent was obtained from each of the individuals tested. This study was approved by the Committee for the Protection of Human Subjects of the University of Texas Health Science Center at Houston and by the respective human subjects’ review boards at each of the participating institutions.
Sample Preparation
DNA was extracted from blood with the use of either the QIAamp DNA Blood Kit or the Gentra Puregene Blood Kit (QIAGEN). DNA was subjected to whole-genome amplification (WGA) by QIAGEN’s REPLI-g genome amplification service. Only WGA DNAs with assessment ratings indicating a >99% accuracy rate were used.
Illumina paired-end libraries were made from 1 μg of DNA according to the manufacturer’s protocol with slight modifications: (1) DNA was fragmented into sizes ranging from 100 to 500 bp with a Covaris S2 DNA Sonicator (Covaris), (2) Illumina adaptor-ligated DNA was amplified in a single 50 μl PCR reaction for five cycles, and (3) solid-phase reversible immobilization bead cleanup was used for purifying the PCR amplification and selecting fragments 300–500 bp in size.
Exome Capture
Sequencing libraries were hybridized with either a customized Agilent SureSelect All Exome Kit v.2.0 (Agilent Technologies) or the Nimblegen SeqCap EZ Human Exome Library v.2.0 (see Table S1) according to the manufacturers’ protocol. The KAPA SYBR FAST qPCR Kit (KAPA Biosystems) was used for library quantification. Libraries were quantified with PicoGreen prior to paired-end sequencing (2 × 100 bp) on Illumina GAIIx or HiSeq2000 instruments.
Sequence Alignment and Variant Calling
Illumina reads passing instrument quality control were aligned to the GRCh37-lite reference sequence with the Burrows-Wheeler Aligner28 v.0.5.9; parameters “–t 4 –q 5” were passed to the “bwa aln” command, and defaults were used for other commands. Duplicates were marked by Picard v.1.46. Single-nucleotide variants (SNVs) were called with VarScan v.2.2.9 (with parameters “--min-coverage 3 --min-var-freq 0.20 --p-value 0.10 --strand-filter 1 --map-quality 10”) and SAMtools v.0.1.16 and filtered for removal of false positives as previously described.29 Small indels were called by VarScan v.2.2.9 with the same parameters and false-positive filtering.
Variant Compilation and Annotation
For each family, cross-sample variant call format (VCF) files were generated for each variant type (SNVs and indels). Sites that failed the false-positive filter in >50% of samples in the family were removed as probable artifacts. Missing genotypes were backfilled via SAMtools consensus calling (samtools pileup –c). Variants were annotated with information from the dbSNP build 137 VCF file with the “vcf-annotate” command of the JoinX tool (v.1.6). Known dbSNP variants in the VCF were updated with a reference SNP ID in the ID column and global minor allele frequency (GMAF) and mutation status (in PubMed, OMIM, or locus-specific databases [LSDBs]) in the INFO column.
Variants were also annotated with gene-structure information with the use of internal software (and Ensembl release 70) and the Variant Effect Predictor (VEP) v.2.2 with parameters “--condel b --polyphen b --sift b --hgnc --canonical.” For each gene, the canonical VEP annotation was used whenever possible. In the event of multiple overlapping genes that yielded different annotations, the most damaging annotation was used. In coding regions, the priority order (from most damaging to least damaging) was the following: frameshift, nonsense, essential splice site, missense, nonstop, synonymous coding. Missense variants were considered damaging if called as such by at least one of PolyPhen (“probably_damaging” or “possibly_damaging”), SIFT (“deleterious”), or Condel (“deleterious”).
Segregation-Score Parameter Analysis
To help choose appropriate default values for the segregation score, we obtained the genotypes for a mother-father-child trio from the VCF file for family ADRP22. Only biallelic SNVs with a read depth of at least 20 in all three samples were considered. There were 6,539 positions at which parents were homozygously different (i.e., one parent was wild-type and the other was homozygous for variants) and thus the child should have been heterozygous. Of these, the child was called wild-type at 159 positions and homozygous for variants at 91 positions. Thus, we estimated the false-negative rate to be 159/6,539 (2.43%) and the miscall rate to be 250/6,539 (3.8%). Of the 37,021 positions at which the child was called heterozygous, 340 were called wild-type in both parents. Thus, we estimated the false-positive rate to be 340/37,021 (0.92%).
To be conservative, we chose scoring parameters reflecting 80% sensitivity to detect heterozygotes (observed sensitivity was 97.57%). A variant appearing to be wild-type in an affected individual thus received a segregation score of 0.20. Similarly, we scored a variant that was heterozygous in a control with the conservative false-positive rate of 5% (segregation score 0.05). Although the miscall rate (heterozygotes mistaken for homozygotes) was only 3.8%, it is possible that even rare variants could have been present in two copies in an affected individual (either by chance or from a distantly consanguineous union). Thus, we allowed ∼20% of apparent homozygous variants in affected individuals to be either real or a miscalled heterozygote (segregation score 0.20).
MendelScan Software Implementation
Variant prioritization, shared identity-by-descent (IBD) mapping, and rare-heterozygote-rule-out (RHRO) mapping were implemented in the Java software package MendelScan. Required inputs for MendelScan include (1) a VCF file comprising variant calls for all sequenced samples from a family, (2) a pedigree file indicating the gender and affectation status of each sample, and (3) annotation information in VEP format for the variants in the VCF file. The shared-IBD (SIBD) analysis also requires BEAGLE FastIBD (FIBD) files for all affected pairs within a family.
Ingenuity Variant Analysis
The eight families affected by known pathogenic mutations were also analyzed with Ingenuity Variant Analysis (IVA) software. SNVs were uploaded in VCF format via the web-based interface. One analysis (of type “genetic analysis” with inheritance model “autosomal dominant” and phenotype “retinitis pigmentosa [disease]”) was created for each family. Affected or unaffected status for each sample was specified. Because pedigree information was not available for most of these families, it was not provided to IVA. Otherwise, the default settings were used. For two families affected by CHM (MIM 300390) mutations, we repeated the analysis after adding “choroid degeneration [disease]” as a phenotype and selected the “included phenotypes consistent with this disease” option.
IBD Analysis
To identify regions of maximum pairwise IBD between affected individuals in a family, we converted family VCF files to the BEAGLE unphased genotype file format. Genetic-map positions were interpolated from the International HapMap Project Phase II genetic map (liftOver to build 37, dated August 12, 2010). IBD regions were determined between all possible affected pairs in a family with the use of BEAGLE v.3.3.12 with “fastibd = true.” The resulting files (∗.fibd) were mapped back to genomic coordinates. Next, the genome was segmented into nonoverlapping windows of 100 kb. For each window, the total number of unique affected pairs with a segment in common (IBD score < 10 × 10−10) was computed with FIBD output.
RHRO Analysis
The RHRO methodology relies on the assumption that all affected individuals within a family inherited the same causal mutation from a common ancestor. To identify regions consistent with autosomal-dominant disease inheritance, we scanned family VCFs for (1) presumably rare variants (absent from dbSNP 137) that were heterozygous in affected individuals and (2) homozygous differences between affected individuals in a family. Common variants (present in dbSNP 137) with homozygous differences between affected individuals were included. Only variants called in at least 50% of sequenced samples in a family were used for this analysis. A sliding-window approach identified candidate RHRO regions in which one or more rare heterozygous variants were shared by 100% of affected individuals called. A window began at the first such shared rare variant and extended until a homozygous difference, the centromere, or the end of the chromosome was reached.
Results
We set out to develop a scoring system to prioritize candidate variants in family-based sequencing studies of Mendelian disease. Our strategy relies on the expectation that disease-causing mutations in such studies will be penetrant, meaning that they segregate with the phenotype as expected for the model of inheritance. Evolutionary theory further suggests that variants responsible for inherited disease should be selected against; thus, we expect them to be rare among human populations. Although we admit that regulatory variants in noncoding sequences might contribute to disease, we expect that the vast majority of disease-causing mutations alter the sequence of proteins by disrupting coding sequences, splicing, or translation. In particular, the disease-causing mutations detected by exome sequencing seem likely to occur in the coding sequences targeted by this strategy. Finally, we anticipate that the genes associated with Mendelian diseases are normally expressed in the tissue(s) of interest, an expectation supported for retinal-disease genes in recent transcriptome studies of murine30 and human31 retina samples.
Evaluation of Disease-Causing Mutations
To evaluate these expectations, we examined mutation and gene expression data sets for genes already implicated in adRP. We downloaded mutations for the 23 known genes associated with adRP or dominant-acting X-linked RP in the Human Gene Mutation Database (HGMD, accessed June 17, 2013) and found 762 mutations (632 SNVs and 130 indels) reported to cause adRP or dominant-acting X-linked RP. Consistent with our expectations, these mutations were extremely rare; 523 (68.3%) were novel to dbSNP 137, and another 160 (21.0%) were only reported by mutation databases (Figure 1A). When classified by current VEP annotation, most of the mutations were predicted to alter protein sequence (66%), reading frame (13.5%), splicing (4.3%), or length (6.8%); only 46 (6%) were annotated as synonymous or noncoding mutations (Figure 1B). Among 454 nonsynonymous SNVs assessed by PolyPhen, SIFT, and Condel, there were 417 (92%) predicted to be damaging by at least one algorithm and 341 (75%) predicted to be damaging by all three (Figure 1C).
Figure 1.

Summary of 762 Mutations Reported to Cause adRP or Dominant-Acting X-Linked RP
(A) Status according to dbSNP 137. dbSNP variants with GMAF values were classified as common (GMAF > 5%), uncommon (GMAF 1%–5%), or rare (GMAF < 1%). Otherwise, they were classified either as a mutation if they were present in OMIM or a LSDB or as simply known to dbSNP but lacking frequency information (“known”).
(B) Annotation class of causal mutations. The most damaging VEP classification for the canonical transcript was used. The “splice region” category includes annotations for essential splice sites, splice sites, and splice regions.
(C) Predicted impact of nonsynonymous mutations by PolyPhen, SIFT, and Condel. VEP results for 454 nonsynonymous SNVs were categorized by the number of algorithms that deemed the variant to be deleterious.
(D) Gene expression scores were computed as the relative rank (percentile, see Subjects and Methods) of genes by maximum (y axis) or mean (x axis) expression values from the Farkas et al.31 human retina RNA-seq data set. Genes in which mutations are reported to cause retinal disease (RetNet) are colored in blue; the subset (n = 23) of these reported to cause adRP are colored in red.
Next, we downloaded human retinal expression data generated by transcriptome sequencing (RNA-seq) of three normal postmortem retina samples. We computed both the maximum and the mean retinal expression in reads per kilobase per million (RPKM, see Subjects and Methods) for every gene in our database (Figure 1D). Consistent with previous studies, most genes associated with retinal disease in humans (RetNet) were highly expressed in the retina; of the 207 RetNet genes with expression data, 151 (73%) were in the top quadrant of retinally expressed genes and 200 (96.6%) were in the top half. The subset of genes associated with adRP or dominant-acting X-linked RP (n = 23) followed this trend as well; all were in the top half of retinally expressed genes, and 19 (83%) were in the top quadrant. Because many genes have retina-specific transcripts, we used the maximum RPKM value to rank genes for all subsequent analyses. RHO (MIM 180380), which encodes the rhodopsin pigment and in which mutations account for 30%–40% of individuals with adRP, was the fifth-highest retinally expressed gene by this measure.
Scoring System for Candidate Variants
Our analysis of known mutations in adRP or dominant-acting X-linked RP demonstrated that the vast majority of causal mutations are extremely rare protein-altering variants in genes with high retinal expression. We therefore implemented a scoring system for variants obtained by family-based exome sequencing of Mendelian disorders; in this system, each variant receives four individual scores (each between 0 and 1) on the basis of segregation with the phenotype, prevalence in human populations, annotation, and expression in tissue(s) of interest:
-
1.
The segregation score is based upon segregation with disease in the family and accounts for the possibility of sequencing or genotyping error. For rare autosomal-dominant disease, we expect all affected individuals in a family to be heterozygous for the causal mutation, which should be absent from the unaffected controls. Under this dominant model for rare disease, a pathogenic mutation’s deviation from the expected segregation must be artifactual. We selected initial values for scoring on the basis of a conservative view of next-generation-sequencing accuracy: 80% sensitivity, 5% false-positive rate, and 20% miscall rate (heterozygous variants called homozygous). Thus, we assigned a score of 0.80 to a variant if it was homozygous in an affected individual (1 − miscall rate), 0.20 if it was absent from an affected individual (1 − sensitivity), or 0.05 if it was present in a control (false-positive rate) (Table S2). These values are completely configurable by the user; our default settings derive from an analysis of a family trio (see “Segregation-Score Parameter Analysis” in the Subjects and Methods). We also allow the user to specify a sequencing-depth threshold (default is 20) below which variants are treated as missing data. Affected individuals who are called wild-type despite some evidence of a variant (default is 5% of reads) are also treated as missing data.
-
2.
The population score indicates the variant’s rareness among population cohorts, such as the 1000 Genomes panels. Information fields for GMAF from the 1000 Genomes Project, citations in PubMed, and status in OMIM or LSDBs are used for determining a variant’s population-frequency status as either common (GMAF > 5%), uncommon (GMAF = 1%–5%), rare (GMAF < 1%), known (no GMAF available), mutation (in PubMed, OMIM, or LSDBs), or novel to dbSNP. Because adRP or dominant-acting X-linked RP is rare in human populations, in our analysis we assigned very low population scores to dbSNP variants with GMAF data (0.001 for common variants, 0.02 for uncommon variants, and 0.20 for rare variants), high scores for variants that were novel (1.00) or listed as “mutation” (0.95) in dbSNP, and moderate scores for other dbSNP variants (0.60) (see Table S2). These values can and should be adjusted for studies with different disease prevalence or modes of inheritance.
-
3.
The annotation score reflects the predicted functional impact of the variant on the encoded gene. Each variant is assigned an annotation score on the basis of the most damaging canonical VEP annotation. Given the observation that most known disease-causing mutations in adRP or dominant-acting X-linked RP alter protein structure, we assigned the highest annotation scores to truncating (1.00) and essential splice-site (1.00) variants. Missense variants were scored as 0.95 if found to be damaging by PolyPhen, SIFT, or Condel or 0.80 if predicted to be benign. Lower scores were given to variants in the intronic splice region (0.20), synonymous coding variants (0.05), and noncoding variants (0.01).
-
4.
The gene expression score is based upon the relative expression of the gene in tissue(s) of interest for the disease. The gene expression values are provided to MendelScan as a text file containing HUGO gene symbols ordered from highest relevance (expression) to lowest. Variants in genes that are not included in the expression file receive essentially a neutral score (0.50), whereas highly expressed genes receive a score closer to 1 and genes with relatively low expression receive a score closer to 0. Retinal expression is of keen interest for RP, so we obtained human retinal expression values for genes by using a public data set of RNA-seq from three normal retinal samples. The gene expression score was computed as the rank percentile of each gene (1 − rank/total). For example, the gene encoding rhodopsin (RHO) was ranked fifth overall for retinal expression, so its gene expression score was 0.99987.
The score assignments are completely configurable by MendelScan users; for demonstration purposes, we selected values appropriate for adRP, and these are outlined in Table S2. An overall score, computed from the product of the four individual scores, makes it possible to sort variants according to their segregation with the phenotype, rareness in populations, predicted functional impact, and expression in the tissue(s) of interest.
Application of Methods to Sequencing Data from adRP-Affected Families
We performed exome sequencing on 91 individuals from 24 families affected by adRP or dominant-acting X-linked RP (Table 1). Illumina sequencing libraries underwent exome capture with either Agilent or Nimblegen kits and were sequenced on GAIIx or HiSeq2000 instruments (see Subjects and Methods and Table S1). We generated ∼14.4 Gb of sequence per individual; 98% of targeted bases were covered by at least one read, and ∼89% were covered by at least 20 reads. On average, our variant-calling pipeline identified ∼30,000 SNVs per individual in targeted coding sequences (∼34 Mb), and >98% of these were present in dbSNP build 137 (Figure 2A). As expected, more SNVs were called relative to the reference sequence in families of African ancestry than in families of European ancestry. Similar patterns were observed for small indels: ∼600 variants were called per family in coding-sequence regions, and ∼81% of these were present in dbSNP 137 (Figure 2B). The number of variants novel to dbSNP ranged from ∼400 in white families with just two sequenced members to more than 2,500 in an eight-member family of African American descent.
Figure 2.
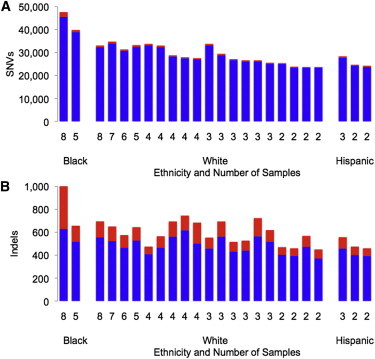
Variants Called per Family in CDS Regions by Ethnicity and Number of Exomes Sequenced
The total number of variants known (blue) or novel (red) to dbSNP 137 is shown for each of the 24 families chosen for exome sequencing.
(A) SNVs: ∼29,784 per family and 98% known to dbSNP.
(B) Indels: ∼605 per family and 81% known to dbSNP.
Eight of 24 families harbored rare mutations in known RP genes (Table 2). Notably, two of these were nonsense mutations in the X-linked gene CHM, consistent with our previous observation that X-linked genes account for a significant fraction of families with a provisional diagnosis of adRP.21 Another family with presumed X-linked inheritance was actually affected by recessive disease; the pathogenic mutation in CNGB1 (MIM 600724) still ranked in the top 2% of candidate SNVs (when sorted by overall score) and highlighted an error in the pedigree. For the remaining seven families, the causal mutation consistently appeared among top-scoring variants (on average, it ranked fifth).
Table 2.
Families Harboring Most Likely Pathogenic Mutations in Known adRP Genes
| Family ID | Presumed Inheritance | Exomes (No. Affected) | Gene (MIM Number) | Rank (Total SNVs) | Actual Inheritance |
|---|---|---|---|---|---|
| ADRP04 | dominant | 2 (2) | SNRNP200 (601664) | 1 (25,418) | dominant |
| ADRP06 | dominant | 3 (3) | CHM (300390) | 13 (28,395) | X-linked |
| ADRP09 | dominant | 4 (3) | CHM (300390) | 4 (33,785) | X-linked |
| ADRP11 | dominant | 2 (2) | PROM1 (604365) | 2 (23,729) | dominant |
| ADRP12 | X-linked | 3 (3) | CNGB1 (600724) | 439 (26,666) | recessive |
| ADRP18 | dominant | 3 (2) | NRL (162080) | 2 (25,604) | dominant |
| ADRP21 | dominant | 4 (3) | SNRNP200 (601664) | 1 (33,072) | dominant |
| ADRP22 | dominant | 4 (3) | RPE65 (180069) | 12 (27,573) | dominant |
The number of samples (and number affected) is shown. Rank by overall score and presumed versus actual mode of inheritance are shown.
To compare our results with those of a popular filter-based tool, we analyzed these eight families with the web-based IVA. For each family, we uploaded the VCF file for SNVs and specified a genetic analysis for “retinitis pigmentosa [disease]” with autosomal-dominant inheritance. IVA progressively filters variants on the basis of confidence of the variant calls, prevalence in human populations, predicted deleteriousness, and biological context by using a proprietary database. Using the default settings, IVA produced a final list of ∼25 variants affecting six to seven genes in each family (Table S3). In four families (50%), the final set included the causal mutation. In two families (25%), the causal mutation was removed at the last step (biological context) unless related phenotypes (choroid degeneration) were provided. In two families (25%), the causal mutation was deemed neutral by SIFT and thus removed by the “deleterious” filter (Table S4). Taken together, these results suggest that filtering methods are effective for first-pass analysis of Mendelian-disease studies but that a prioritization strategy such as ours might be more robust to errors in the presumed mode of inheritance or in silico prediction of variant pathogenicity.
Exome-Based Mapping for Autosomal-Dominant Disorders
To further refine the search for disease-causing mutations, we also developed two methods for exome-based disease-gene mapping in families with autosomal-dominant disease inheritance. Both methods aim to identify genomic regions that are shared by affected family members and that might harbor the disease-causing allele, and they thus require family cohorts with at least two affected individuals. For the first method, called RHRO, we reasoned that a rare causative mutation probably segregates on the same haplotype as do other rare variants that are nearby but do not cause disease. In other words, if all affected members of a family inherit the causal mutation from a common ancestor, that mutation lies on a haplotype that might contain other variants that also segregate with disease. We also reasoned that homozygous differences between two affected individuals indicate positions where the samples have no haplotype in common. Thus, the genomic region harboring the disease-causing mutation should contain rare heterozygous variants shared by all affected individuals but should not contain variants with homozygous differences between affected individuals (Figure 3).
Figure 3.
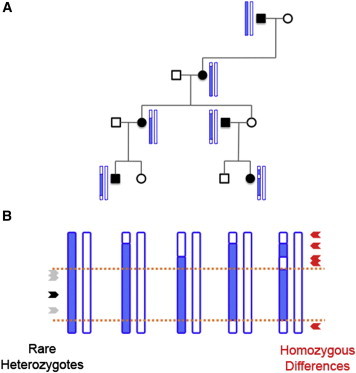
Exome-Based Mapping of Genes Associated with Dominant Disease
(A) Visual depiction of how a disease-causing haplotype (blue) might segregate with disease status while undergoing recombination with non-disease-causing haplotypes (white) in a fictitious dominant pedigree.
(B) Illustration, using haplotypes from the pedigree in (A), of the methods for disease-gene mapping. Rare variants (gray) segregating on the same haplotype as the disease-causing mutation (black) will be heterozygous in all affected individuals. In contrast, homozygous differences between affected pairs (red) indicate regions where neither haplotype is shared. Orange lines mark the boundaries of the disease-causing haplotype inherited by all affected individuals from a common ancestor.
For the second method, called SIBD, we attempt to identify regions inherited by all affected individuals in a family from a common ancestor. First, we compute the pairwise IBD between every possible affected pairing in a family by using the FIBD algorithm in BEAGLE. Next, we divide the genome into segments of a fixed size (100 kb) and compute the number of affected pairings that are identical by descent within that segment. To allow for some incomplete IBD estimation, we consider windows in which ≥80% of possible affected pairings show IBD to be SIBD candidate regions.
We applied both exome-based disease-gene mapping methods to the 15 families in which at least three affected individuals were sequenced. Three such families already had candidate linkage regions (Table 3) from traditional SNP or short-tandem-repeat genotyping in the extended pedigrees (S.H.B., data not shown), allowing a direct comparison of our methods to the results of traditional approaches. The results for family ADRP16 (five affected individuals) are shown in Figure 4. Our mapping approaches supported four striking candidate regions, two of which overlapped the known linkage regions on chromosomes 15 and 19 (Figure S1). A number of smaller regions on other chromosomes were supported by only one of our methods, suggesting that taking the intersection of RHRO and SIBD results yields more robust mapping by incorporating information from rare and common variants. In family ADRP23 (six affected individuals), our results were consistent with linkage data for three chromosomes (2, 4, and 18) while nominating regions on four others. In our most informative family, ADRP08 (seven affected individuals), both traditional linkage analysis and our exome-based analysis implicated an almost identical region on a single chromosome (19).
Table 3.
RHRO and SIBD Results Compared to Results of Traditional Linkage Analysis in Three Families
| Family ID | Known Linkage | RHRO and SIBD |
|---|---|---|
| ADRP08 | chr19: 44–52 Mb | chr19: 45–52 Mb |
| ADRP16 | – | chr12: 6–20 Mb |
| chr15: 60–69 Mb | chr15: 61–95 Mb | |
| chr19: 36–56 Mb | chr19: 41–55 Mb | |
| – | chr22: 19–30 Mb | |
| ADRP23 | – | chr1: 17–18 Mb |
| chr2: 105–173 Mb | chr2: 99–173 Mb | |
| chr4: 111–159 Mb | chr4: 107–160 Mb | |
| – | chr5: 151–171 Mb | |
| – | chr16: 31–47 Mb | |
| chr18: 62–67 Mb | chr18: 57–68 Mb | |
| – | chr20: 56–61 Mb |
Figure 4.
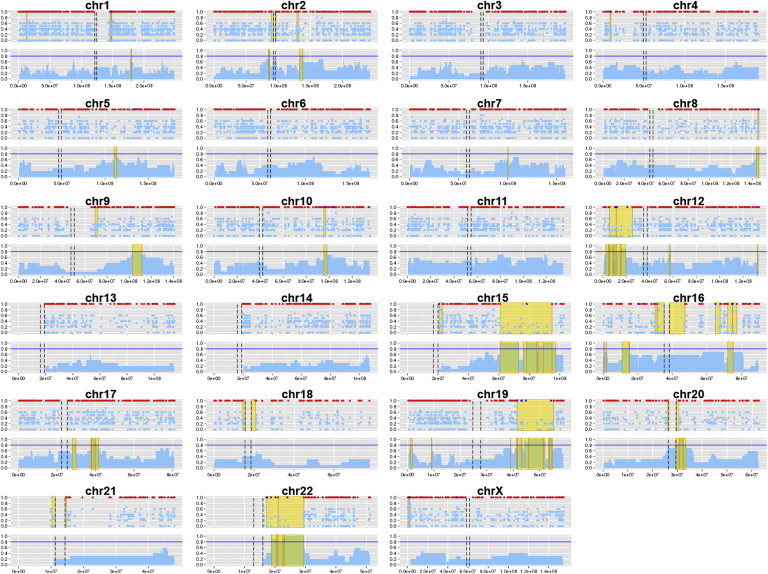
Exome-Based Gene Mapping in Family ADRP16
For each chromosome, the RHRO results are on top and the SIBD results are on bottom. For the RHRO approach, the proportion of heterozygous affected individuals is plotted by rare-variant position along each chromosome in light blue. Variants not found in the unaffected control are highlighted in royal blue. Positions of homozygous difference between affected pairs (rule outs) are shown in red. Candidate regions (yellow) are flanked by rule-out positions or the centromere (black dashed lines). For the SIBD approach, the proportion of affected pairs sharing an IBD segment is plotted in 50 kb windows, and segments shared by ≥80% of affected pairs (horizontal blue line) are highlighted in gold.
As expected, our methods were most powerful for families in which many affected individuals from the extended pedigree were sequenced. In families with four or more affected individuals, our methods refined the search space to 5% or less of the targeted coding sequence (Table 4). For families with three affected individuals, the intersection of RHRO and SIBD candidate regions overlapped roughly half of the ∼33 Mb targeted coding sequence. On average, per family, we observed ∼810 SNVs that fit an autosomal-dominant model of inheritance and were rare in human populations (Table S5); of these, 634 (78.3%) were supported by at least one mapping method and 384 (47.4%) were supported by both methods. In two such families, exome sequencing uncovered a pathogenic mutation in known RP genes: SNRNP200 (MIM 601664) in family ADRP2132 and RPE65 (MIM 180069) in family ADRP22.33 In both cases, our disease-gene mapping methods nominated candidate regions overlapping the location of the causal mutation (Figure S2).
Table 4.
RHRO and SIBD Results for Families with at Least Three Affected Individuals
| Family ID | Ethnicity | Exomes (No. Affected) | Regions | No. of Chromosomes | Refined CDS (Mb) | Refined CDS (%) |
|---|---|---|---|---|---|---|
| ADRP05 | white | 3 (3) | 74 | 21 | 16.05 | 48.43% |
| ADRP07 | white | 4 (3) | 60 | 22 | 15.25 | 46.03% |
| ADRP03 | white | 4 (3) | 66 | 22 | 14.65 | 44.21% |
| ADRP09 | white | 4 (3) | 62 | 23 | 14.19 | 42.81% |
| ADRP12 | white | 3 (3) | 88 | 22 | 12.85 | 38.79% |
| ADRP06 | Hispanic | 3 (3) | 51 | 20 | 6.90 | 20.81% |
| ADRP22 | white | 4 (3) | 34 | 13 | 3.47 | 10.48% |
| ADRP21 | white | 4 (3) | 31 | 16 | 1.80 | 5.44% |
| ADRP14 | white | 3 (3) | 61 | 21 | 1.18 | 3.57% |
| ADRP15 | white | 5 (4) | 28 | 14 | 1.34 | 4.05% |
| ADRP02 | black | 5 (5) | 9 | 5 | 1.74 | 5.25% |
| ADRP16 | white | 7 (5) | 14 | 4 | 1.15 | 3.46% |
| ADRP23 | white | 8 (6) | 7 | 4 | 1.02 | 3.07% |
| ADRP20 | white | 6 (6) | 6 | 5 | 0.42 | 1.26% |
| ADRP08 | black | 8 (7) | 2 | 1 | 0.21 | 0.63% |
Candidate regions and chromosomes from intersecting RHRO and SIBD regions are shown along with the absolute and proportional size of the refined search space. The following abbreviation is used: CDS, coding sequence.
The MendelScan Software Package
We implemented our analysis methods in a standalone software package (MendelScan) that is freely available to the research community. Although the default scoring thresholds reflect our experience with rare, autosomal-dominant disorders, we designed MendelScan to be highly configurable so that it can be used for studying other types of inherited disease. Source code, executables, and documentation for the software package are available on the MendelScan web site.
Discussion
We have described variant prioritization and disease-gene mapping strategies that empower the search for Mendelian-disease genes in family-based sequencing studies. Motivated by population-genetics theory and empirical observations of rare disease-causing mutations in adRP, we devised a strategy to prioritize candidate sequence variants on the basis of their segregation patterns within a family, prevalence in surveyed human populations, and predicted functional impact, along with the relative expression of the affected gene in tissue(s) of interest. Further, we reasoned that causal mutations inherited from a common ancestor in dominant pedigrees would give rise to certain patterns—regions of IBD, clusters of shared rare variants, and an absence of homozygous differences among affected individuals—that can be detected with exome data and exploited for disease-gene mapping.
We have showcased our methods by using exome data from 24 families with a provisional diagnosis of adRP (n = 23) or X-linked RP (n = 1) but without common disease-causing mutations. Per family, our variant detection and annotation pipelines identified ∼400–2,500 rare sequence variants that might be candidate causal mutations, demonstrating the need for rational prioritization strategies in exome studies of rare disease. Popular filtering strategies, such as those employed by IVA, efficiently reduce the list of candidate variants to a small number but are vulnerable to inaccurate pedigree information and errors in in silico predictions of variant pathogenicity. In our study, eight families harbored likely causal mutations in known RP genes, and all of them were ranked in the top 2% of variants by our prioritization strategy. Notably, this included two families affected by X-linked RP and another affected by recessive RP, suggesting that our methodology might be suitable for inheritance patterns other than autosomal dominance as well.
Our disease-gene mapping strategies reduced the search space for causal mutations by ∼50% in families with three affected individuals and by ∼95% in families with four or more affected individuals. Importantly, both of our approaches rely on the assumption that affected individuals within a family all inherited the same causal mutation from a common ancestor. They would thus not be suited to analyses of unrelated individuals affected by rare syndromes. Our methods require at least two affected individuals in a family, and their power is understandably related to the number of, and meiotic distance between, affected individuals included in the analysis. In the most informative family described here (ADRP08; seven affected individuals), our methods excluded >99% of the exome and implicated regions on a single chromosome that were consistent with traditional linkage analysis for the extended pedigree.
Importantly, RHRO and SIBD analyses occasionally yield conflicting results (e.g., chromosome 16 in Figure 4) because of their underlying algorithms and type of variants used. SIBD analysis requires common variants whose genetic-map position can be inferred. As such, it might miss candidate regions (especially smaller ones) when such markers are not available. In contrast, because RHRO analysis prioritizes rare heterozygous variants, it offers a slight advantage to sensitivity but might also nominate candidate regions in repetitive or low-complexity sequence (e.g., centromeres) as a result of false-positive variant calls (apparent heterozygous variants arising from paralogous sequence alignment).
We have presented two lines of evidence to support the notion that the RHRO and SIBD methods effectively narrow the search for causal mutations. First, in three families, our mapping approaches recapitulated known linkage from traditional approaches while nominating additional candidate regions. Because traditional linkage mapping used more samples in each of these pedigrees, it is possible that it excluded some of our additional regions along with information from the wider pedigree. Alternatively, our methods might have identified new, smaller candidate regions that were missed by traditional linkage analysis. Second, two families both had sufficient sample numbers for exome-based mapping and a pathogenic variant in a known RP gene; in both of these families, our mapping approaches nominated candidate regions overlapping the causal mutation.
Our methods represent some important advances over current approaches to exome sequencing analysis in Mendelian disorders. First, our approach prioritizes candidate variants rather than progressively filtering them, which ensures that unexpected observations—such as the presence of disease-causing mutations in dbSNP—will not remove them from consideration. Such flexibility is paramount as large-scale sequencing efforts continue to catalog rare variants in human populations; our analysis of known disease-causing mutations for adRP showed that >30% were present in dbSNP build 137 (see Figure 1A). Second, our variant scoring methods incorporate read depth and allele frequency to address the possibility of missing or incorrect variant calls. Third, we utilize information about the disease tissue—specifically, relative gene expression levels—to help prioritize candidate variants. Finally, our two complementary mapping methods can reduce the search space for the causal mutation by using only the exome data and can do so with fewer affected individuals than are required for traditional linkage analysis. In our analysis of adRP-affected families, >95% of coding bases could be excluded when four affected individuals were sequenced.
It is important to note that the 24 families chosen for exome sequencing met several criteria. They were part of a cohort of families with a provisional diagnosis of adRP or dominant-acting X-linked RP, they had been screened for common disease-causing mutations, and they had at least two affected individuals who provided informed consent for whole-exome sequencing. Only unaffected parents of probands (noncarriers) were chosen as controls. We made several assumptions in the analysis of these families: (1) that a single causal mutation was shared by all affected individuals, (2) that it mapped to a coding region sufficiently covered by exome sequencing, and (3) that it matched our empirical observations of known disease-causing mutations (rare in populations, protein altering, and affecting retinally expressed genes). Because RP is genetically heterogeneous, we could not assume that the pathogenic mutation was at the same position (or even in the same gene) in different families. Therefore, we considered each family as an individual unit both at the variant-calling and analysis stages.
Although factors such as inaccurate pedigree information or unexpected forms of inheritance (e.g., digenic or autosomal recessive) might hinder our variant prioritization strategy, its performance in three families affected by recessive or X-linked RP suggests that it remains relatively robust to such issues. Nevertheless, causal mutations that are poorly covered by exome sequencing, annotated incorrectly, or lie in noncoding regulatory sequences might receive lower scores under this paradigm. For some Mendelian-disease-affected pedigrees, whole-genome sequencing might ultimately be required for determining the full extent of sequence variation shared by affected individuals, including structural and noncoding variants that remain refractory to detection by exome sequencing.
Although we showcase our methods primarily on autosomal-dominant disease, we expect that they will be useful for other forms of inheritance (e.g., recessive or X-linked) as well. Future improvements to MendelScan will accommodate recessive disease models (e.g., by prioritizing homozygous variants and compound heterozygotes) and regulatory variant annotation information (e.g., ENCODE annotation data sets) to further empower the search for genes underlying rare inherited disorders.
Acknowledgments
We thank Elaine Mardis for technology development, Bob Fulton for overseeing data production, Erica Sodergren for project-management support, and Joshua McMichael for graphic design. We are also grateful to contributors to the autosomal-dominant retinitis pigmentosa cohort, including David G. Birch, Dianna H. Wheaton, John R. Heckenlively, Peter Humphries, Marian Humphries, and Kari Branham. This work was supported by the Foundation Fighting Blindness, the National Eye Institute (grant EY007142), and the National Human Genome Research Institute (grant HG003079).
Contributor Information
Daniel C. Koboldt, Email: dkoboldt@genome.wustl.edu.
Stephen P. Daiger, Email: stephen.p.daiger@uth.tmc.edu.
Supplemental Data
Web Resources
The URLs for data presented herein are as follows:
Ingenuity Variant Analysis, http://www.ingenuity.com/products/variant-analysis
MendelScan, http://gmt.genome.wustl.edu/mendelscan
Online Mendelian Inheritance in Man (OMIM), http://www.omim.org
RetNet (Retinal Information Network), https://sph.uth.edu/retnet/
References
- 1.Bamshad M.J., Ng S.B., Bigham A.W., Tabor H.K., Emond M.J., Nickerson D.A., Shendure J. Exome sequencing as a tool for Mendelian disease gene discovery. Nat. Rev. Genet. 2011;12:745–755. doi: 10.1038/nrg3031. [DOI] [PubMed] [Google Scholar]
- 2.Gilissen C., Arts H.H., Hoischen A., Spruijt L., Mans D.A., Arts P., van Lier B., Steehouwer M., van Reeuwijk J., Kant S.G. Exome sequencing identifies WDR35 variants involved in Sensenbrenner syndrome. Am. J. Hum. Genet. 2010;87:418–423. doi: 10.1016/j.ajhg.2010.08.004. [DOI] [PMC free article] [PubMed] [Google Scholar]
- 3.Hoischen A., van Bon B.W., Gilissen C., Arts P., van Lier B., Steehouwer M., de Vries P., de Reuver R., Wieskamp N., Mortier G. De novo mutations of SETBP1 cause Schinzel-Giedion syndrome. Nat. Genet. 2010;42:483–485. doi: 10.1038/ng.581. [DOI] [PubMed] [Google Scholar]
- 4.Lalonde E., Albrecht S., Ha K.C., Jacob K., Bolduc N., Polychronakos C., Dechelotte P., Majewski J., Jabado N. Unexpected allelic heterogeneity and spectrum of mutations in Fowler syndrome revealed by next-generation exome sequencing. Hum. Mutat. 2010;31:918–923. doi: 10.1002/humu.21293. [DOI] [PubMed] [Google Scholar]
- 5.Ng S.B., Buckingham K.J., Lee C., Bigham A.W., Tabor H.K., Dent K.M., Huff C.D., Shannon P.T., Jabs E.W., Nickerson D.A. Exome sequencing identifies the cause of a mendelian disorder. Nat. Genet. 2010;42:30–35. doi: 10.1038/ng.499. [DOI] [PMC free article] [PubMed] [Google Scholar]
- 6.Ng S.B., Bigham A.W., Buckingham K.J., Hannibal M.C., McMillin M.J., Gildersleeve H.I., Beck A.E., Tabor H.K., Cooper G.M., Mefford H.C. Exome sequencing identifies MLL2 mutations as a cause of Kabuki syndrome. Nat. Genet. 2010;42:790–793. doi: 10.1038/ng.646. [DOI] [PMC free article] [PubMed] [Google Scholar]
- 7.Bilgüvar K., Oztürk A.K., Louvi A., Kwan K.Y., Choi M., Tatli B., Yalnizoğlu D., Tüysüz B., Cağlayan A.O., Gökben S. Whole-exome sequencing identifies recessive WDR62 mutations in severe brain malformations. Nature. 2010;467:207–210. doi: 10.1038/nature09327. [DOI] [PMC free article] [PubMed] [Google Scholar]
- 8.Bolze A., Byun M., McDonald D., Morgan N.V., Abhyankar A., Premkumar L., Puel A., Bacon C.M., Rieux-Laucat F., Pang K. Whole-exome-sequencing-based discovery of human FADD deficiency. Am. J. Hum. Genet. 2010;87:873–881. doi: 10.1016/j.ajhg.2010.10.028. [DOI] [PMC free article] [PubMed] [Google Scholar]
- 9.Walsh T., Shahin H., Elkan-Miller T., Lee M.K., Thornton A.M., Roeb W., Abu Rayyan A., Loulus S., Avraham K.B., King M.C., Kanaan M. Whole exome sequencing and homozygosity mapping identify mutation in the cell polarity protein GPSM2 as the cause of nonsyndromic hearing loss DFNB82. Am. J. Hum. Genet. 2010;87:90–94. doi: 10.1016/j.ajhg.2010.05.010. [DOI] [PMC free article] [PubMed] [Google Scholar]
- 10.Johnson J.O., Mandrioli J., Benatar M., Abramzon Y., Van Deerlin V.M., Trojanowski J.Q., Gibbs J.R., Brunetti M., Gronka S., Wuu J., ITALSGEN Consortium Exome sequencing reveals VCP mutations as a cause of familial ALS. Neuron. 2010;68:857–864. doi: 10.1016/j.neuron.2010.11.036. [DOI] [PMC free article] [PubMed] [Google Scholar]
- 11.Musunuru K., Pirruccello J.P., Do R., Peloso G.M., Guiducci C., Sougnez C., Garimella K.V., Fisher S., Abreu J., Barry A.J. Exome sequencing, ANGPTL3 mutations, and familial combined hypolipidemia. N. Engl. J. Med. 2010;363:2220–2227. doi: 10.1056/NEJMoa1002926. [DOI] [PMC free article] [PubMed] [Google Scholar]
- 12.Krawitz P.M., Schweiger M.R., Rödelsperger C., Marcelis C., Kölsch U., Meisel C., Stephani F., Kinoshita T., Murakami Y., Bauer S. Identity-by-descent filtering of exome sequence data identifies PIGV mutations in hyperphosphatasia mental retardation syndrome. Nat. Genet. 2010;42:827–829. doi: 10.1038/ng.653. [DOI] [PubMed] [Google Scholar]
- 13.Wang J.L., Yang X., Xia K., Hu Z.M., Weng L., Jin X., Jiang H., Zhang P., Shen L., Guo J.F. TGM6 identified as a novel causative gene of spinocerebellar ataxias using exome sequencing. Brain. 2010;133:3510–3518. doi: 10.1093/brain/awq323. [DOI] [PubMed] [Google Scholar]
- 14.Sherry S.T., Ward M.H., Kholodov M., Baker J., Phan L., Smigielski E.M., Sirotkin K. dbSNP: the NCBI database of genetic variation. Nucleic Acids Res. 2001;29:308–311. doi: 10.1093/nar/29.1.308. [DOI] [PMC free article] [PubMed] [Google Scholar]
- 15.MacArthur D.G., Balasubramanian S., Frankish A., Huang N., Morris J., Walter K., Jostins L., Habegger L., Pickrell J.K., Montgomery S.B., 1000 Genomes Project Consortium A systematic survey of loss-of-function variants in human protein-coding genes. Science. 2012;335:823–828. doi: 10.1126/science.1215040. [DOI] [PMC free article] [PubMed] [Google Scholar]
- 16.Ionita-Laza I., Makarov V., Yoon S., Raby B., Buxbaum J., Nicolae D.L., Lin X. Finding disease variants in Mendelian disorders by using sequence data: methods and applications. Am. J. Hum. Genet. 2011;89:701–712. doi: 10.1016/j.ajhg.2011.11.003. [DOI] [PMC free article] [PubMed] [Google Scholar]
- 17.Li M.X., Kwan J.S., Bao S.Y., Yang W., Ho S.L., Song Y.Q., Sham P.C. Predicting mendelian disease-causing non-synonymous single nucleotide variants in exome sequencing studies. PLoS Genet. 2013;9:e1003143. doi: 10.1371/journal.pgen.1003143. [DOI] [PMC free article] [PubMed] [Google Scholar]
- 18.Li M.X., Gui H.S., Kwan J.S., Bao S.Y., Sham P.C. A comprehensive framework for prioritizing variants in exome sequencing studies of Mendelian diseases. Nucleic Acids Res. 2012;40:e53. doi: 10.1093/nar/gkr1257. [DOI] [PMC free article] [PubMed] [Google Scholar]
- 19.Yandell M., Huff C., Hu H., Singleton M., Moore B., Xing J., Jorde L.B., Reese M.G. A probabilistic disease-gene finder for personal genomes. Genome Res. 2011;21:1529–1542. doi: 10.1101/gr.123158.111. [DOI] [PMC free article] [PubMed] [Google Scholar]
- 20.Sincan M., Simeonov D.R., Adams D., Markello T.C., Pierson T.M., Toro C., Gahl W.A., Boerkoel C.F. VAR-MD: a tool to analyze whole exome-genome variants in small human pedigrees with mendelian inheritance. Hum. Mutat. 2012;33:593–598. doi: 10.1002/humu.22034. [DOI] [PubMed] [Google Scholar]
- 21.Churchill J.D., Bowne S.J., Sullivan L.S., Lewis R.A., Wheaton D.K., Birch D.G., Branham K.E., Heckenlively J.R., Daiger S.P. Mutations in the X-linked retinitis pigmentosa genes RPGR and RP2 found in 8.5% of families with a provisional diagnosis of autosomal dominant retinitis pigmentosa. Invest. Ophthalmol. Vis. Sci. 2013;54:1411–1416. doi: 10.1167/iovs.12-11541. [DOI] [PMC free article] [PubMed] [Google Scholar]
- 22.Harrow J., Frankish A., Gonzalez J.M., Tapanari E., Diekhans M., Kokocinski F., Aken B.L., Barrell D., Zadissa A., Searle S. GENCODE: the reference human genome annotation for The ENCODE Project. Genome Res. 2012;22:1760–1774. doi: 10.1101/gr.135350.111. [DOI] [PMC free article] [PubMed] [Google Scholar]
- 23.Hamel C. Retinitis pigmentosa. Orphanet J. Rare Dis. 2006;1:40. doi: 10.1186/1750-1172-1-40. [DOI] [PMC free article] [PubMed] [Google Scholar]
- 24.Daiger S.P., Sullivan L.S., Bowne S.J. Genes and mutations causing retinitis pigmentosa. Clin. Genet. 2013;84:132–141. doi: 10.1111/cge.12203. [DOI] [PMC free article] [PubMed] [Google Scholar]
- 25.Hartong D.T., Berson E.L., Dryja T.P. Retinitis pigmentosa. Lancet. 2006;368:1795–1809. doi: 10.1016/S0140-6736(06)69740-7. [DOI] [PubMed] [Google Scholar]
- 26.Sullivan L.S., Bowne S.J., Birch D.G., Hughbanks-Wheaton D., Heckenlively J.R., Lewis R.A., Garcia C.A., Ruiz R.S., Blanton S.H., Northrup H. Prevalence of disease-causing mutations in families with autosomal dominant retinitis pigmentosa: a screen of known genes in 200 families. Invest. Ophthalmol. Vis. Sci. 2006;47:3052–3064. doi: 10.1167/iovs.05-1443. [DOI] [PMC free article] [PubMed] [Google Scholar]
- 27.Sullivan L.S., Bowne S.J., Seaman C.R., Blanton S.H., Lewis R.A., Heckenlively J.R., Birch D.G., Hughbanks-Wheaton D., Daiger S.P. Genomic rearrangements of the PRPF31 gene account for 2.5% of autosomal dominant retinitis pigmentosa. Invest. Ophthalmol. Vis. Sci. 2006;47:4579–4588. doi: 10.1167/iovs.06-0440. [DOI] [PMC free article] [PubMed] [Google Scholar]
- 28.Li H., Durbin R. Fast and accurate short read alignment with Burrows-Wheeler transform. Bioinformatics. 2009;25:1754–1760. doi: 10.1093/bioinformatics/btp324. [DOI] [PMC free article] [PubMed] [Google Scholar]
- 29.Koboldt D.C., Zhang Q., Larson D.E., Shen D., McLellan M.D., Lin L., Miller C.A., Mardis E.R., Ding L., Wilson R.K. VarScan 2: somatic mutation and copy number alteration discovery in cancer by exome sequencing. Genome Res. 2012;22:568–576. doi: 10.1101/gr.129684.111. [DOI] [PMC free article] [PubMed] [Google Scholar]
- 30.Gamsiz E.D., Ouyang Q., Schmidt M., Nagpal S., Morrow E.M. Genome-wide transcriptome analysis in murine neural retina using high-throughput RNA sequencing. Genomics. 2012;99:44–51. doi: 10.1016/j.ygeno.2011.09.003. [DOI] [PMC free article] [PubMed] [Google Scholar]
- 31.Farkas M.H., Grant G.R., White J.A., Sousa M.E., Consugar M.B., Pierce E.A. Transcriptome analyses of the human retina identify unprecedented transcript diversity and 3.5 Mb of novel transcribed sequence via significant alternative splicing and novel genes. BMC Genomics. 2013;14:486. doi: 10.1186/1471-2164-14-486. [DOI] [PMC free article] [PubMed] [Google Scholar]
- 32.Bowne S.J.S.L., Sullivan L.S., Avery C.E., Sasser E.M., Roorda A., Duncan J.L., Wheaton D.H., Birch D.G., Branham K.E., Heckenlively J.R. Mutations in the small nuclear riboprotein 200 kDa gene (SNRNP200) cause 1.6% of autosomal dominant retinitis pigmentosa. Mol. Vis. 2013;19:2407–2417. [PMC free article] [PubMed] [Google Scholar]
- 33.Bowne S.J., Humphries M.M., Sullivan L.S., Kenna P.F., Tam L.C., Kiang A.S., Campbell M., Weinstock G.M., Koboldt D.C., Ding L. A dominant mutation in RPE65 identified by whole-exome sequencing causes retinitis pigmentosa with choroidal involvement. Eur. J. Hum. Genet. 2011;19:1074–1081. doi: 10.1038/ejhg.2011.86. [DOI] [PMC free article] [PubMed] [Google Scholar]
Associated Data
This section collects any data citations, data availability statements, or supplementary materials included in this article.