

Abstract
Signaling bias refers to G protein-coupled receptor ligand ability to preferentially activate one type of signal over another. Bias to evoke signaling as opposed to sequestration has been proposed as a predictor of opioid ligand potential for generating tolerance. Here we measured whether delta opioid receptor agonists preferentially inhibited cyclase activity over internalization in HEK cells. Efficacy (τ) and affinity (KA) values were estimated from functional data and bias was calculated from efficiency coefficients (log τ/KA). This approach better represented the data as compared to alternative methods that estimate bias exclusively from τ values. Log (τ/KA) coefficients indicated that SNC-80 and UFP-512 promoted cyclase inhibition more efficiently than DOR internalization as compared to DPDPE (bias factor for SNC-80: 50 and for UFP-512: 132). Molecular determinants of internalization were different in HEK293 cells and neurons with βarrs contributing to internalization in both cell types, while PKC and GRK2 activities were only involved in neurons. Rank orders of ligand ability to engage different internalization mechanisms in neurons were compared to rank order of E max values for cyclase assays in HEK cells. Comparison revealed a significant reversal in rank order for cyclase E max values and βarr-dependent internalization in neurons, indicating that these responses were ligand-specific. Despite this evidence, and because kinases involved in internalization were not the same across cellular backgrounds, it is not possible to assert if the magnitude and nature of bias revealed by rank orders of maximal responses is the same as the one measured in HEK cells.
Electronic supplementary material
The online version of this article (doi:10.1007/s00018-013-1461-7) contains supplementary material, which is available to authorized users.
Keywords: Biased agonism, Functional selectivity, Analgesic tolerance, Trafficking, Operational model
Introduction
Most clinically available opiates act upon mu opioid receptors (MORs) to elicit powerful analgesic actions. However, despite their uncontested efficacy in alleviating acute severe pain, MOR agonists are much less effective for the treatment of chronic pain syndromes [1]. These limitations have driven attention to other receptors, in particular delta opioid receptors (DORs), which are currently viewed as promising targets for the development of novel opiate analgesics for chronic pain management [2–4]. Within this context, DOR agonist potential for generating tolerance constitutes a limitation for their use as long-acting opioid analgesics [5, 6].
Remarkably, not all DOR agonists produce the same degree of tolerance [5, 7, 8] and some of these differences have been attributed to distinct trafficking profiles of the different ligands [9]. For example, administration of SNC-80 ((1)-4-[(αR)-α-((2S,5R)-4-allyl-2,5-dimethyl-1-piperazinyl)-3- methoxybenzyl]-N,N-diethylbenzamide) triggered marked in vivo DOR sequestration and acute tolerance while poorly internalizing agonists like ARM390, ADL5747 (N,N-diethyl-3-hydroxy-4-(spiro[chromene-2,4′-piperidine]-4-yl)benzamide), and ADL5859 (N,N-diethyl-4-(5-hydroxyspiro[chromene-2,4′-piperidine]-4-yl) benzamide) did not induce a rapid loss of analgesic actions [7, 10]. Despite marked differences in internalization and distinct potential for generating acute analgesic tolerance, some of these ligands display a similar ability to produce maximal G protein activation [7] or cAMP accumulation [11], which has led to the suggestion that certain DOR agonists may display a response bias that favors signaling over internalization. Moreover, the observation that acute tolerance induced by non-internalizing DOR agonists is less than that produced by internalizing ones has fueled the notion that the proposed bias could be a means for screening/identifying DOR agonists with longer-lasting analgesic actions.
Essential to this type of screening is the capacity to quantify bias. By applying novel analytical tools specifically developed to this purpose [12, 13], here we show that in HEK293 cells, SNC-80 and UFP-512 [H-Dmt-Tic-NH-CH(CH2-COOH)-Bid] were significantly more efficient in promoting cyclase inhibition than DOR internalization as compared to DPDPE ([d-Pen(2), d-Pen(5)]-enkephalin). However, molecular determinants of internalization were different in HEK293 cells and neurons, raising the question as to whether bias involving internalization responses would be maintained across cellular backgrounds.
Materials and methods
DNA constructs
Murine DORs tagged with the Flag epitope at the N-terminus were kindly provided by Dr. M. von Zastrow (University of California at San Francisco) and have been described elsewhere [14]. Constructs encoding human DOR fused to yellow green fluorescent protein (YFP) were generated as described before [8]. βarr2-Luc and βarr319–418 were a generous gift from Dr. Bouvier (Université de Montréal, Canada).
Cell culture and transfections
Immortalized cell lines Internalization and cAMP accumulation assays to establish signaling bias of DOR agonists were carried out in HEK293 cells stably expressing Flag-DORs. Monoclonal cell lines expressing the receptor were produced using Lipofectamine (Invitrogen, Carlsbad, CA, USA) to transfect 6 μg of DNA/100 mM Petri dish. Cells were then selected with G418 (500 μg/ml) and a clone expressing 1 pmol/mg protein was used [15]. Cells were grown and maintained in Dulbecco’s modified Eagle’s medium supplemented with 10 % (v/v) fetal bovine serum (FBS), 1,000 U/ml penicillin, 1 mg/ml streptomycin, and 2 mM glutamine, in a humidified atmosphere of 5 % CO2 at 37 °C. For the experimental series evaluating the effect of dominant negative βarr (βarr319–418) [16] on DOR internalization, βarr319–18 (9 μg) or empty vector pcDNA3 (9 μg) were cotransfected with DOR (3 μg) to yield similar membrane expression of receptors as in stable cell lines. siRNA GRK2 (Smart pool, Thermo Fisher Scientific, Waltham, MA, USA) were introduced into DOR-expressing cells (25 pmol/well in 24-well plates) using DharmaFECT1 according to the manufacturer’s specifications. In experiments in which PKC activity was blocked by chelerythrine (4 μM), the drug was introduced into the incubation medium 10 min prior to DOR agonists and remained present until the end of the experiment. In experiments in which PMA was used to stimulate PKC activity, the phorbol ester was introduced at a concentration of 500 nM 60 min before agonist addition, and allowed to remain in the medium until the end of the experiment.
Primary neuronal cultures were used for immunofluorescence assays to assess ligand-induced DOR internalization in neurons. Cultures were prepared from rat postnatal prefrontal cortex (P0–P2) using a procedure adapted from a previously described method [17]. Briefly, pups were cryoanaesthetized, their brains rapidly removed and transferred into ice-cold dissociation solution (NaSO4 90 mM; K2SO4 30 mM; MgCl2 5,8 mM; CaCl2; HEPES 10 mM; glucose 20 mM; pH 7,4). The prefrontal cortex was dissected and digested in papain solution (20 U/ml; 40 min at 37 °C) following which the product was passed through Pasteur pipettes of progressively decreasing diameter for mechanical dissociation. The suspension obtained was centrifuged, cells resuspended and diluted to a density of 2.5 million/ml before plating on glass coverslips precoated with collagen/poly-l-lysine (each at 0.1 mg/ml). Cells were cultured in neurobasal A medium supplemented with B27 (4 %), 100 U/ml penicillin–streptomycin, Glutamax (2 %) and fetal bovine serum (10 %) for 24 h. At this time, coverslips were transferred from their home dish to a six-well plate containing 2 ml of neurobasal A medium/well and transfected with Flag-DORs (8 μg of DNA/well) by means of a modified calcium phosphate transfection protocol [18]. Briefly, a calcium phosphate/DNA precipitate was formed in HEPES buffered saline (pH 7.03) and was added dropwise to the neurobasal A medium. After 30 min of transfection, neurons were washed in Hank’s balanced salt solution and returned to their original culture medium. For siRNA experiments, cells were transfected 24-h post-SFDOR transfection with βarr siRNA or GRK2 siRNA (100 and 75 pmol/35 mm dish, respectively) using Lipofectamine as indicated by the manufacturer. GRK2 siRNA was from Thermo Fisher Scientific and for βarr1/2 knock down primers and oligonucleotides were designed as previously described [19]. In both cases, knockdown was verified by Western-blot analysis. For experiments in which PKC was blocked by chelerythrine (4 μM), the drug was introduced 10 min prior to DOR agonists and allowed to remain present throughout the experiment.
Evaluation of DOR trafficking
ELISA-based assays Measurement of surface-expressed receptors and quantification of receptor internalization was assessed using an ELISA-based method adapted from a previously published protocol [15]. HEK293 cells stably expressing Flag-DORs were seeded at a density of 2.5 × 10⁵ cells/well and grown on 24-well polylysine-coated plates for 48 h. Unless otherwise specified, on the day of the experiment cells were exposed to increasing concentrations of different ligands (0–100 μM) for 30 min before internalization was stopped by addition of cold PBS (phosphate-buffered saline). After three PBS washes, cells were fixed for 15 min at 4 °C in paraformaldehyde (3 %) and non-specific binding was blocked by incubation with PBS/BSA 1 %/CaCl2 1 mM at RT for 30 min. Cells were subsequently incubated with anti-FLAG M1 antibody (1:1,000; Sigma-Aldrich) for 1 h (RT), washed three times and incubated with peroxidase-conjugated (HRP) anti-mouse antibody (1:5,000; Amersham Biosciences, Piscataway, NJ, USA) for 30 min. After extensive washing, 200 μl of the HRP substrate o-phenylenediamine dihydrochloride (SIGMA FASTTM OPD, Sigma-Aldrich) was added to each well. The reaction was allowed to proceed for 8 min and stopped using 50 μl of 3 N HCl. An amount of 200 μl of the mix was then transferred to a 96-well plate for optical density (OD) evaluation at 492 nM in a microplate reader (Victor3; PerkinElmer, Waltham, MA, USA). OD readings corresponded to the signal generated by receptors at the cell surface. The amount of surface receptors internalized following exposure to agonists was calculated by subtracting OD obtained in the presence of agonist from the one obtained in its absence. Results were expressed as % of receptors initially present at the membrane according to the following calculation: 100 × (ODBasal − ODStimulated)/(ODBasal) where ODBasal and ODStimulated correspond to the signal obtained in absence or presence of agonist, respectively [10].
Immunofluorescence (IF) microscopy Immunocytochemistry experiments were carried out 2 days after transfection as previously described [8]. Briefly, labeling of surface Flag-DORs was done by introducing Ca2+-dependent mouse anti-Flag M1 antibody (1:100; Sigma) to the incubation medium 30 min prior to vehicle (DMSO 0.01 %) or agonists (10 μM). Following treatments of different durations (15–120 min), neurons were washed in Ca2+-free phosphate buffered solution (PBS) (3 × 1 min, at 37 °C). These washes made it possible to remove treatment drugs as well as antibody bound to surface receptors, thus ensuring that only Flag-DORs that had been internalized and protected from washes, conserved first antibody labeling [20]. Cells were then fixed with 4 % PFA and permeabilized in PBS/0.1 % triton. Non-specific sites were blocked with PBS/BSA 1 % (10 min at RT) and neurons then exposed to secondary antibody (donkey anti-mouse Alexa-488; 1:1,000; Molecular Probes). All images were acquired using a Prairie Technologies point-scanning confocal except for Fig. 5, where the microscope used was an Olympus FluoView 1,000 confocal system. Mean cytosolic labeling intensity was quantified in cells that had been exposed to vehicle or agonist for 60 min, using ImageJ software according to a previously described method [8]. Briefly, nuclear integrated intensity was subtracted from the integrated intensity present within the perimeter of the neuron soma. The resulting value was divided by the area comprised between the nuclear and outer perimeters of the cell to yield mean cellular intensity. Nuclear fluorescence was considered as the background, and its mean intensity subtracted from the quotient described above.
Fig. 5.

PKC activity contributes to DOR internalization in neurons but not in HEK293 cells. a Cortical neuron cultures expressing Flag-DORs were exposed to chelerythrine (4 μM) or vehicle and indicated ligands (10 μM) as before. b Histograms correspond to mean intracellular immunoreactivity in the presence or absence of chelerythrine (n = 4). Two-way ANOVA revealed an effect of drug (p < 0.0001), chelerythrine (p < 0.0001) and an interaction (p = 0.0012). * p < 0.05; ** p < 0.01; *** p < 0.001 following Bonferroni post hoc tests. As specified in the Materials and methods section, the microscope used in this series was different from the one used in previous figures. c HEK293 cells stably expressing Flag-DORs were exposed to chelerythrine as above and internalization measured following incubation with SNC-80 or DPDPE. Data were normalized to maximum observed in the absence of chelerythrine and correspond to mean ± SEM of four experiments. Two-way ANOVA analysis revealed an effect of time (p < 0.0001) for both agonists and a chelerythrine effect for DPDPE (p < 0.001). Dose–response curves for d DPDPE and e SNC-80 were completed in cells treated with chelerythrine (4 μM) or vehicle as indicated. Data were analyzed by two-way ANOVA revealing an effect of concentration (p < 0.001; n = 3) for DPDPE and an effect of concentration (p < 0.001), of chelerythrine (p < 0.01) and an interaction (p < 0.05; n = 3) for SNC-80
cAMP accumulation
cAMP accumulation assays were carried out according to a previously described protocol [21], [3H]ATP and [3H]cAMP were separated by sequential chromatography on Dowex exchange resin and aluminum oxide columns. cAMP produced was estimated by calculating the ratio of [3H]cAMP/([3H]ATP + [3H]cAMP) in each sample.
BRET assays
BRET assays for βarr2 recruitment were conducted using a modified version of a previous protocol [8]. Briefly, HEK293 cells grown in 100 mM Petri dishes were transfected with: βarr2-Luc (0.2 μg) and DOR-YFP (6 μg). Experiments were carried out 2 days after transfection. At this time, cells were kept at 37 °C and exposed to vehicle or DOR agonists (1 μM) for 5 min. For experiments assessing PKC activity, cells were pretreated with PMA (500 nM) for 60 min prior to exposure to ligands. Treatment was stopped by washing cells with ice-cold phosphate-buffered solution (PBS) following which they were transferred to 96-well plates (white Optiplate; PerkinElmer Life Sciences) and BRET measures obtained in a Victor3 plate reader (PerkinElmer Life Sciences) 5 min after manual addition of coelenterazine h. Plates were then introduced into a Victor3 plate reader (PerkinElmer Life Sciences) and BRET measures were determined by calculating the ratio of light emitted by YFP (520–550 nM) over the light emitted by Rluc (440–480 nM). BRET values were then corrected by subtracting the background signal (detected when Rluc-tagged constructs were expressed without acceptor) from the BRET signal detected in cells coexpressing both Rluc and YFP (Net BRET).
Western blot
Two days after siRNA transfection, neurons or HEK293 cells were lysed in RIPA buffer (50 mM Tris–HCl pH 7.4, 1 % triton X100, 0.25 % deoxycholic acid, 150 mM NaCl, 1 mM EDTA, 1 mM PMSF, 1 μg/ml Aprotinin, PI 1X, 1 mM Na3VO4 et 1 mM NaF). Following centrifugation at 10,000 rpm for 30 min, the supernatant containing membranes and cytosol was recovered. GRK2 and βarr resolved in SDS-PAGE were then transferred (50 mA, 16 h, Bio-Rad Mini-Trans Blot apparatus) from the gels onto nitrocellulose (GE Healthcare, Piscataway, NJ, USA). GRK2 polyclonal antibody (SRC2: sc-18; Santa Cruz Biotech, Santa Cruz, CA, USA) and βarr antibody (a generous gift from Dr. S. Laporte, McGill University) were used at a dilution of 1:200 and 1:1,000 to determine, respectively, the amount of total GRK2 and of βarr present in cells transfected with siRNA or scrambled controls. Secondary anti-rabbit horseradish-conjugated antibody was used at 1:20,000 dilution (Amersham Biosciences, Piscataway, NJ, USA). Chemiluminescence detection reagent (GE Healthcare) was used to reveal blotted proteins and images of immunoreactive bands were acquired with MCID (Imaging Research Inc, Canada).
Curve fitting
Concentration response curves describing modulation of cAMP production or DOR internalization were obtained for five different agonists. In a first series of analyses, curves were generated with GraphPad 5 using the four parameter logistic function y = a + (b − a)/(1 + 10(logEC50-x).c) and fixing the slope parameter c at the value of one or allowing it to freely vary (y → measured response, a → minimal asymptote, b → maximal asymptote, a-b → E max). In every case, data were best fit by the equation with slope fixed at one. Concentration response curves were also analyzed with the operational model of agonism [22] to obtain efficacy (τ) and functional affinity (KA) values that were then used in the calculation of log (τ/KA) for the calculation of bias [13]. Curve fitting was done using the equation: y = basal + (E max-basal)/1 + [(10logKA + x)/(10logτ + x)]n, where basal corresponds to the response observed in the absence of agonist; E max is the maximal response of the system; KA denotes agonist affinity for the receptor state(s) mediating the response; τ describes agonist efficacy; x corresponds to the logarithm of molar concentration of agonist and n is the slope of the function which links occupancy to response. System parameters (n and E max) were estimated from curves generated by full agonists DPDPE and SNC-80, where the only constraint imposed was for each of these values to be shared by both ligands. Estimates for cyclase dose–response curves were E max: 75 and n: 0.72. Estimates for internalization curves were E max: 64 and n: 1.1. These values were then used as system parameters to simultaneously fit curves for all ligands (Prism5 operational model “partial agonist”), yielding corresponding τ and KA values for each agonist except the standard, DPDPE. τ and KA values for DPDPE were obtained from depletion assays in which dose–response curves were generated in cells expressing progressively lower amounts of receptors (Prism5 operational model: receptor depletion). E max and n values used to fit curves in depletion mode were the same as above. Pooled standard error values were calculated as in Gregory et al. [23]: pooled
Results
Establishing evidence of ligand bias in DOR-mediated responses
Many MOR and DOR agonists display an “imbalance” in their ability to promote maximal signaling and regulatory responses [24–26]. However, the bases for this imbalance remain a matter of active investigation, in particular the extent to which biased agonism may contribute to poor sequestration by agonists that effectively engage signaling [7, 26]. To address this question, we used HEK293 cells to compare cAMP modulation and sequestration induced by five different DOR agonists. Dose–response curves for these responses and corresponding Emax (maximal effect) and potency (EC50) values appear in Fig. 1 and Tables 1 and 2. Data presented therein indicate that maximal responses (E max) by DPDPE and SNC-80 were significantly larger than those evoked by morphine, UFP-512, and TIPP, both in cyclase and internalization assays. However, E max values for partial agonists were not proportional across the two responses. On the one hand, the three partial agonists inhibited cAMP production displaying responses that ranged between 30 and 80 % of maximal inhibition induced by the standard DPDPE (Tables 1, 2). On the other hand, morphine induced no significant sequestration (p = 0.2136; n = 11) while internalization by UFP-512 and TIPP was significant (p < 0.01; n = 9–10) but only reached ~10 % of the response induced by DPDPE (Fig. 1b). As shown in Supplementary Fig. 1, insufficient incubation time could not have accounted for the small magnitude of internalization by partial agonists, since kinetic experiments indicated that at the time at which dose–response curves were obtained (30 min) sequestration had attained its plateau.
Fig. 1.

Dose–response curves showing ligand-induced changes in cAMP accumulation and receptor internalization. a cAMP inhibition and b DOR internalization were monitored in Flag-DOR HEK293 cells. Inhibition in cAMP production was expressed as % change with respect to non-treated cells, and corresponds to mean ± SEM of 6–9 independent experiments carried out in triplicate. DOR sequestration was expressed as % of receptors present at the membrane before exposure to drugs for a period of 30 min. Values represent mean ± SEM of 9–12 independent experiments carried out in triplicate. The main panels and insets, respectively, show dose–response curves generated by means of three parameter logistic equation or operational model as described in the Materials and methods section. Statistical analyses using two-way ANOVA showed an effect of drug (p < 0.0001), and effect of concentration (p < 0.0001) and an interaction (p < 0.0001) both for cAMP and internalization assays. Subsequent comparisons by one-way ANOVA with Bonferroni correction indicated a significant effect of concentration for all drugs for both responses except for morphine in internalization assays. Detailed comparisons among drugs are provided in Tables 1 and 2
Table 1.
Potency (EC50) and maximal response (E max) displayed by DOR agonists in cAMP accumulation assays carried out in HEK293 cells
| cAMP inhibition | ||
|---|---|---|
| log EC50 ± SEM (M) | E max ± SEM | |
| SNC-80 (n = 9) | −8.43 ± 0.11a,b | 69.42 ± 2.12 g,h |
| DPDPE (n = 8) | −8.22 ± 0.11c,d | 68.82 ± 2.31i,j |
| UFP-512 (n = 7) | −9.44 ± 0.19e | 47.97 ± 2.06 k |
| Morphine (n = 7) | −6.04 ± 0.14f | 45.86 ± 3.98 l |
| TIPP (n = 7) | −10.1 ± 0.46 | 17.23 ± 2.00 |
Statistical comparisons among drugs done using one-way ANOVA followed by Bonferroni post hoc tests
Log EC50 comparisons
aSNC-80 vs. UFP-512 p < 0.001
bSNC-80 vs. Morphine p < 0.001
cDPDPE vs. UFP-512 p < 0.001
dDPDPE vs. Morphine p < 0.001
eUFP-512 vs. TIPP p < 0.001
fMorphine vs. TIPP p < 0.001
E max comparisons
gSNC-80 vs. UFP-512 p < 0.01
hSNC-80 vs. Morphine p < 0.001
iDPDPE vs. UFP-512 p < 0.01
jDPDPE vs. Morphine p < 0.001
kUFP-512 vs. TIPP p < 0.001
lMorphine vs. TIPP p < 0.001
Table 2.
Potency (EC50) and maximal response (E max) displayed by DOR agonists in internalization assays carried out in HEK293 cells
| Internalization | ||
|---|---|---|
| log EC50 ± SEM (M) | E max ± SEM | |
| SNC-80 (n = 12) | −5.51 ± 0.08a,b,c | 62.0 ± 2.3d,e,f |
| DPDPE (n = 11) | −6.90 ± 0.08 | 54.9 ± 1.59 g,h |
| UFP-512 (n = 10) | −6.38 ± 0.32 | 5.5 ± 0.5 |
| Morphine (n = 11) | N/A | N/A |
| TIPP (n = 9) | −7.21 ± 0.45 | 4.9 ± 0.6 |
Statistical comparisons among drugs done using one-way ANOVA followed by Bonferroni post hoc tests
N/A not applicable, minimal effect by morphine prevented meaningful curve fitting
Log EC50 comparisons
aSNC-80 vs. DPDPE p < 0.001
bSNC-80 vs. UFP-512 p < 0.05
cSNC-80 vs. TIPP p < 0.001
E max comparisons
dSNC-80 vs. DPDPE p < 0.05
eSNC-80 vs. UFP-512 p < 0.001
fSNC-80 vs. TIPP p < 0.001
gDPDPE vs. UFP-512 p < 0.001
hDPDPE vs. TIPP p < 0.001
One of the favored explanations for the observed “disproportion” in the magnitude of signaling and internalization E max values is the existence of ligand bias [26]. However, disproportion without a reversal in the rank order of maximal response may admit alternative interpretations since E max values depend not only on ligand properties but also on system determinants such as total receptor number, maximal response allowed by the system, and the efficiency with which the stimulus imparted by an active receptor couples to the response of interest [27]. Based on these considerations, it is possible that a more efficient stimulus–response coupling and/or the saturation of maximal response in cyclase assays could have resulted in partial agonists (UFP-512, TIPP, and morphine) displaying “disproportionately” higher E max values in cyclase than in internalization assays.
The operational model proposed by Black and Leff [22] provides a means of estimating relative drug efficacies while controlling for the above-mentioned confounders and, at the same time, allows quantifying the bias across different responses [12, 13]. Quantification is achieved by calculating two operational parameters from dose–response curves: (1) ligand efficacy (τ to induce each of the responses of interest and (2) “functional affinity” (KA), which describe the tendency of the agonist to interact with receptor state(s) mediating the response [12, 13]. According to this conception of the operational model, bias may result from a ligand displaying distinct relative efficacies (τ) at different pathways and/or from its differential affinity for the receptor state(s) mediating these effects. Whatever the combination, all possibilities are contemplated by calculating a transduction coefficient τ/KA, which describes the efficiency with which a drug evokes a particular response. We have used this approach to measure signaling versus internalization bias for the different DOR agonists.
Operational parameters derived from cAMP accumulation and internalization assays are shown in Tables 3 and 4. Within the context of the operational model, parameters obtained from cyclase dose–response curves indicate that the efficacy with which UFP-512 (τ = 0.35 ± 0.07) and morphine (τ = 0.44 ± 0.26) activated the receptor to inhibit cAMP production was not different from each other, but UFP-512 displayed much higher affinity for the receptor state(s) mediating this effect (log KAUFP = −8.82 ± 0.18, log KAMOR = −5.02 ± 0.36; Tables 3, 4). Thus, despite displaying similar efficacies, UFP-512 had a larger transduction coefficient than morphine [log (τ/KA)UFP = 9.16 ± 0.20, log (τ/KA)MOR = 5.46 ± 0.45; Tables 3, 4]. Taking log (τ/KA) coefficients as an indicator of drug efficiency to inhibit cAMP production [12], morphine’s coefficient was the lowest while that of UFP-512 did not differ from those of DPDPE and SNC-80 (Tables 3, 4). Also note that although TIPP efficacy was much lower than that of DPDPE, differences in apparent affinities accounted for the fact that TIPP’s transduction coefficient was not different from that of this full agonist (Tables 3, 4). Internalization responses were also analyzed by means of the operational model, except for morphine where absence of internalization prevented the calculation of meaningful operational parameters. For the remaining ligands, τ values allowed to distinguish two groups of drugs in which DPDPE/SNC-80 displayed higher efficacy for internalization than UFP-512/TIPP (Tables 3, 4). However, differences in KA accounted for the fact that the transduction coefficient for SNC-80 [log (τ/KA): 5.51 ± 0.50] was not different from that of UFP-512 [log (τ/KA): 5.90 ± 0.24] and was lower than that of TIPP [log (τ/KA): 6.83 ± 0.33]. Conversely, despite not differing at the level of their τ values, distinct functional affinities (log KASNC = −4.28 ± 0.38, log KADPDPE = −6.12 ± 0.11) determined that transduction coefficients were also different for the two full agonists [log (τ/KA)SNC = 5.51 ± 0.50, log (τ/KA)DPDPE = 6.85 ± 0.13; Tables 3, 4].
Table 3.
Operational parameters describing DOR agonist responses in cAMP accumulation and internalization assays carried out in HEK293 cells
| cAMP inhibition | |||
|---|---|---|---|
| log KA ± SEM (M) | log τ ± SEM | log (τ/KA) ± SEM | |
| SNC-80 (n = 9) | −6.58 ± 0.43a,b,c | 1.77 ± 0.39 h,i,j | 8.35 ± 0.58o |
| DPDPE (n = 8) | −6.38 ± 0.13d,e,f | 1.62 ± 0.12 k,l,m | 8.00 ± 0.18p |
| UFP-512 (n = 7) | −8.82 ± 0.18 g | 0.35 ± 0.07 | 9.16 ± 0.20q |
| Morphine (n = 7) | −5.02 ± 0.36 | 0.44 ± 0.26n | 5.46 ± 0.45r |
| TIPP (n = 7) | −9.51 ± 0.46 | −0.71 ± 0.09 | 8.80 ± 0.47 |
Statistical comparisons among drugs done using one-way ANOVA followed by Bonferroni post hoc tests
Log KA comparisons
aSNC-80 vs. UFP-512 p < 0.001
bSNC-80 vs. morphine p < 0.05
cSNC-80 vs. TIPP p < 0.001
dDPDPE vs. UFP-512 p < 0.001
eDPDPE vs. morphine p < 0.05
fDPDPE vsTIPP p < 0.001
gUFP-512 vs. morphine p < 0.001
Log τ comparisons
hSNC-80 vs. TIPP p < 0.001
iSNC-80 vs. morphine p < 0.01
jSNC-80 vs. UFP-512 p < 0.01
kDPDPE vs. morphine p < 0.05
lDPDPE vs. UFP-512 p < 0.05
mDPDPE vs. TIPP p < 0.001
nMorphine vs. TIPP p < 0.05
Log (τ/KA) comparisons
oSNC-80 vs. morphine p < 0.001
pDPDPE vs. morphine p < 0.001
qUFP-512 vs. morphine p < 0.001
rMorphine vs. TIPP p < 0.001
Table 4.
Operational parameters describing DOR agonist responses in cAMP accumulation and internalization assays carried out in HEK293 cells
| Internalization | |||
|---|---|---|---|
| log KA ± SEM (M) | log τ ± SEM | log (τ/KA) ± SEM | |
| SNC-80 (n = 12) | −4.28 ± 0.38a,b,c | 1.23 ± 0.33e,f | 5.51 ± 0.50i,i |
| DPDPE (n = 11) | −6.12 ± 0.10d | 0.72 ± 0.07 g,h | 6.85 ± 0.13 |
| UFP-512 (n = 10) | −6.85 ± 0.23 | −0.95 ± 0.04 | 5.90 ± 0.24 |
| Morphine (n = 11) | N/A | N/A | N/A |
| TIPP (n = 9) | −7.83 ± 0.33 | −1.00 ± 0.04 | 6.83 ± 0.33 |
Statistical comparisons among drugs done using one-way ANOVA followed by Bonferroni post hoc tests
N/A not applicable, minimal effect by morphine prevented meaningful curve fitting
Log KA comparisons
aSNC-80 vs. DPDPE p < 0.01
bSNC-80 vs. UFP-512 p < 0.001
cSNC-80 vs. TIPP p < 0.001
dDPDPE vs. TIPP p < 0.01
Log τ comparisons
eSNC-80 vs. UFP-512 p < 0.001
fSNC-80 vs. TIPP p < 0.001
gDPDPE vs. UFP-512 p < 0.001
hDPDPE vs. TIPP p < 0.001
Log τ/KA comparisons
iSNC-80 vs. DPDPE p < 0.01
jSNC-80 vs. TIPP p < 0.05
To estimate ligand bias from transduction coefficients it is necessary to correct for possible differences in the efficiency with which the receptor itself couples to the different responses. For this purpose, τ/KA values need to be “normalized” to the same standard across responses of interest [12, 13]. Here the standard used was DPDPE and relative log (τ/KA) values are shown in Table 5. Comparison of normalized coefficients indicated that SNC-80 and UFP-512 were respectively 50 and 132-fold more efficient in generating cyclase than internalization as compared to DPDPE. These values confirm that despite the marked imbalance in their internalization E max, both agonists preferentially activate signaling over sequestration when compared to DPDPE.
Table 5.
cAMP inhibition and internalization coefficients for DOR agonists*
| Normalized cyclase coefficients | Normalized internalization coefficients | |||
|---|---|---|---|---|
| Δ log (τ/KA) ± SEM | Δ log (τ/KA) ± SEM | Bias factor | p value# | |
| SNC-80 | 0.36 ± 0.61 (n = 9) | −1.34 ± 0.50 (n = 12) | 1.70 | 0.04 |
| DPDPE | 0.00 ± 0.25 (n = 8) | 0.00 ± 0.14 (n = 11) | ||
| UFP-512 | 1.17 ± 0.27 (n = 7) | −0.95 ± 0.24 (n = 10) | 2.12 | <0.0001 |
| Morphine | −2.53 ± 0.48 (n = 7) | N/A (n = 11) | N/A | N/A |
| TIPP | 0.81 ± 0.50 (n = 7) | −0.02 ± 0.34 (n = 9) | 0.82 | 0.17 |
*DPDPE was used as the standard
#Statistical comparisons of transduction coefficients across assays were done using two-tailed Student’s t test
DOR internalization in neurons
Regulatory proteins that control opioid receptor internalization are not the same across different cell types and this variation could influence not only the efficiency of stimulus response coupling but also the signaling molecules with which the receptor interacts to produce internalization. As a consequence, cellular background could influence both the magnitude of response and the molecular determinants of internalization. To determine whether these considerations were relevant to DOR agonists, we compared magnitude and mechanisms of ligand-induced internalization in HEK293 cells and cultured neurons, which are more akin to the cellular background where DOR agonists produce their analgesic effects. Internalization in neurons was assessed by transfecting rat cortical neurons with Flag-DORs and labeling surface receptors prior to treating them with ligand concentrations that supported maximal internalization in HEK293 cells (10 μM). At the end of different incubation periods, receptors remaining at the membrane were stripped of the labeling antibody such that only DORs protected by internalization were subsequently revealed by immunofluorescence labeling. As shown in Fig. 2a, neurons that were exposed to vehicle displayed modest intracellular labeling, which is consistent with low levels of constitutive internalization. Treatment with different ligands induced progressive increase in intracellular immunoreactivity, with marginal increment beyond 60 min exposure to the agonist. Consequently, internalization was quantified following 60-min treatment with different ligands (Fig. 2b). Internalization by DPDPE and SNC-80 were similar, and significantly higher than responses by UFP512, morphine, and TIPP, whose respective magnitudes were 62 ± 4, 49 ± 3, and 47 ± 3 % of the effect by DPDPE. Thus, at a concentration of 10 μM, the difference in internalization between full and partial agonists became less pronounced, a behavior that could be explained by a more effective stimulus–response coupling in neurons than in HEK cells.
Fig. 2.

Internalization in neurons. a Cortical neurons in primary cultures expressing Flag-DORs were labeled at the surface prior to exposure to different ligands (10 μM) for the indicated times. At the end of treatments, antibody bound to surface receptors was stripped and cells processed for visualization of intracellular labeling. A representative example from three independent time course experiments is shown. b Histograms correspond to mean intracellular labeling intensity quantified in neurons that were exposed to agonists or vehicle for 1 h and represent mean ± SEM of 13–14 independent experiments. Internalization data were analyzed by means of one-way ANOVA with Bonferroni correction for multiple comparisons. # p < 0.001 as compared to vehicle; *** p < 0.001
Mechanisms involved in DOR internalization are cell-dependent
Internalization is a complex cellular response usually determined by multiple signals. In the case of DORs, these signals include G protein-coupled receptor kinases (GRKs) [28], PKCs [29, 30], and βarrs [28, 31, 32] whose expression may vary across different cell types [33, 34]. Hence, we were interested in finding out if and to what extent distinct cellular backgrounds influenced the type of regulatory protein contributing to ligand-dependent DOR internalization.
Implication of neuronal βarrs was assessed by silencing their expression (Fig. 3a). As shown in Fig. 3b (inset), neurons expressed βarr1 and βarr2, both of which were down-regulated by siRNA transfection. As a result, sequestration by a maximal effective concentration of different agonists was reduced by ~30–60 % (Fig. 3a, b), indicating that all of them relied upon βarr function for effective internalization. βarr implication in ligand-induced internalization of DORs was also assessed in HEK293 cells by means of a construct corresponding to the C-terminal region of βarr1. This fragment binds to clathrin at the same site as endogenous βarrs, acting as a dominant negative mutant on the internalization function of βarr1 and βarr2 [16], both of which were expressed in HEK293 cells (Fig. 3c, inset). Expression of the dominant negative construct inhibited DOR sequestration by SNC-80 and DPDPE (Fig. 3c), indicating their ability to also engage βarr function in this cell background. Because of the small magnitude of internalization by partial agonists, the effects of dominant βarr constructs were not assessed for these ligands. However, all five agonists were tested in BRET (bioluminescence resonance energy transfer) assays to determine their ability to induce βarr2 recruitment. As shown in Fig. 3d, and in keeping with internalization responses, only ligands that induced significant recruitment of βarr2 triggered maximal DOR sequestration.
Fig. 3.
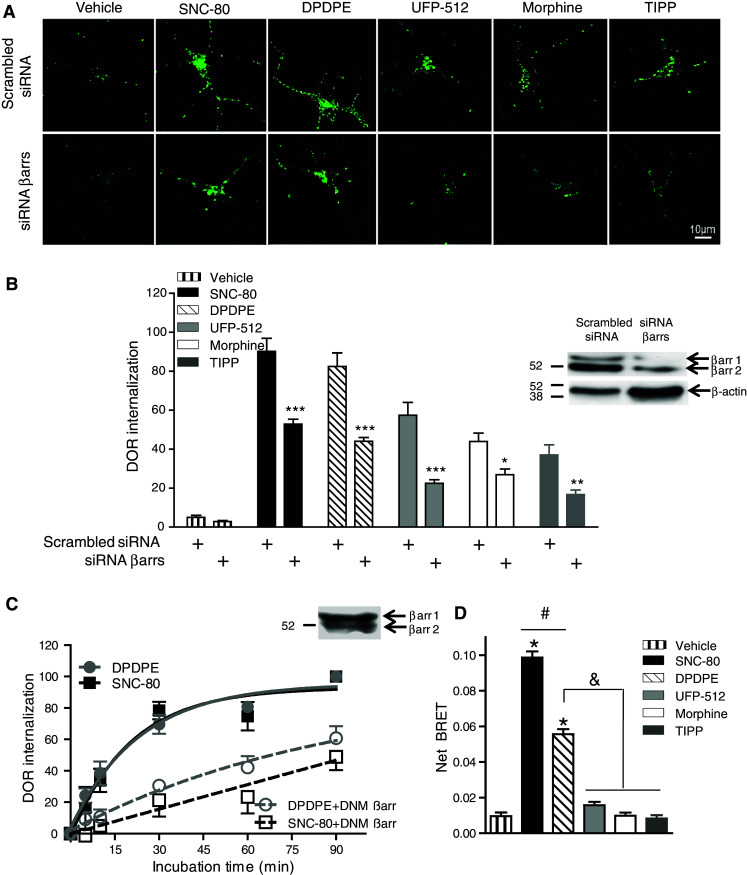
βarrs are involved in DOR internalization in neurons and HEK293 cells. a Mean intracellular immunoreactivity was quantified (b) in neurons transfected with βarr specific or scramble siRNA and treated as above (60 min; n = 4). Two-way ANOVA revealed effect of drug (p < 0.0001), of siRNA (p < 0.0001), and an interaction (p < 0.0001). * p < 0.05; ** p < 0.01; *** p < 0.001 using Bonferroni post hoc tests to compare βarr-siRNA to scramble. Inset shows efficacy of βarr1/2 knock down. c HEK293 were exposed to SNC-80 or DPDPE as indicated, and sequestration expressed as % of receptors present at the membrane before exposure to agonists (n = 4). Two-way ANOVA revealed effect of time (p < 0.0001), DNM-βarr (p < 0.0001) and a time × DNM-βarr interaction (p < 0.0001) for both agonists. Inset shows the presence of both βarr subtypes in HEK293 cells. d BRET measures were taken in HEK293 cells expressing DOR-YFP and βarr2-Luc. Results were expressed as mean ± SEM of net BRET values (n = 10). One-way ANOVA followed by Bonferroni correction revealed: * p < 0.001 as compared to vehicle; # p < 0.001; p < 0.001
βarr recruitment to GPCRs (G protein-coupled receptors) is modulated by phosphorylation [35]. In the case of DORs, GRKs [36–38] and PKCs [30] both enhance βarr-dependent internalization of the receptor. Here we observed that siRNA silencing of neuronal GRK2 reduced intracellular accumulation of immunoreactivity by ~50–70 %, depending on the agonist used (Fig. 4a, b). In contrast, GRK2 silencing had no effect on sequestration triggered by DPDPE or SNC-80 in HEK293 cells (Fig. 4c), although the same kinase was actively involved in the internalization of another GPCR. Indeed, GRK2 participated in 5-HT4 receptor internalization, as indicated by the fact that silencing of this kinase blocked 5-HT4R (5-hydroxytryptamine receptor 4) internalization by its endogenous ligand (membrane 5-HT4 receptors internalized by 5-HT in HEK293 cells + scrambled siRNA: 41.5 ± 0.5 %; in HEK293 cells + GRK2 siRNA: 31.8 ± 1.6; p < 0.01; n = 3).
Fig. 4.

GRK2 is required for DOR internalization in neurons but not in HEK293 cells. a Neuronal expression of GRK2 was silenced by means of siRNA and the day of the experiment internalization was assessed as in previous figures. b Histograms correspond to mean intracellular immunoreactivity quantified in neurons transfected with specific or scrambled siRNA and exposed to different agonists. Results represent mean ± SEM of five independent experiments. Data were analyzed by means of two-way ANOVA, which revealed an effect of drug (p < 0.0001), siRNA (p < 0.0001), and an interaction (p < 0.0001). The significance of the effect of GRK2 silencing on internalization induced by different ligands was assessed by means of Bonferroni post hoc tests. * p < 0.001. Inset shows effectiveness of GRK2 knockdown in neurons. c HEK293 cells stably expressing Flag-DORs were transfected with indicated siRNAs, and internalization measured following incubation with SNC-80 or DPDPE. Results represent mean ± SEM of four independent experiments carried out in triplicate. Two-way ANOVA analysis revealed an effect of time (p < 0.0001) for both agonists. Inset shows effectiveness of GRK2 knockdown in HEK293 cells
PKC contribution to DOR internalization was assessed using chelerythrine as a universal PKC inhibitor [39]. In neurons, chelerythrine (4 μM) reduced internalization by ~40–70 %, and this effect was significant for 10 μM concentrations of all ligands, except morphine (Fig. 5a, b). In HEK293 cells, the same chelerythrine treatment did not modify maximal internalization by SNC-80 or DPDPE (10 μM), although it reduced the sequestration rate of the latter (KCTL 0.08 ± 0.01/min; KCHEL 0.05 ± 0.01; p = 0.011; n = 4; Fig. 5c). To further determine a possible contribution of PKC to DOR internalization in HEK293 cells, dose–response curves for DPDPE and SNC-80 were completed in presence and absence of chelerythrine (4 μM). There was no effect on internalization by DPDPE (Fig. 5d) and a left-shift in the case of SNC-80 (Fig. 5e), implying that inhibition of PKC activity enhanced internalization by this agonist. The reason for this left-shift is not clear, but a possible explanation could be that PKC inhibition could have released DORs from an interaction that interfered with its recognition by “internalizing proteins” such as βarrs. Independent of the reason for the observed shift, the data confirm that inhibition of PKC activity did not block DOR internalization, ratifying that this type of kinase does not actively contribute to DOR sequestration by either agonist in HEK293 cells.
Phosphorylation by GRK2 requires DOR activation by an agonist [40, 41] while PKC produces heterologous phosphorylation of the receptor [30]. However, both mechanisms can influence each other since pre-activation of PKCs may enhance DOR internalization by subsequent agonist stimulation [30]. Data shown above indicated that both types of kinases contributed to DOR sequestration in neurons but not in HEK293 cells, even if GRK2 was present and active in the latter. It was therefore of interest to determine whether enhancing PKC activity in HEK293 cells could recruit additional internalization mechanisms to produce similar magnitude of internalization as in neurons. To evaluate this possibility, HEK293 cells were treated with PMA (phorbol 12-myristate 13-acetate) (500 nM; 60 min) to then assess changes in ligand-induced βarr2 recruitment and internalization. Activation of typical and novel PKC isoforms by the phorbol ester [42, 43] increased βarr2 recruitment (Fig. 6a) and DOR internalization (Fig. 6b), confirming PKC as heterologous modulator of DOR endocytosis. However, increase in internalization was quite modest, particularly for partial agonists, indicating that the neuronal internalization phenotype could not be recreated by simply increasing basal PKC activity levels.
Fig. 6.

PKC activation produced an increase in βarr2 recruitment and DOR internalization in HEK293 cells. a HEK293 cells transiently expressing DOR-YFP and βarr2-Luc were pretreated with PMA (500 nM) for 60 min prior to exposure to the indicated ligands (1 μM) for 5 min and obtaining BRET readings. Results are expressed as mean ± SEM of agonist-induced changes in net BRET and correspond to five independent experiments carried out in triplicate. Data were analyzed by means of two-way ANOVA revealing an effect for PMA (p < 0.0001) and ligands (p < 0.0001). * p < 0.05; ** p < 0.001 using post hoc Bonferroni comparisons. b HEK293 cells stably expressing Flag-DORs were exposed to PMA as above and exposed to different agonists for the indicated periods of time. Internalization was expressed as % of receptors present at the membrane before exposure to agonist and represent mean ± SEM of 4–5 independent experiments carried out in triplicate. Statistical analysis by two-way ANOVA revealed an effect for PMA (p < 0.0001), for ligands (p < 0.0001) and an interaction (p < 0.0001). Post hoc Bonferroni comparisons indicated a significant effect of PMA on each agonist (p < 0.05), except for morphine
Statistical analysis of data obtained in neurons indicated a significant interaction between the magnitude of sequestration promoted by each ligand and the extent to which βarr, GRK2, and PKC contributed to agonist-promoted internalization (Figs. 3b, 4b, and 5b). The presence of this interaction implies that agonists differ in their ability to engage the different regulatory proteins. To better appreciate these differences, we calculated the percentage of maximal agonist-induced internalization that could be blocked by silencing the function of βarr, GRK2 and PKC. The results of these calculations are shown in Fig. 7, where it can be appreciated that GRK2 contribution to DOR internalization was not different among ligands (Fig. 7a), while a greater proportion of the internalization produced by UFP-512 relied on PKC as compared to morphine (Fig. 7b). Ligands also differed in their ability to engage βarr-mediated internalization, with UFP-512 being more effective than DPDPE, and TIPP more so than morphine (Fig. 7c). Rank order of ligand ability to engage the different responses were compared among themselves and to E max values obtained in cAMP assays (Fig. 7d). A significant reversal in rank order was only observed for cyclase E max in HEK cells as compared to ligand ability to engage βarr-dependent internalization in neurons. Although this observation does not exclude possible ligand-specific responses for GRK2 or PKC, the data are consistent with the notion that cAMP inhibition in HEK cells and βarr-mediated internalization in neurons are mediated by distinct receptor states.
Fig. 7.

Ligand rank order is not conserved for cAMP E max values and βarr-dependent internalization in neurons. The proportion of ligand-induced DOR internalization that was blocked by interfering with the activity of neuronal βarr, PKC or GRK2 was calculated to establish the following rank orders: a ligand ability to engage GRK-2-dependent internalization (n = 5), b ligand ability to engage PKC-dependent internalization (n = 4), and c βarr-dependent-internalization (n = 4). Results are expressed as mean ± SEM of the percentage of internalization blocked by interfering with the activity of each of the regulatory proteins. Data were analyzed by means of one-way ANOVA with Bonferroni correction for multiple comparisons and results appear in the figure. d Rank order or ligand E max values in cyclase assays (n = 7–9). Results are expressed as in Tables 1 and 2, which also show details of statistical comparisons
Discussion
Results obtained in this study revealed a measurable bias in the efficiency with which DOR agonists engaged cyclase versus internalization responses in HEK293 cells. The data also indicated that molecular determinants of DOR sequestration were different in HEK cells and neurons, and comparison of maximal responses showed that cyclase inhibition in HEK cells and βarr-dependent internalization in neurons did not follow the same rank order, implying that these effects were agonist-specific.
Numerous studies have established that DORs may adopt different active conformations [44, 45], which differ in their signaling and regulatory properties [8, 14, 46]. The challenge now is to determine whether these functional differences may be exploited for therapeutic purposes. Answering this question requires not only the identification of novel, functionally selective molecules but also the ability to accurately quantify bias among different responses. Such a requirement has prompted the development of novel analytical tools (reviewed by Kenakin and Christopoulos [13]), several of which share the operational model of Black and Leff [22] as a common basis. However, the different methods for calculating bias make distinct assumptions with respect to the way the ligand, the receptor, and its signaling partners influence each other [12, 13, 47]. One of the methods assumes that: (1) conformations stabilized by different ligands may distinctively recognize/activate specific intracellular signaling partners and (2) interaction of the receptor with different signaling proteins may distinctively modify its affinity for different agonists [12, 13]. An alternative quantification approach also admits that ligand-specific conformations may distinctively engage different signaling partners, but assumes independence between ligand affinity for the receptor and receptor association with cellular proteins that support different signals [47]. In keeping with this assumption, the latter method provides the operational model with fixed affinity values and only uses operational efficacies to measure whether a ligand displays bias in producing two responses [47]. Such an approach has been successfully applied to reveal a significant bias in endomorphin-2’s efficacy to induce G protein activation versus βarr2 recruitment [48]. In the present study, we opted for the model which allows ligand affinity for the receptor to be influenced by its signaling partner(s) [13]. As a consequence, “functional affinity” or KA values were calculated as one of the parameters of the dose–response curve, yielding an estimate of the agonist’s affinity to bind receptor conformation(s) mediating each of the responses. The values obtained indicated that KAcAMP for DPDPE, SNC-80, UFP-512, and TIPP were lower than corresponding KAintern values (Supplementary Table 1), implying that these ligands would better recognize the receptor complex that is responsible for cyclase modulation than the one in which the receptor is associated with cellular mediators of internalization. Actually, when cyclase and internalization data for the different agonists were assumed to share a fixed affinity value for both responses, only cyclase data points could be reasonably fit by the model (Supplementary Fig. 2), confirming that a single affinity state could not account for functional responses assessed in this study. The aspect of ligand diversity that is captured by allowing the receptor to adopt distinct ligand affinities for different responses was incorporated into the calculation of bias by comparing transduction coefficients (τ/KA) instead of operational affinities for each of the functional readouts.
Comparison of normalized transduction coefficients for cAMP inhibition and DOR internalization in HEK293 cells showed that SNC-80 and UFP-512 displayed a significant bias towards cyclase signaling as compared to DPDPE. The fact that UFP-512 was more efficient in inhibiting cAMP production than inducing internalization confirms the notion that some partial agonists at opioid receptors may display signaling versus internalization bias [49, 50]. Perhaps more surprising was the fact that SNC-80 was also found to display similar bias as the partial agonist. In fact, when compared to ARM100390, SNC-80 had been characterized as a functionally selective ligand which preferentially induces internalization over signaling [7]. Different reasons could explain divergent observations between the two reports. First, the signaling response monitored in each of the studies was different, focusing on GTPS binding in one study and cyclase modulation in the other. Second, the two reports compared SNC-80 to different standards, namely ARM100390 and DPDPE. Third, quantification of internalization was different, relying on kinetic parameters in one study [7] and endpoint measurements in the other. Finally, cellular backgrounds used in both studies were different, with the present study measuring bias in HEK293 cells and that of Pradhan et al. [7] monitoring responses in brain tissue and cultured neurons.
Evidence presented herein indicates that neither the magnitude of maximal internalization by partial agonists nor the signals mediating ligand-induced internalization were conserved across cellular backgrounds. Indeed, although βarr implication was a common element in HEK293 cells and neurons, PKC and GRK2 contributed to ligand internalization capacity only in neurons. Since GRK2 was present and active in the sequestration of another HEK293-expressed receptor, it is possible that key determinants for its participation in DOR internalization were either absent or occluded in this cellular background. Hence, if bias is considered the result of distinct interactions between ligand-specific receptor conformations and cellular proteins that determine response [51–53], the very existence of internalization signals that are present in neurons and not in HEK cells would imply that bias described for one cell type need not persist in another. This limitation is not necessarily exclusive to heterologous systems versus neurons, since molecular determinants of internalization need neither be the same across all neuronal populations expressing opioid receptors [7, 33].
Ligand ability to stabilize/recognize distinct receptor conformations constitutes the molecular basis of bias [24, 51]. As heterologous DOR regulators, PKCs phosphorylate the receptor at a fixed residue (Ser344-independent), regardless of its occupancy [30]. As such, PKCs would not be expected to translate ligand-dependent conformational diversity into ligand-specific responses. On the other hand, GRK2 is recruited to agonist-occupied receptors [41, 54] where it may discriminate ligand-specific receptor states [55] and establish phosphorylation patterns [56] that transfer this diversity to downstream internalization such as βarrs [57, 58]. GRK2 contribution to maximal internalization in neurons did not differ among agonists, preventing us from establishing a distinct rank order in ligand ability to engage this mechanism. On the other hand, ligand rank order to promote βarr-dependent internalization and cAMP inhibition were reversed for DPDPE and UFP-512 as well as for morphine and TIPP. These differences cannot be simply explained by saturation of maximal responses or by differential amplification. Thus, despite the fact that they do not provide a quantitative estimation of bias, they are indicative of ligand-specific ability to modulate cyclase versus DOR internalization in neurons.
In summary, we have provided quantitative evidence that DOR agonists may display signaling versus internalization bias, and demonstrated that this type of functional selectivity is present in full and partial agonists. We have also shown that DOR internalization mechanisms are cell-dependent and established that βarr-dependent internalization in neurons and inhibition of cAMP production were ligand-specific.
Electronic supplementary material
Below is the link to the electronic supplementary material.
Supplementary material 1 (PDF 53 kb) Supplementary Fig. 1. Time course of DOR internalization in HEK cells. HEK293 cells stably expressing Flag-DORs were exposed to different agonists (10 μM) for the indicated time periods. Internalization was expressed as % of receptors present at the membrane before exposure to agonist and represent mean ± SEM of 10 independent experiments carried out in triplicate. Statistical analysis by two way ANOVA revealed an effect for drug (p < 0.0001), for time (p < 0.0001) and an interaction (p < 0.0001). Post-hoc Bonferroni comparisons indicated a significant effect of time for all drugs (p < 0.01), except morphine
Supplementary material 1 (PDF 53 kb) Supplementary Fig. 2. A single affinity state could not account for cyclase and internalization responses of DOR agonists. (A) cAMP accumulation and (B) DOR internalization data were fit with the operational model as described in the methodology section, except that KA values for the agonists were fixed from published references as follows: KASNC-80: 5,75 nM; KAUFP512: 100 pM; KAMOR: 213.80 nM; KATIPP: 1.29 nM and KADPDPE: 12.02 nM
Acknowledgments
This work was supported by grants from the Natural Sciences and Engineering Research Council of Canada (NSERC) to GP [311997]; from the Canadian Institutes of Health Research (CIHR) to GP [MOP 79432], PWS [MOP 89716] and LET [MOP-106556]. PWS was also supported by the National Institutes of Health (NIH) [DA004443]. IC and KN hold a studentship from Ste-Justine Hospital Research Center and DT held a CIHR salary award. The authors would also like to thank Dr. Arthur Christopoulos for his insightful and helpful comments on curve fitting using the operational model.
Abbreviations
- PBS
Phosphate-buffered saline
- BSA
Bovine serum albumin
- DOR
D-opioid receptor
- DPDPE
[d-Pen(2), d-Pen(5)]-enkephalin
- SNC-80
(1)-4-[(αR)-α-((2S,5R)-4-Allyl-2,5-dimethyl-1-piperazinyl)-3- methoxybenzyl]-N,N-diethylbenzamide
- TIPP
H-Tyr-Tic-Phe-Phe-OH
- UFP-512
H-Dmt-Tic-NH-CH(CH2-COOH)-Bid
- Emax
Maximal effect
- GPCR
G protein-coupled receptor
- HEK
Human embryonic kidney
- PKC
Protein kinase C
- GRK
G protein-coupled receptor kinase
- βarr
βarrestin
- ARM390
AR-M100390
- ADL5859
N,N-diethyl-4-(5-hydroxyspiro[chromene-2,4′-piperidine]-4-yl) benzamide
- ADL5747
N,N-diethyl-3-hydroxy-4-(spiro[chromene-2,4′-piperidine]-4-yl) benzamide
- cAMP
Cyclic adenosine monophosphate
- EC50
Term half maximal effective concentration
- BRET
Bioluminescence resonance energy transfer
- 5-HT4R
5-Hydroxytryptamine receptor 4
- PMA
Phorbol 12-myristate 13-acetate
References
- 1.Dworkin RH. Introduction: recommendations for the diagnosis, assessment, and treatment of neuropathic pain. Am J Med. 2009;122(10 Suppl):S1–S2. doi: 10.1016/j.amjmed.2009.04.004. [DOI] [PubMed] [Google Scholar]
- 2.Gaveriaux-Ruff C, Nozaki C, Nadal X, Hever XC, Weibel R, Matifas A, Reiss D, Filliol D, Nassar MA, Wood JN, Maldonado R, Kieffer BL. Genetic ablation of delta opioid receptors in nociceptive sensory neurons increases chronic pain and abolishes opioid analgesia. Pain. 2011;152(6):1238–1248. doi: 10.1016/j.pain.2010.12.031. [DOI] [PubMed] [Google Scholar]
- 3.Fraser GL, Gaudreau GA, Clarke PB, Menard DP, Perkins MN. Antihyperalgesic effects of delta opioid agonists in a rat model of chronic inflammation. Br J Pharmacol. 2000;129(8):1668–1672. doi: 10.1038/sj.bjp.0703248. [DOI] [PMC free article] [PubMed] [Google Scholar]
- 4.Cahill CM, Morinville A, Hoffert C, O’Donnell D, Beaudet A. Up-regulation and trafficking of delta opioid receptor in a model of chronic inflammation: implications for pain control. Pain. 2003;101(1–2):199–208. doi: 10.1016/S0304-3959(02)00333-0. [DOI] [PubMed] [Google Scholar]
- 5.Nagi K, Pineyro G. Regulation of opioid receptor signalling: implications for the development of analgesic tolerance. Mol Brain. 2011;4:25. doi: 10.1186/1756-6606-4-25. [DOI] [PMC free article] [PubMed] [Google Scholar]
- 6.Gaveriaux-Ruff C, Kieffer BL. Delta opioid receptor analgesia: recent contributions from pharmacology and molecular approaches. Behav Pharmacol. 2011;22(5–6):405–414. doi: 10.1097/FBP.0b013e32834a1f2c. [DOI] [PMC free article] [PubMed] [Google Scholar]
- 7.Pradhan AA, Becker JA, Scherrer G, Tryoen-Toth P, Filliol D, Matifas A, Massotte D, Gaveriaux-Ruff C, Kieffer BL. In vivo delta opioid receptor internalization controls behavioral effects of agonists. PLoS ONE. 2009;4(5):e5425. doi: 10.1371/journal.pone.0005425. [DOI] [PMC free article] [PubMed] [Google Scholar]
- 8.Audet N, Charfi I, Mnie-Filali O, Amraei M, Chabot-Dore AJ, Millecamps M, Stone LS, Pineyro G. Differential association of receptor-Gbetagamma complexes with beta-arrestin2 determines recycling bias and potential for tolerance of delta opioid receptor agonists. J Neurosci. 2012;32(14):4827–4840. doi: 10.1523/JNEUROSCI.3734-11.2012. [DOI] [PMC free article] [PubMed] [Google Scholar]
- 9.Pradhan AA, Befort K, Nozaki C, Gaveriaux-Ruff C, Kieffer BL. The delta opioid receptor: an evolving target for the treatment of brain disorders. Trends Pharmacol Sci. 2011;32(10):581–590. doi: 10.1016/j.tips.2011.06.008. [DOI] [PMC free article] [PubMed] [Google Scholar]
- 10.Nozaki C, Le Bourdonnec B, Reiss D, Windh RT, Little PJ, Dolle RE, Kieffer BL, Gaveriaux-Ruff C. Delta-opioid mechanisms for ADL5747 and ADL5859 effects in mice: analgesia, locomotion, and receptor internalization. J Pharmacol Exp Ther. 2012;342(3):799–807. doi: 10.1124/jpet.111.188987. [DOI] [PMC free article] [PubMed] [Google Scholar]
- 11.Marie N, Landemore G, Debout C, Jauzac P, Allouche S. Pharmacological characterization of AR-M1000390 at human delta opioid receptors. Life Sci. 2003;73(13):1691–1704. doi: 10.1016/S0024-3205(03)00489-2. [DOI] [PubMed] [Google Scholar]
- 12.Kenakin T, Watson C, Muniz-Medina V, Christopoulos A, Novick S. A simple method for quantifying functional selectivity and agonist bias. ACS Chem Neurosci. 2012;3(3):193–203. doi: 10.1021/cn200111m. [DOI] [PMC free article] [PubMed] [Google Scholar]
- 13.Kenakin T, Christopoulos A. Signalling bias in new drug discovery: detection, quantification and therapeutic impact. Nat Rev Drug Discov. 2013;12(3):205–216. doi: 10.1038/nrd3954. [DOI] [PubMed] [Google Scholar]
- 14.Audet N, Paquin-Gobeil M, Landry-Paquet O, Schiller PW, Pineyro G. Internalization and SRC activity regulate the time course of ERK activation by delta opioid receptor ligands. J Biol Chem. 2005;280(9):7808–7816. doi: 10.1074/jbc.M411695200. [DOI] [PubMed] [Google Scholar]
- 15.Archer-Lahlou E, Audet N, Amraei MG, Huard K, Paquin-Gobeil M, Pineyro G. Src promotes delta opioid receptor (DOR) desensitization by interfering with receptor recycling. J Cell Mol Med. 2009;13(1):147–163. doi: 10.1111/j.1582-4934.2008.00308.x. [DOI] [PMC free article] [PubMed] [Google Scholar]
- 16.Krupnick JG, Santini F, Gagnon AW, Keen JH, Benovic JL. Modulation of the arrestin-clathrin interaction in cells. Characterization of beta-arrestin dominant-negative mutants. J Biol Chem. 1997;272(51):32507–32512. doi: 10.1074/jbc.272.51.32507. [DOI] [PubMed] [Google Scholar]
- 17.Fasano C, Thibault D, Trudeau LE. Culture of postnatal mesencephalic dopamine neurons on an astrocyte monolayer. Curr Protoc Neurosci. 2008;Chapter 3:Unit 3.21. doi: 10.1002/0471142301.ns0321s44. [DOI] [PubMed] [Google Scholar]
- 18.Shieh PB, Hu SC, Bobb K, Timmusk T, Ghosh A. Identification of a signaling pathway involved in calcium regulation of BDNF expression. Neuron. 1998;20(4):727–740. doi: 10.1016/S0896-6273(00)81011-9. [DOI] [PubMed] [Google Scholar]
- 19.Thibault D, Albert PR, Pineyro G, Trudeau LE. Neurotensin triggers dopamine D2 receptor desensitization through a protein kinase C and beta-arrestin1-dependent mechanism. J Biol Chem. 2011;286(11):9174–9184. doi: 10.1074/jbc.M110.166454. [DOI] [PMC free article] [PubMed] [Google Scholar]
- 20.Vargas GA, Von Zastrow M. Identification of a novel endocytic recycling signal in the D1 dopamine receptor. J Biol Chem. 2004;279(36):37461–37469. doi: 10.1074/jbc.M401034200. [DOI] [PubMed] [Google Scholar]
- 21.Pineyro G, Azzi M, deLean A, Schiller PW, Bouvier M. Reciprocal regulation of agonist and inverse agonist signaling efficacy upon short-term treatment of the human delta-opioid receptor with an inverse agonist. Mol Pharmacol. 2005;67(1):336–348. doi: 10.1124/mol.104.004549. [DOI] [PubMed] [Google Scholar]
- 22.Black JW, Leff P. Operational models of pharmacological agonism. Proc R Soc Lond B Biol Sci. 1983;220(1219):141–162. doi: 10.1098/rspb.1983.0093. [DOI] [PubMed] [Google Scholar]
- 23.Gregory KJ, Sexton PM, Tobin AB, Christopoulos A. Stimulus bias provides evidence for conformational constraints in the structure of a G protein-coupled receptor. J Biol Chem. 2012;287(44):37066–37077. doi: 10.1074/jbc.M112.408534. [DOI] [PMC free article] [PubMed] [Google Scholar]
- 24.Pineyro G, Archer-Lahlou E. Ligand-specific receptor states: implications for opiate receptor signalling and regulation. Cell Signal. 2007;19(1):8–19. doi: 10.1016/j.cellsig.2006.05.026. [DOI] [PubMed] [Google Scholar]
- 25.Molinari P, Vezzi V, Sbraccia M, Gro C, Riitano D, Ambrosio C, Casella I, Costa T. Morphine-like opiates selectively antagonize receptor-arrestin interactions. J Biol Chem. 2010;285(17):12522–12535. doi: 10.1074/jbc.M109.059410. [DOI] [PMC free article] [PubMed] [Google Scholar]
- 26.Groer CE, Schmid CL, Jaeger AM, Bohn LM. Agonist-directed interactions with specific beta-arrestins determine mu-opioid receptor trafficking, ubiquitination, and dephosphorylation. J Biol Chem. 2011;286(36):31731–31741. doi: 10.1074/jbc.M111.248310. [DOI] [PMC free article] [PubMed] [Google Scholar]
- 27.Stephenson RP. A modification of receptor theory. Br J Pharmacol Chemother. 1956;11(4):379–393. doi: 10.1111/j.1476-5381.1956.tb00006.x. [DOI] [PMC free article] [PubMed] [Google Scholar]
- 28.Zhang X, Wang F, Chen X, Chen Y, Ma L. Post-endocytic fates of delta-opioid receptor are regulated by GRK2-mediated receptor phosphorylation and distinct beta-arrestin isoforms. J Neurochem. 2008;106(2):781–792. doi: 10.1111/j.1471-4159.2008.05431.x. [DOI] [PubMed] [Google Scholar]
- 29.Liu JG, Anand KJ. Protein kinases modulate the cellular adaptations associated with opioid tolerance and dependence. Brain Res Brain Res Rev. 2001;38(1–2):1–19. doi: 10.1016/S0165-0173(01)00057-1. [DOI] [PubMed] [Google Scholar]
- 30.Xiang B, Yu GH, Guo J, Chen L, Hu W, Pei G, Ma L. Heterologous activation of protein kinase C stimulates phosphorylation of delta-opioid receptor at serine 344, resulting in beta-arrestin- and clathrin-mediated receptor internalization. J Biol Chem. 2001;276(7):4709–4716. doi: 10.1074/jbc.M006187200. [DOI] [PubMed] [Google Scholar]
- 31.Marie N, Aguila B, Allouche S. Tracking the opioid receptors on the way of desensitization. Cell Signal. 2006;18(11):1815–1833. doi: 10.1016/j.cellsig.2006.03.015. [DOI] [PubMed] [Google Scholar]
- 32.Qiu Y, Loh HH, Law PY. Phosphorylation of the delta-opioid receptor regulates its beta-arrestins selectivity and subsequent receptor internalization and adenylyl cyclase desensitization. J Biol Chem. 2007;282(31):22315–22323. doi: 10.1074/jbc.M611258200. [DOI] [PubMed] [Google Scholar]
- 33.Raehal KM, Schmid CL, Groer CE, Bohn LM. Functional selectivity at the mu-opioid receptor: implications for understanding opioid analgesia and tolerance. Pharmacol Rev. 2011;63(4):1001–1019. doi: 10.1124/pr.111.004598. [DOI] [PMC free article] [PubMed] [Google Scholar]
- 34.Schmid CL, Bohn LM. Physiological and pharmacological implications of beta-arrestin regulation. Pharmacol Ther. 2009;121(3):285–293. doi: 10.1016/j.pharmthera.2008.11.005. [DOI] [PMC free article] [PubMed] [Google Scholar]
- 35.Gurevich VV, Gurevich EV. Custom-designed proteins as novel therapeutic tools? The case of arrestins. Expert Rev Mol Med. 2010;12:e13. doi: 10.1017/S1462399410001444. [DOI] [PMC free article] [PubMed] [Google Scholar]
- 36.Hasbi A, Allouche S, Sichel F, Stanasila L, Massotte D, Landemore G, Polastron J, Jauzac P. Internalization and recycling of delta-opioid receptor are dependent on a phosphorylation-dephosphorylation mechanism. J Pharmacol Exp Ther. 2000;293(1):237–247. [PubMed] [Google Scholar]
- 37.Trapaidze N, Keith DE, Cvejic S, Evans CJ, Devi LA. Sequestration of the delta opioid receptor. Role of the C terminus in agonist-mediated internalization. J Biol Chem. 1996;271(46):29279–29285. doi: 10.1074/jbc.271.46.29279. [DOI] [PMC free article] [PubMed] [Google Scholar]
- 38.Zhang J, Ferguson SS, Law PY, Barak LS, Caron MG. Agonist-specific regulation of delta-opioid receptor trafficking by G protein-coupled receptor kinase and beta-arrestin. J Recept Signal Transduct Res. 1999;19(1–4):301–313. doi: 10.3109/10799899909036653. [DOI] [PubMed] [Google Scholar]
- 39.Herbert JM, Augereau JM, Gleye J, Maffrand JP. Chelerythrine is a potent and specific inhibitor of protein kinase C. Biochem Biophys Res Commun. 1990;172(3):993–999. doi: 10.1016/0006-291X(90)91544-3. [DOI] [PubMed] [Google Scholar]
- 40.Bradbury FA, Zelnik JC, Traynor JR. G protein-independent phosphorylation and internalization of the delta-opioid receptor. J Neurochem. 2009;109(5):1526–1535. doi: 10.1111/j.1471-4159.2009.06082.x. [DOI] [PMC free article] [PubMed] [Google Scholar]
- 41.Li J, Xiang B, Su W, Zhang X, Huang Y, Ma L. Agonist-induced formation of opioid receptor-G protein-coupled receptor kinase (GRK)-G beta gamma complex on membrane is required for GRK2 function in vivo. J Biol Chem. 2003;278(32):30219–30226. doi: 10.1074/jbc.M302385200. [DOI] [PubMed] [Google Scholar]
- 42.Wang JP, Raung SL, Tsao LT, Hsu MF, Lin CN. Blockade of protein kinase C is involved in the inhibition by cycloheterophyllin of neutrophil superoxide anion generation. Naunyn Schmiedebergs Arch Pharmacol. 1997;355(5):551–558. doi: 10.1007/PL00004982. [DOI] [PubMed] [Google Scholar]
- 43.Castagna M, Takai Y, Kaibuchi K, Sano K, Kikkawa U, Nishizuka Y. Direct activation of calcium-activated, phospholipid-dependent protein kinase by tumor-promoting phorbol esters. J Biol Chem. 1982;257(13):7847–7851. [PubMed] [Google Scholar]
- 44.Salamon Z, Hruby VJ, Tollin G, Cowell S. Binding of agonists, antagonists and inverse agonists to the human delta-opioid receptor produces distinctly different conformational states distinguishable by plasmon-waveguide resonance spectroscopy. J Pept Res. 2002;60(6):322–328. doi: 10.1034/j.1399-3011.2002.21060.x. [DOI] [PubMed] [Google Scholar]
- 45.Audet N, Gales C, Archer-Lahlou E, Vallieres M, Schiller PW, Bouvier M, Pineyro G. Bioluminescence resonance energy transfer assays reveal ligand-specific conformational changes within preformed signaling complexes containing delta-opioid receptors and heterotrimeric G proteins. J Biol Chem. 2008;283(22):15078–15088. doi: 10.1074/jbc.M707941200. [DOI] [PMC free article] [PubMed] [Google Scholar]
- 46.Xu C, Hong MH, Zhang LS, Hou YY, Wang YH, Wang FF, Chen YJ, Xu XJ, Chen J, Xie X, Ma L, Chi ZQ, Liu JG. Serine 363 of the {delta}-opioid receptor is crucial for adopting distinct pathways to activate ERK1/2 in response to stimulation with different ligands. J Cell Sci. 2010;123(Pt 24):4259–4270. doi: 10.1242/jcs.073742. [DOI] [PubMed] [Google Scholar]
- 47.Rajagopal S, Ahn S, Rominger DH, Gowen-MacDonald W, Lam CM, Dewire SM, Violin JD, Lefkowitz RJ. Quantifying ligand bias at seven-transmembrane receptors. Mol Pharmacol. 2011;80(3):367–377. doi: 10.1124/mol.111.072801. [DOI] [PMC free article] [PubMed] [Google Scholar]
- 48.Rivero G, Llorente J, McPherson J, Cooke A, Mundell SJ, McArdle CA, Rosethorne EM, Charlton SJ, Krasel C, Bailey CP, Henderson G, Kelly E. Endomorphin-2: a biased agonist at the mu-opioid receptor. Mol Pharmacol. 2012;82(2):178–188. doi: 10.1124/mol.112.078659. [DOI] [PMC free article] [PubMed] [Google Scholar]
- 49.Martini L, Whistler JL. The role of mu opioid receptor desensitization and endocytosis in morphine tolerance and dependence. Curr Opin Neurobiol. 2007;17(5):556–564. doi: 10.1016/j.conb.2007.10.004. [DOI] [PubMed] [Google Scholar]
- 50.Alvarez VA, Arttamangkul S, Dang V, Salem A, Whistler JL, Von Zastrow M, Grandy DK, Williams JT. Mu-Opioid receptors: ligand-dependent activation of potassium conductance, desensitization, and internalization. J Neurosci. 2002;22(13):5769–5776. doi: 10.1523/JNEUROSCI.22-13-05769.2002. [DOI] [PMC free article] [PubMed] [Google Scholar]
- 51.Kenakin T. Functional selectivity through protean and biased agonism: who steers the ship? Mol Pharmacol. 2007;72(6):1393–1401. doi: 10.1124/mol.107.040352. [DOI] [PubMed] [Google Scholar]
- 52.Kenakin TP. Biased signalling and allosteric machines: new vistas and challenges for drug discovery. Br J Pharmacol. 2012;165(6):1659–1669. doi: 10.1111/j.1476-5381.2011.01749.x. [DOI] [PMC free article] [PubMed] [Google Scholar]
- 53.Urban JD, Clarke WP, von Zastrow M, Nichols DE, Kobilka B, Weinstein H, Javitch JA, Roth BL, Christopoulos A, Sexton PM, Miller KJ, Spedding M, Mailman RB. Functional selectivity and classical concepts of quantitative pharmacology. J Pharmacol Exp Ther. 2007;320(1):1–13. doi: 10.1124/jpet.106.104463. [DOI] [PubMed] [Google Scholar]
- 54.Breton B, Lagace M, Bouvier M. Combining resonance energy transfer methods reveals a complex between the alpha2A-adrenergic receptor, Galphai1beta1gamma2, and GRK2. FASEB J. 2010;24(12):4733–4743. doi: 10.1096/fj.10-164061. [DOI] [PubMed] [Google Scholar]
- 55.Zimmerman B, Beautrait A, Aguila B, Charles R, Escher E, Claing A, Bouvier M, Laporte SA. Differential beta-arrestin-dependent conformational signalling and cellular responses revealed by angiotensin analogs. Sci Signal. 2012;5(221):ra33. doi: 10.1126/scisignal.2002522. [DOI] [PubMed] [Google Scholar]
- 56.Okura T, Varga EV, Hosohata Y, Navratilova E, Cowell SM, Rice K, Nagase H, Hruby VJ, Roeske WR, Yamamura HI. Agonist-specific down-regulation of the human delta-opioid receptor. Eur J Pharmacol. 2003;459(1):9–16. doi: 10.1016/S0014-2999(02)02823-6. [DOI] [PubMed] [Google Scholar]
- 57.Tarrant TK, Rampersad RR, Esserman D, Rothlein LR, Liu P, Premont RT, Lefkowitz RJ, Lee DM, Patel DD. Granulocyte chemotaxis and disease expression are differentially regulated by GRK subtype in an acute inflammatory arthritis model (K/BxN) Clin Immunol. 2008;129(1):115–122. doi: 10.1016/j.clim.2008.06.008. [DOI] [PMC free article] [PubMed] [Google Scholar]
- 58.Busillo JM, Armando S, Sengupta R, Meucci O, Bouvier M, Benovic JL. Site-specific phosphorylation of CXCR4 is dynamically regulated by multiple kinases and results in differential modulation of CXCR4 signaling. J Biol Chem. 2010;285(10):7805–7817. doi: 10.1074/jbc.M109.091173. [DOI] [PMC free article] [PubMed] [Google Scholar]
Associated Data
This section collects any data citations, data availability statements, or supplementary materials included in this article.
Supplementary Materials
Supplementary material 1 (PDF 53 kb) Supplementary Fig. 1. Time course of DOR internalization in HEK cells. HEK293 cells stably expressing Flag-DORs were exposed to different agonists (10 μM) for the indicated time periods. Internalization was expressed as % of receptors present at the membrane before exposure to agonist and represent mean ± SEM of 10 independent experiments carried out in triplicate. Statistical analysis by two way ANOVA revealed an effect for drug (p < 0.0001), for time (p < 0.0001) and an interaction (p < 0.0001). Post-hoc Bonferroni comparisons indicated a significant effect of time for all drugs (p < 0.01), except morphine
Supplementary material 1 (PDF 53 kb) Supplementary Fig. 2. A single affinity state could not account for cyclase and internalization responses of DOR agonists. (A) cAMP accumulation and (B) DOR internalization data were fit with the operational model as described in the methodology section, except that KA values for the agonists were fixed from published references as follows: KASNC-80: 5,75 nM; KAUFP512: 100 pM; KAMOR: 213.80 nM; KATIPP: 1.29 nM and KADPDPE: 12.02 nM