Abstract
Background
Blood pressure (BP) responses to dietary sodium and potassium intervention and cold pressor test (CPT) vary considerably among individuals. We aimed to identify novel genetic variants influencing individuals’ BP responses to dietary intervention and CPT.
Methods and Results
We conducted a genome-wide association study of BP responses in 1,881 Han Chinese and de novo genotyped top findings in 698 Han Chinese. Diet-feeding study included a 7-day low-sodium (51.3 mmol/day), a 7-day high-sodium (307.8 mmol/day), and a 7-day high-sodium plus potassium-supplementation (60 mmol/day). Nine BP measurements were obtained during baseline observation and each intervention period. The meta-analyses identified eight novel loci for BP phenotypes, which physically mapped in or near PRMT6 (P=7.29×10⁻⁹), CDCA7 (P=3.57×10⁻⁸), PIBF1 (P=1.78×10⁻⁹), ARL4C (P=1.86×10⁻⁸), IRAK1BP1 (P=1.44×10⁻¹⁰), SALL1 (P=7.01×10⁻¹³), TRPM8 (P=2.68×10⁻⁸), and FBXL13 (P=3.74×10⁻⁹). There was a strong dose-response relationship between the number of risk alleles of these independent SNPs and the risk of developing hypertension over 7.5-year follow-up in the study participants. Compared to those in the lowest quartile of risk alleles, odds ratios (95% confidence intervals) for those in the second, third and fourth quartiles were 1.39 (0.97, 1.99), 1.72 (1.19, 2.47), and 1.84 (1.29, 2.62), respectively (P=0.0003 for trend).
Conclusions
Our study identified 8 novel loci for BP responses to dietary sodium and potassium intervention and CPT. The effect size of these novel loci on BP phenotypes are much larger than those reported by the previously published studies. Furthermore, these variants predict the risk of developing hypertension among individuals with normal BP at baseline.
Keywords: blood pressure, genomics, sodium, potassium
High blood pressure (HBP) is a global public-health challenge because of its high prevalence and related risk of cardiovascular disease (CVD) and premature death.1,2 BP is influenced by multiple environmental and genetic determinants, as well as their interactions. Among environmental factors, dietary sodium and potassium intake is the most common and important risk factor for HBP.3 However, BP responses to dietary sodium and potassium intake vary considerably among individuals and genetic factors might play an important role in BP salt-sensitivity.4,5
BP response to cold pressor test (CPT), a phenotype which characterizes sympathetic function, has been documented to predict the future risk of hypertension in normotensive persons.6 BP response to CPT has also been associated with salt-sensitivity of BP.7 Twin studies and pedigree studies have suggested that BP response to CPT has strong genetic determinants.8
The recent meta-analyses of genome-wide association studies (GWAS) have identified multiple novel loci influencing usual BP levels and risk of hypertension.9–13 In general, the effect sizes of these common genetic variants on BP are small and explain only a small proportion of BP variation. The GWAS of intermediate BP phenotypes may identify novel genetic variants with larger effect sizes and reveal new biological pathways of BP regulation. We report top findings from GWAS of BP responses to dietary sodium and potassium interventions and CPT in the Genetic Epidemiology of Salt Sensitivity (GenSalt) study and findings from the meta-analysis of the GenSalt and GenSalt-replication studies.
Methods
Study populations
The GenSalt study was conducted in a Han Chinese population in rural north China during 2003–05.14 Details of the study participants and methods are summarized in the Supplementary Appendix available with the full text of this article at circgenetics.ahajournals.org. In brief, 1,906 participants were recruited for the GenSalt dietary intervention and 1,881 of them had GWAS data. Among those with GWAS data, 1,850 (98.4%), 1,840 (97.8%) and 1,836 (97.6%) completed the low-sodium, high-sodium, and potassium-supplementation interventions, respectively. The GenSalt-replication study was conducted in rural north China in 2010 using the identical eligibility criteria, intervention protocol, and data collection methods. Among the 698 eligible participants, 666 (95.4%), 659 (94.4%), and 654 (93.7%) completed the low-sodium, high-sodium, and potassium-supplementation interventions, respectively.15
Institutional review boards or ethics committees at all participating institutes approved the study protocol. Written informed consent was obtained from each participant for the screening visit and for the main study (data collection and intervention).
Interventions
The GenSalt and GenSalt-replication study participants received a consecutive 3-week dietary intervention, which included a 7-day low-sodium diet (3 gram salt or 51.3 mmol sodium/day), a 7-day high-sodium diet (18 gram salt or 307.8 mmol sodium/day), and a 7-day high-sodium diet plus potassium-supplementation (60 mmol potassium/day). The results from three timed urinary specimens at baseline and during the last 3 days of each intervention showed excellent compliance with the study diet. The mean (SD) of 24-hour urinary excretions of sodium and potassium were 242.4 (66.7) mmol and 36.9 (9.6) mmol at baseline, 47.5 (16.0) and 31.4 (7.7) during low-sodium intervention, 244.3 (37.7) and 35.7 (7.5) during high-sodium intervention, and 251.9 (36.9) and 77.3 (12.6) during high-sodium plus potassium-supplementation intervention, respectively.
CPT was conducted at baseline examination. After the participant had remained seated for 20 minutes, three BP measurements were obtained using a standard mercury sphygmomanometer. Then, the participant immersed their left hand in the ice water bath (3–5°C) to just above the wrist for 1 minute. BP measurements at 0, 60, 120 and 240 seconds after the left hand had been removed from the ice-water bath were obtained on the right arm.
Phenotype measurements
Three morning BP measurements were obtained according to a standard protocol during each of the 3-days of baseline observation and on days 5, 6 and 7 of each intervention period. All BP readings were measured by trained and certified observers using a random-zero sphygmomanometer after 5 minutes of rest with the participant in the sitting position and the arm placed at the level of the heart. The BP levels at baseline and during the intervention were calculated as the mean of nine measurements from three clinical visits during the 3-day baseline observation or on days 5, 6, and 7 of each intervention phase. Responses were defined as follows: BP response to low-sodium = BP on low-sodium diet – BP at baseline; BP response to high-sodium = BP on high-sodium diet – BP on low-sodium diet; and BP response to potassium-supplement = BP on high-sodium diet with potassium-supplementation – BP on high-sodium diet. BP response to CPT at time 0 = BP at time 0 – BP at baseline during the CPT.
Follow-up study
The GenSalt study participants were re-examined in 2008–09 and 2011–12 in the GenSalt follow-up study. Information on the history of hypertension and use of anti-hypertension medications was obtained using a standard questionnaire. Three BP measurements were obtained in the morning during each of 3 days of follow-up visits according to the same protocol used in the GenSalt study. Hypertension was defined as systolic BP ≥140 and/or diastolic BP ≥90 mm Hg or the use of antihypertensive medications among 1,521 GenSalt study participants who were free from hypertension at baseline and participated in the follow-up study.
Genotyping and imputation
The Affymetrix Genomewide Human SNP array 6.0 (Affymetrix, Inc.; Santa Clara, CA) was used to genotype a total of 868,158 autosomal SNPs among 1,881 GenSalt study participants. After removal of 44,237 monomorphic SNPs, 3,638 SNPs due to deviations from Hardy-Weinberg Equilibrium (HWE P<1×10⁻⁶), 1 SNP with all missing data, and 265 SNPs with missing rate > 25% and MAF<1%, a total of 820,017 SNPs remained. There was an overall non-Mendelian inheritance error rate of 0.019%. Non-Mendelian inheritance errors were identified and corrected using PLINK16 and PedCheck.17
A total of 2,416,663 SNPs from the HapMap release 22 build 36 CHB+JPT samples were imputed using MACH software.18 After removing 25,814 monomorphic SNPs along with 174,075 SNPs with r2<0.30, MAF<1% and HWE P<1×10⁻⁶, 2,216,774 SNPs remained for analysis. There was an overall non-Mendelian inheritance error rate of 0.022%. Imputation results are summarized as “dosage” scores (fractional values ranging from 0 to 2, representing the expected number of copies of the coded allele at each SNP).
Based on GWAS findings, a total of 143 independent SNPs (with pairwise r2<0.90) were selected for de novo genotyping. Genotyping in the replication study was carried out using the Sequenom MassARRAY system (Sequenom, Inc., San Diego, CA). Seven SNPs which did not pass quality control were re-genotyped using the Taqman assay (Applied Biosystems; Foster City, CA). Two of the 143 SNPs were excluded from analyses because they appeared monomorphic in the GenSalt-replication study.
Statistical analysis
We used an additive genetic model to examine the association between each SNP and continuous intervention BP phenotypes among the GenSalt study participants. A mixed-effects linear regression model was employed to account for family structure and adjust for age, gender, and body-mass index (BMI) (SAS 9.2, SAS Institute Inc., Cary, NC). A “sandwich” option was used to compute the estimated variance-covariance matrix of the fixed-effects (genetic variant effects) parameters by using the asymptotically consistent estimator. Because most of the studied families (random effects) only included sib-pairs, we selected compound symmetry as the covariance structure, which assumes the same degree of dependency among family members. A conventional genome-wide level of significance (P ≤ 5×10⁻⁸) was used although multiple phenotypes were tested. However, all phenotypes and a large proportion of SNPs are highly correlated with each other in our analysis.
We combined association results for each of the top 141 SNPs across the GenSalt and GenSalt-replication studies. We conducted a meta-analysis of study-specific estimates weighting by their inverse-variance. Associations were considered genome-wide significant if they attained P<5×10⁻⁸ in combined analysis.
We examined the cumulative effects of risk alleles from genome-wide significant loci on the incidence of hypertension. BP genetic risk score was calculated as the sum of the number of risk alleles carried by each participant at all genome-wide significant SNPs.11,12 We defined risk alleles as those associated with greater BP reduction during low-sodium and potassium-supplementation interventions, greater BP increase during high-sodium intervention and CPT, and higher BP level during dietary intervention. Generalized linear mixed models were used to calculate the multivariable adjusted incidence and odds ratio of hypertension according to quartile of genetic risk score while accounting for the non-independence of study participants. Age, gender, BMI, field-center, and follow-up duration were adjusted in the multivariable models.
Results
Characteristics of study participants
Characteristics of the GenSalt and GenSalt-replication study participants are presented in Table 1. On average, BP significantly (all P<0.0001) decreased in response to low-sodium and potassium-supplementation interventions and increased in response to high-sodium intervention and CPT.
Table 1.
Characteristics of the GenSalt and GenSalt-replication study participants.
| GenSalt Study | GenSalt-Replication Study | |
|---|---|---|
| No. of participants | 1,881 | 698 |
| No. of families | 629 | 309 |
| No. of probands | 667 | 314 |
| No. of siblings | 946 | 367 |
| No. of offspring | 200 | 16 |
| Average size of families | 3.0 | 2.3 |
| No. of relative pairs | ||
| Sibling | 1493 | 453 |
| Parent-offspring | 340 | 18 |
| Women, % | 47.2 | 44.0 |
| Age, years | 38.7 (9.5) | 48.5 (9.1) |
| BMI, kg/m2 | 23.3 (3.2) | 25.3 (3.6) |
| Hypertension, % | 9.5 | 21.1 |
| Baseline BP, mm Hg | ||
| Systolic | 116.9 (14.2) | 124.5 (14.5) |
| Diastolic | 73.7 (10.3) | 80.4 (9.3) |
| Mean arterial | 88.1 (10.9) | 95.1 (10.3) |
| BP during low-sodium intervention*, mm Hg | ||
| Systolic | 111.4 (12.2) | 116.5 (11.9) |
| Diastolic | 71.0 (9.7) | 77.0 (8.4) |
| Mean arterial | 84.5 (9.7) | 90.1 (8.9) |
| BP response to low-sodium†, mm Hg | ||
| Systolic | −5.4 (7.0) | −8.1 (8.4) |
| Diastolic | −2.7 (5.5) | −3.5 (5.1) |
| Mean arterial | −3.6 (5.3) | −5.0 (5.6) |
| BP during high-sodium intervention*, mm Hg | ||
| Systolic | 116.3 (13.6) | 125.5 (14.9) |
| Diastolic | 72.9 (10.2) | 80.9 (9.7) |
| Mean arterial | 87.4 (10.6) | 95.8 (10.8) |
| BP response to high-sodium†, mm Hg | ||
| Systolic | 4.8 (6.0) | 9.1 (8.4) |
| Diastolic | 1.9 (5.4) | 4.0 (5.4) |
| Mean arterial | 2.9 (5.0) | 5.7 (5.9) |
| BP during potassium intervention*, mm Hg | ||
| Systolic | 112.7 (13.0) | 120.9 (13.6) |
| Diastolic | 71.5 (9.8) | 79.1 (8.9) |
| Mean arterial | 85.3 (10.1) | 93.0 (9.8) |
| BP response to potassium†, mm Hg | ||
| Systolic | −3.5 (5.5) | −4.6 (5.8) |
| Diastolic | −1.4 (4.6) | −1.9 (4.3) |
| Mean arterial | −2.1 (4.3) | −2.8 (4.3) |
| BP at time 0 of cold pressor test, mm Hg | ||
| Systolic | 132.6 (18.4) | 140.6 (19.0) |
| Diastolic | 81.7 (12.3) | 87.5 (12.0) |
| Mean arterial | 98.6 (13.3) | 105.2 (13.1) |
| BP response to cold pressor test‡, mm Hg | ||
| Systolic | 13.3 (10.2) | 16.2 (10.9) |
| Diastolic | 7.0 (6.8) | 7.2 (7.2) |
| Mean arterial | 9.1 (6.8) | 10.2 (7.2) |
Data are mean (standard deviation) or percentage. BMI = body-mass index; BP = blood pressure.
BP during the low-sodium, high-sodium, and potassium-supplementation interventions were defined as the mean of 9 BP measurements obtained on days 5, 6 and 7 of the corresponding intervention phase.
Mean BP response to low-sodium = the mean of 9 measurements on days 5, 6 and 7 during the low-sodium intervention - the mean of 9 measurements at baseline; response to high-sodium = the mean of 9 measurements on days 5, 6 and 7 during the high-sodium intervention - the mean of 9 measurements on days 5, 6 and 7 during the low-sodium intervention; and response to potassium = the mean of 9 measurements on days 5, 6 and 7 during the high-sodium plus potassium-supplementation intervention - the mean of 9 measurements on days 5, 6 and 7 during the high-sodium intervention.
BP response to CPT was calculated as BP measurement at 0 seconds after removal of the hand from the ice water bath minus the mean of three BP measurements obtained before the ice water immersion.
Genome-wide association analyses and meta-analyses of top signals
For the GWAS analyses of 2.2 million genotyped and imputed SNPs with the intervention BP phenotypes, genomic inflation factors ranged from 1.01 to 1.03, demonstrating no evidence of population stratification in the GenSalt sample. Quantile-quantile plots (Supplementary Figure 1) showed large deviations between observed and expected p-values among highly significant SNPs for the majority of phenotypes: SBP, DBP, and mean arterial BP (MAP) during low-sodium intervention; SBP responses to low-sodium intervention; SBP, DBP, and MAP during high-sodium intervention; SBP, DBP, and MAP responses to high-sodium intervention; SBP, DBP and MAP during potassium-supplementation; and SBP, DBP and MAP responses to CPT.
There were 10 SNPs that achieved genome-wide significance (P<5×10⁻⁸) in the initial GWAS of GenSalt participants: rs10930597 with MAP during low-sodium (P=2.05×10⁻⁸) and with MAP during potassium-supplementation (P=1.21×10⁻⁸); rs13178964 with SBP during low-sodium (P=1.02×10⁻⁸); rs8002688 with SBP responses to low-sodium (P=3.69×10⁻⁸); rs12410212 with DBP during high-sodium (P=4.13×10⁻⁸) and with DBP during potassium-supplementation (P=2.09×10⁻⁸); rs16890334 with SBP during high-sodium (P=2.92×10⁻⁸) and with SBP during potassium-supplementation (P=1.74×10⁻⁸); rs4243280 with SBP during high-sodium (P=3.29×10⁻⁸); rs11887188 with DBP during potassium-supplementation (P=4.80×10⁻⁸); rs10086770 with DBP during potassium-supplementation (P=1.73×10⁻⁸), rs17135875 with MAP responses to CPT (1.53×10⁻⁹), and rs7779854 with MAP responses to CPT (P=3.38×10⁻⁹). The -log10 P values by chromosomal locations for intervention BP phenotypes that achieved genome-wide significance in combined analyses of GenSalt and GenSalt-replication study participants are presented in Supplementary Figure 2. The -log10 P values by chromosomal locations for the remaining intervention BP phenotypes are given in Supplementary Figure 3.
To increase statistical power and provide replication evidence for initial GWAS findings, 143 independent SNPs were carried forward for genotyping among the GenSalt-replication study participants. The meta-analyses of GenSalt and GenSalt-replication study participants revealed 8 novel loci which achieved 12 genome-wide significant signals across 10 phenotypes (Table 2; Supplementary Figure 2). Five of the 8 loci (rs1330225, rs8002688, rs11887188, rs2030114, rs17135875) are low-frequency markers with minor allele frequencies (MAF) ranging from 0.01 to 0.05. In addition, 16 loci achieved suggestive significance in the meta-analyses (P<5×10⁻⁷; Supplementary Table 2).
Table 2.
Eight novel blood pressure loci reaching genome-wide significance (P<5×10⁻⁸) in meta-analysis according to GenSalt intervention phenotypes.
| Lead SNP | Chr | Position (bp) |
Nearest Gene |
Major Allele |
Minor Allele |
Study | No. | MAF | Systolic Blood Pressure | Diastolic Blood Pressure | Mean Arterial Pressure | |||
|---|---|---|---|---|---|---|---|---|---|---|---|---|---|---|
| Beta (SE)* | P-value | Beta (SE)* | P-value | Beta (SE)* | P-value | |||||||||
| Blood Pressure During Low-Sodium Intervention | ||||||||||||||
| rs1330225 | 1 | 106637466 | PRMT6† | T | C | GenSalt | 1,881 | 0.01 | −6.23 (1.81) | 6.08E-04 | −6.39 (1.34) | 1.96E-06 | −6.35 (1.32) | 1.56E-06 |
| GenSalt Replication | 689 | 0.02 | −3.52 (1.74) | 4.33E-02 | −4.51 (1.37) | 1.12E-03 | −4.15 (1.21) | 7.08E-04 | ||||||
| Meta-analysis | 2,570 | 0.01 | −4.81 (1.25) | 1.22E-04 | −5.48 (0.96) | 1.08E-08 | −5.16 (0.89) | 7.29E-09 | ||||||
| rs10930597 | 2 | 174035091 | CDCA7 | C | T | GenSalt | 1,881 | 0.05 | −4.57 (0.97) | 3.08E-06 | −3.72 (0.73) | 4.25E-07 | −4.02 (0.71) | 2.05E-08 |
| GenSalt Replication | 689 | 0.05 | −1.52 (1.57) | 3.35E-01 | −1.56 (1.16) | 1.79E-01 | −1.54 (1.19) | 1.95E-01 | ||||||
| Meta-analysis | 2,570 | 0.05 | −3.72 (0.83) | 7.05E-06 | −3.11 (0.62) | 5.21E-07 | −3.37 (0.61) | 3.57E-08 | ||||||
| Blood Pressure Responses to Low-Sodium Intervention | ||||||||||||||
| rs8002688‡ | 13 | 72457983 | PIBF1 | C | T | GenSalt | 1881 | 0.04 | 2.03 (0.37) | 3.69E-08 | 0.56 (0.43) | 1.97E-01 | 1.04 (0.35) | 2.93E-03 |
| GenSalt Replication | 694 | 0.05 | 2.13 (0.91) | 1.94E-02 | 1.08 (0.73) | 1.38E-01 | 1.43 (0.71) | 4.63E-02 | ||||||
| Meta-analysis | 2,575 | 0.04 | 2.04 (0.34) | 1.78E-09 | 0.70 (0.37) | 6.16E-02 | 1.12 (0.31) | 3.75E-04 | ||||||
| Blood Pressure During High-Sodium Intervention | ||||||||||||||
| rs16890334 | 6 | 79612885 | IRAK1BP1 | T | C | GenSalt | 1881 | 0.06 | −6.00 (1.07) | 2.92E-08 | −2.15 (0.84) | 1.09E-02 | −3.46 (0.83) | 3.14E-05 |
| GenSalt Replication | 695 | 0.06 | −3.81 (1.81) | 3.58E-02 | −2.90 (1.31) | 2.80E-02 | −3.19 (1.43) | 2.59E-02 | ||||||
| Meta-analysis | 2,576 | 0.06 | −5.43 (0.92) | 4.23E-09 | −2.37 (0.71) | 8.43E-04 | −3.39 (0.72) | 2.17E-06 | ||||||
| Blood Pressure During Potassium Intervention | ||||||||||||||
| rs10930597 | 2 | 174035091 | CDCA7 | C | T | GenSalt | 1881 | 0.05 | −4.81 (1.02) | 2.92E-06 | −3.67 (0.68) | 8.07E-08 | −4.04 (0.70) | 1.21E-08 |
| GenSalt Replication | 689 | 0.05 | −1.66 (1.72) | 3.35E-01 | −1.88 (1.14) | 1.00E-01 | −1.82 (1.21) | 1.34E-01 | ||||||
| Meta-analysis | 2,570 | 0.05 | −3.99 (0.88) | 5.90E-06 | −3.20 (0.58) | 4.25E-08 | −3.48 (0.61) | 1.10E-08 | ||||||
| rs11887188§ | 2 | 234967549 | ARL4C | C | T | GenSalt | 1881 | 0.04 | −2.16 (1.02) | 3.45E-02 | −3.72 (0.68) | 4.80E-08 | −3.20 (0.71) | 7.03E-06 |
| GenSalt Replication§ | 691 | 0.03 | −2.93 (1.76) | 9.77E-02 | −2.02 (1.16) | 8.11E-02 | −2.31 (1.25) | 6.40E-02 | ||||||
| Meta-analysis | 2,572 | 0.03 | −2.35 (0.88) | 7.72E-03 | −3.28 (0.58) | 1.86E-08 | −2.98 (0.62) | 1.29E-06 | ||||||
| rs16890334 | 6 | 79612885 | IRAK1BP1 | T | C | GenSalt | 1881 | 0.06 | −5.70 (1.01) | 1.74E-08 | −1.98 (0.77) | 1.06E-02 | −3.22 (0.76) | 2.75E-05 |
| GenSalt Replication | 695 | 0.06 | −4.63 (1.52) | 2.53E-03 | −2.45 (1.03) | 1.76E-02 | −3.18 (1.14) | 5.72E-03 | ||||||
| Meta-analysis | 2,576 | 0.06 | −5.38 (0.84) | 1.44E-10 | −2.15 (0.62) | 5.02E-04 | −3.20 (0.64) | 4.55E-07 | ||||||
| rs2030114 | 16 | 50167448 | SALL1 | G | A | GenSalt | 1881 | 0.01 | −3.56 (1.56) | 2.27E-02 | −4.44 (0.85) | 1.75E-07 | −4.13 (0.99) | 3.15E-05 |
| GenSalt Replication | 685 | 0.01 | −6.91 (4.84) | 1.54E-01 | −2.67 (0.51) | 3.21E-07 | −4.10 (1.74) | 1.91E-02 | ||||||
| Meta-analysis | 2,566 | 0.01 | −3.87 (1.48) | 9.07E-03 | −3.14 (0.44) | 7.01E-13 | −4.12 (0.86) | 1.62E-06 | ||||||
| Blood Pressure Response to Cold Pressor Test (Time 0) | ||||||||||||||
| rs7577262 | 2 | 234483608 | TRPM8 | G | A | GenSalt | 1881 | 0.37 | −1.88 (0.35) | 9.47E-08 | −0.68 (0.23) | 2.56E-03 | −1.09 (0.23) | 2.70E-06 |
| GenSalt Replication | 688 | 0.36 | −1.14 (0.64) | 7.76E-02 | −0.49 (0.38) | 1.98E-01 | −0.71 (0.41) | 8.02E-02 | ||||||
| Meta-analysis | 2,569 | 0.37 | −1.71 (0.31) | 2.68E-08 | −0.63 (0.19) | 1.12E-03 | −1.00 (0.20) | 6.76E-07 | ||||||
| rs17135875‡ | 7 | 102306267 | FBXL13 | T | C | GenSalt | 1881 | 0.01 | −5.56 (1.15) | 1.66E-06 | −3.25 (0.64) | 5.39E-07 | −3.94 (0.65) | 1.53E-09 |
| GenSalt Replication | 686 | 0.02 | −2.06 (2.21) | 3.50E-01 | −0.87 (1.35) | 5.20E-01 | −1.27 (1.34) | 3.45E-01 | ||||||
| Meta-analysis | 2,567 | 0.01 | −4.81 (1.02) | 2.60E-06 | −2.81 (0.58) | 1.40E-06 | −3.44 (0.58) | 3.74E-09 | ||||||
Physical positions are listed according to NCBI build 36.3. Beta is the effect size per minor allele based on an additive genetic model. bp = basepairs; Chr = chromosome; Freq = frequency; SE = standard error; SNP = single nucleotide polymorphism.
Effect size in mm Hg.
Gene located over 500,000 bp away from the lead SNP.
Lead SNP lays within the corresponding gene.
rs11692463 was used as a proxy for rs11887188 in the replication sample (r2=0.98).
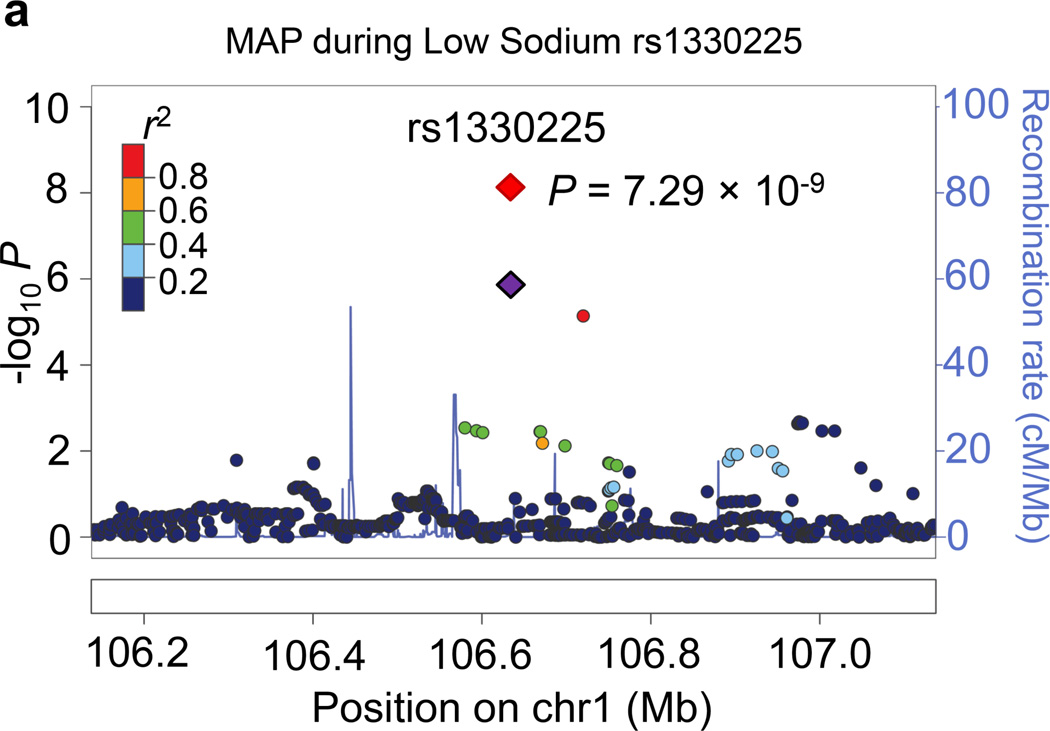
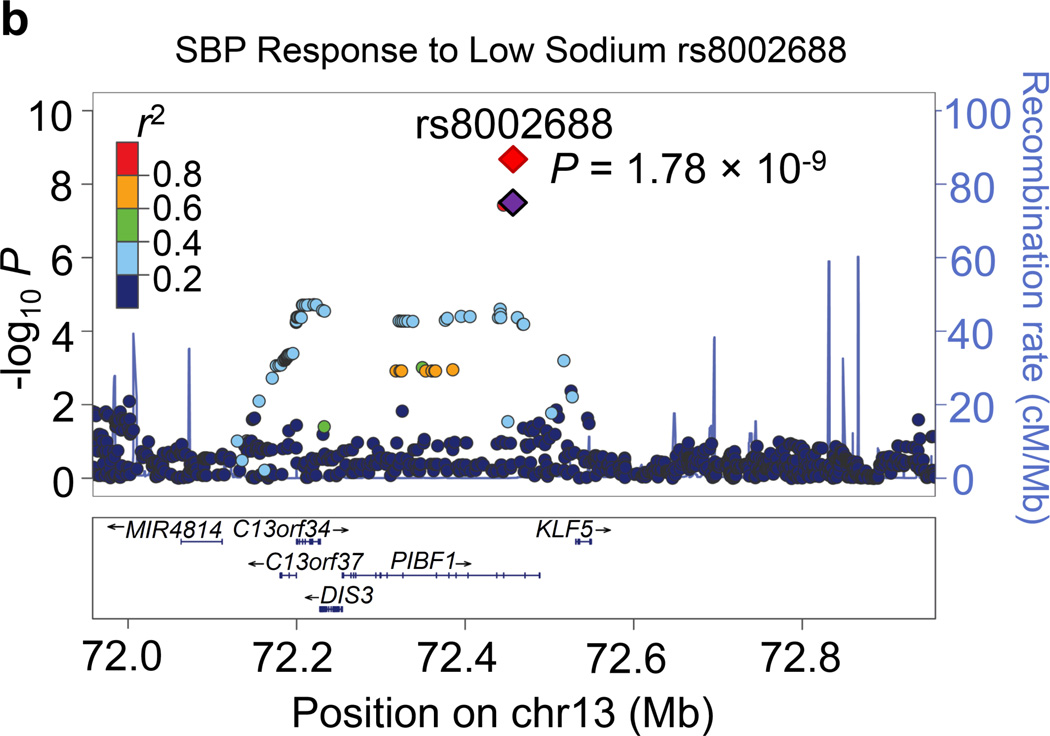
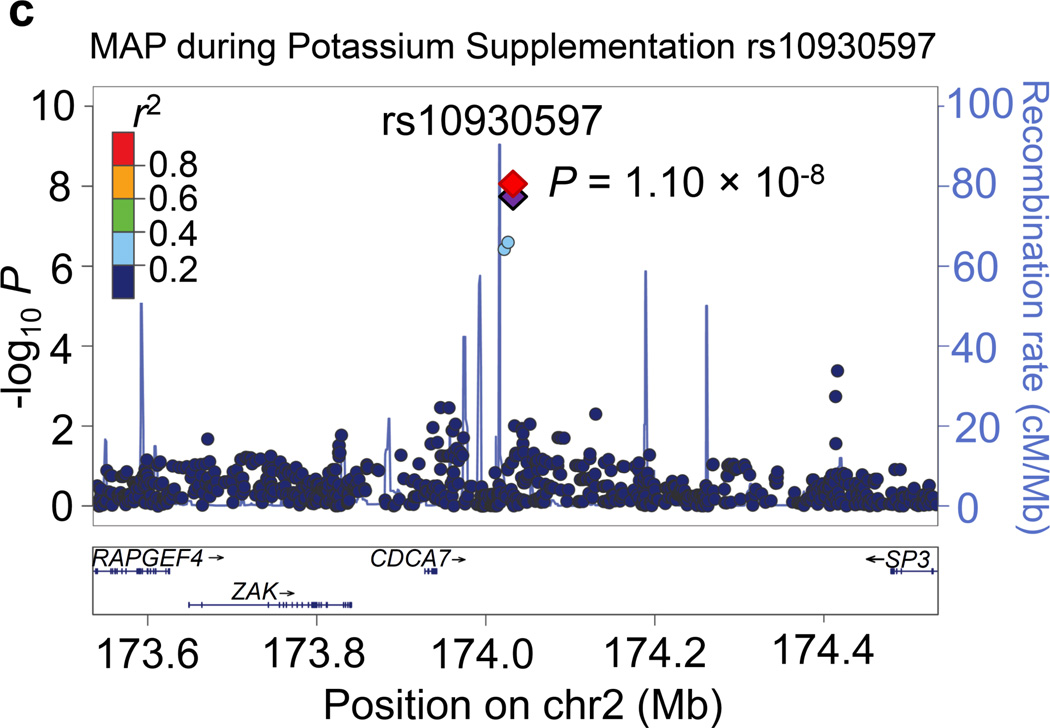
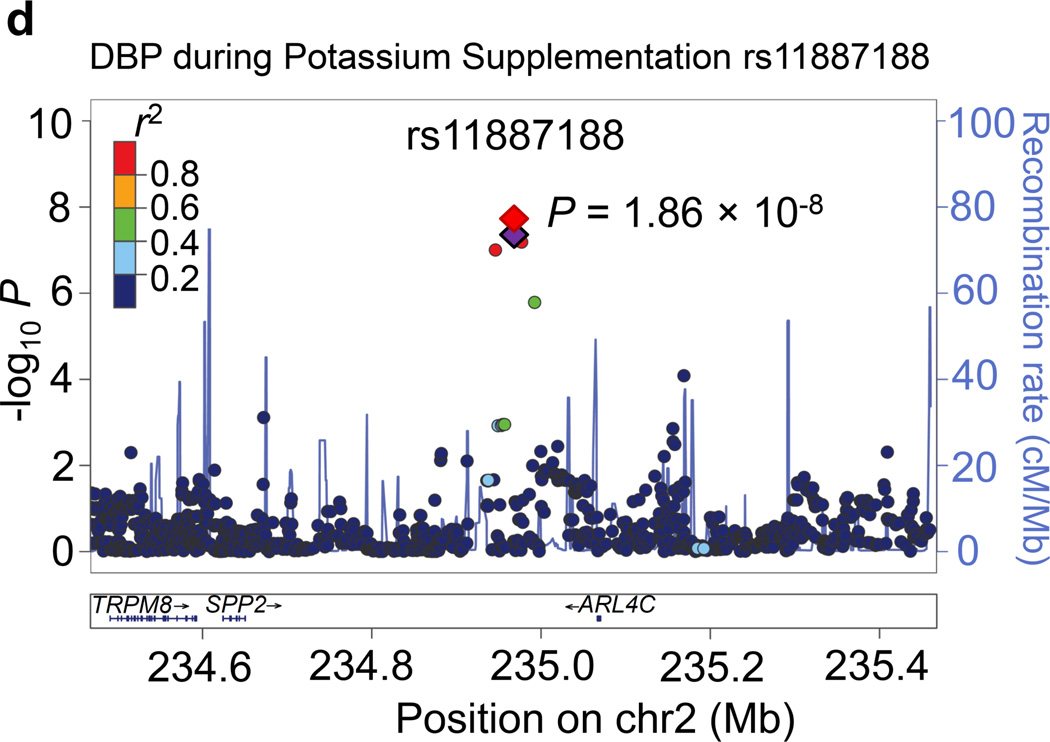
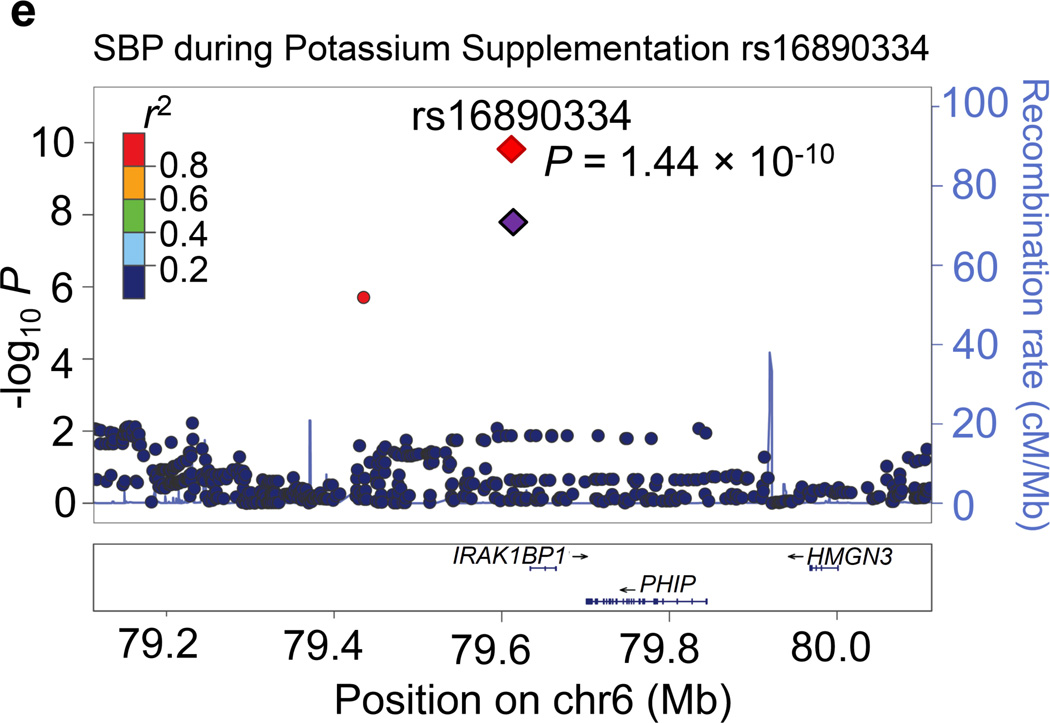
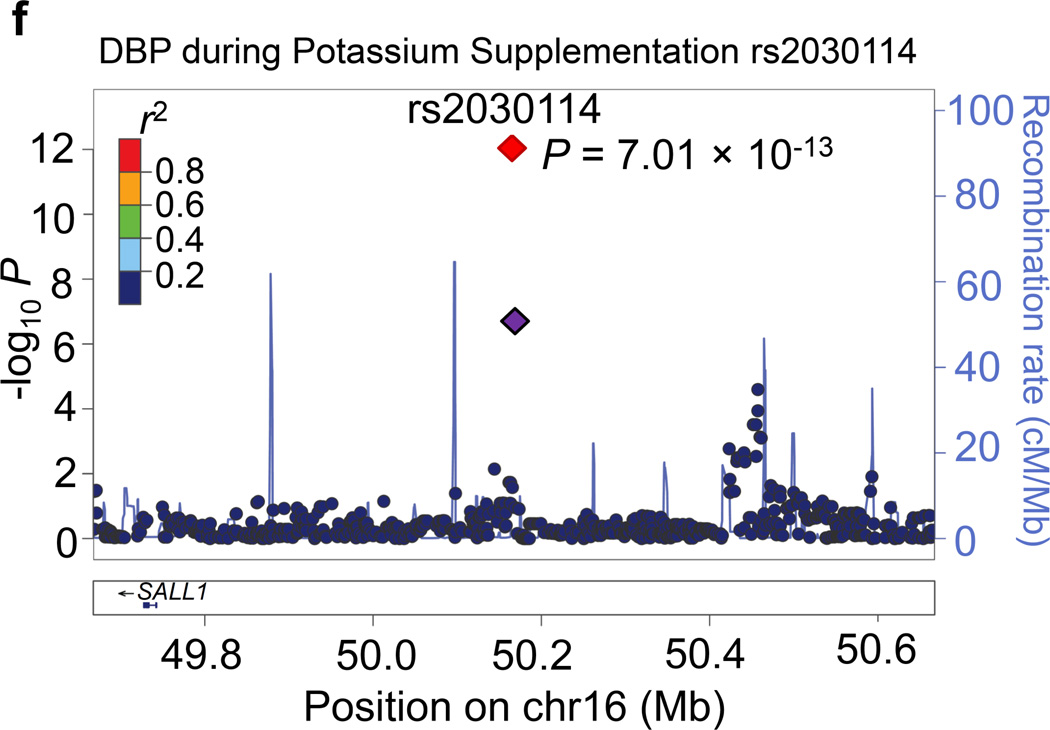
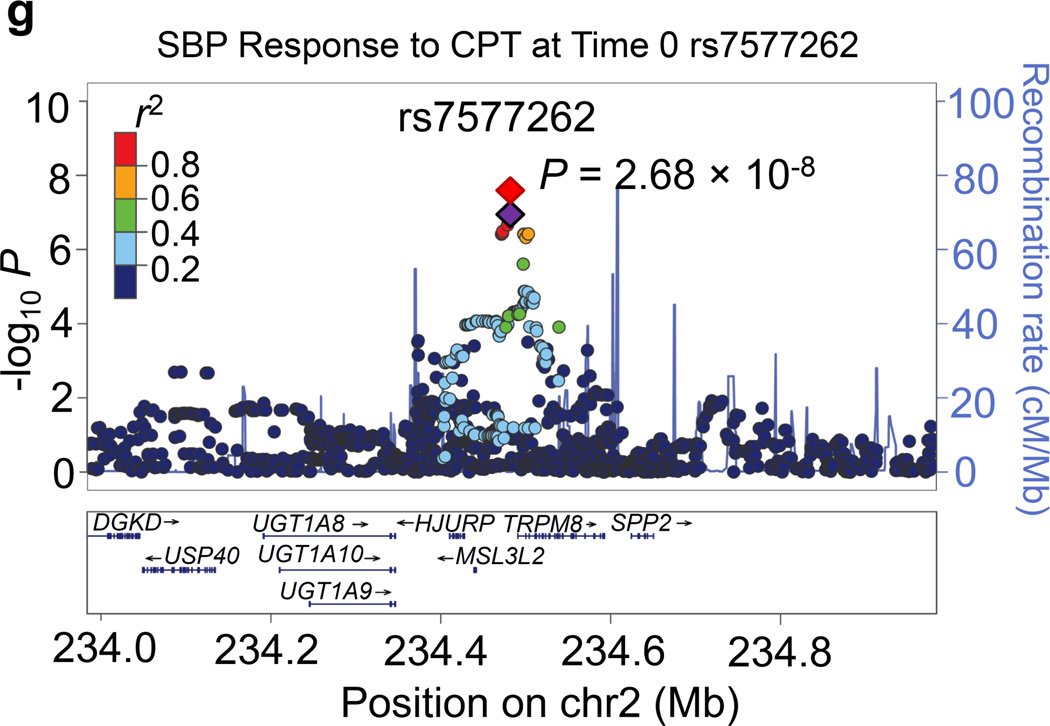
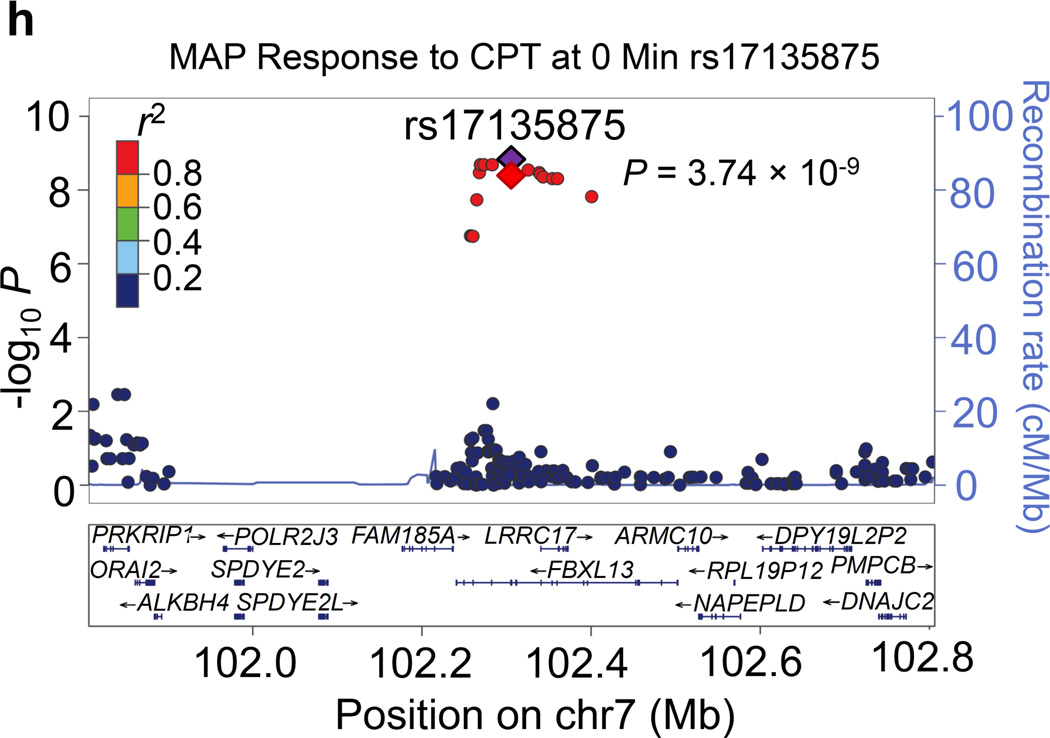
Regional association plots for the 8 novel loci with genome-wide significance in the meta-analyses are given in Figure 1. Some loci (e.g., rs10930597 and rs16890334) achieved genome-wide significance with more than one BP phenotype. However, only one regional association plot was presented for each locus. These loci are depicted using the most significant phenotype associations.
Figure 1.
Regional association plots of the 8 loci showing genome-wide significant associations (P<5×10⁻⁸) with blood pressure phenotypes during dietary sodium and potassium interventions and cold pressor test in the meta-analysis. For the SNPs associated with multiple phenotypes, the results for the most significant phenotype are shown. The index SNPs are shown in purple diamond; the correlation (r2) of each of the surrounding SNPs to the index SNP are shown in the colors indicated in the key. The final P values for the index SNPs are shown and also indicated by the red diamonds. The genes in the 1Mb regions around the index SNPs (500kb on each side) are indicated at the bottom.
Two genome-wide significant loci for BP during low-sodium intervention were identified in the current study. A genome-wide significant signal at 1p21.1 was achieved for the association between rs1330225 and both DBP and MAP during low-sodium intervention (P=1.08×10⁻⁸ and 7.29×10⁻⁹, respectively). This intergenic variant is located over 500 kilobase-pairs downstream of its closest gene neighbor, PRMT6 (Figure 1a). At 2q31.1, intergenic variant rs10930597 achieved genome-wide significance for its association with MAP during low-sodium intervention (P=3.57×10⁻⁸). This variant is located within 500 kilobase-pairs of the relatively unstudied RAPGEF4, ZAK, CDCA7 and SP3 genes (Figure 1c). In addition, one locus for the BP responses to low-sodium intervention achieved genome-wide significance. At 13q22.1, the intronic PIBF1 marker rs8002688 was associated with SBP responses to low-sodium with P=1.78×10⁻⁹ (Figure 1b). Other genes within the one mega-base pair region include transcription factor gene KLF5 and the DIS3 gene. A genome-wide significant signal for SBP during high-sodium intervention (P=4.23×10⁻⁹) was observed at 6q14.1 with marker rs16890334, which is located just 21 kilobases upstream of the IRAK1BP1 gene (Figures 1e).
Four loci attained genome-wide significance for BP during potassium-supplementation intervention. The CDCA7 locus marker rs10930597, which achieved genome-wide significance for its association with MAP during low-sodium intervention, again attained this significance threshold for both DBP and MAP during potassium-supplementation (P=4.25 ×10⁻⁸ and 1.10×10⁻⁸, respectively; Figure 1c). At 2q37.2, a novel intergenic marker rs1187188 attained P=1.86×10⁻⁸ for association with DBP during potassium-supplementation (Figure 1d). The closest gene to marker rs1187188 is ARL4C, while distant genes include SPP2 and TRPM8. Similarly, at 6q14.1 IRAKBP1 marker rs16890334, which robustly associated with BP during high-sodium, attained genome-wide significance for SBP during potassium-supplementation (P=1.44×10⁻¹⁰) (Figure 1e). At 16q12.2, low-frequency variant rs2030114 achieved a genome-wide significant association with DBP during potassium-supplementation (P=7.01×10⁻¹³; Figure 1f). The only gene at this locus SALL1 is located over 400 kilobases away from rs2030114.
Two signals were identified for the BP responses to CPT. Located at 2q37.1 just 7 kilobases upstream of the TRPM8 gene, rs7577262 attained genome-wide significance for its association with SBP responses to CPT (P=2.68×10⁻⁸; Figure 1g). Other genes nearby rs7577262 include HJURP, SPP2, UGT1A8-UGT1A10, USP40, and DGKD. At 7q22.1, intronic FBXL13 marker rs17135875 achieved genome-wide significant associations with MAP response to CPT (P=3.74×10⁻⁹; Figure 1h). Other genes in the region include PRKRIP1, ORAI2, ALKBH4, POLR2J3, SPDYE2-2L, ARMC10, NAPEPLD, RPL19P12, DPY19L2P2, PMPCB and DNAJC2.
Effect size of genome-wide significant variants on BP phenotypes
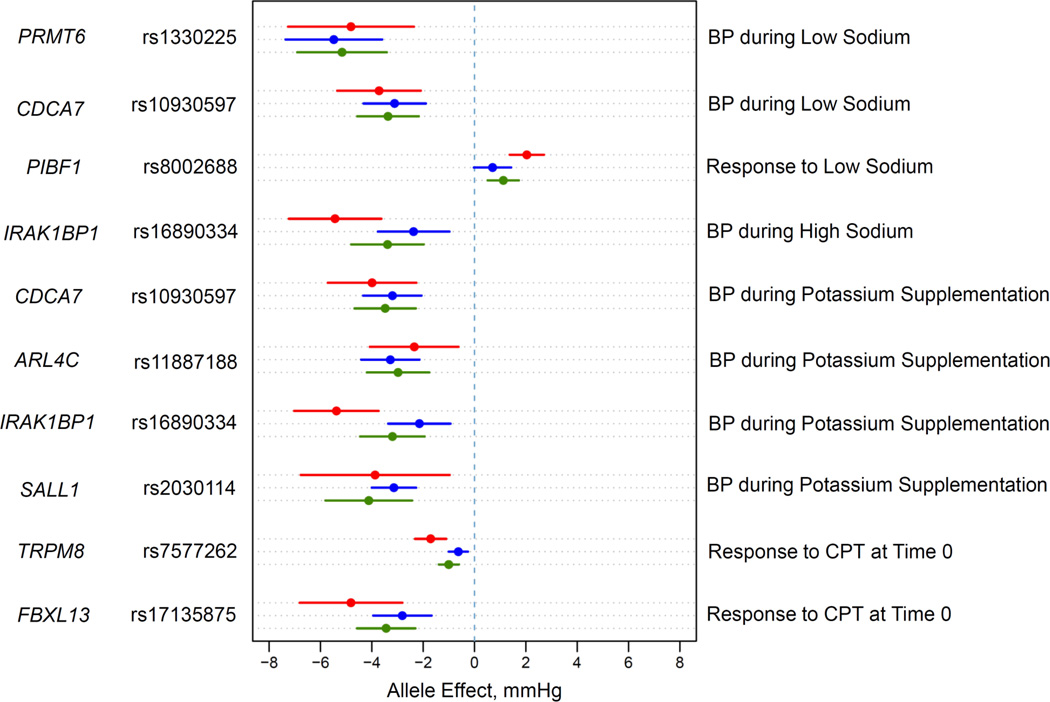
The absolute differences in BP during dietary sodium and potassium interventions for genome-wide significant SNPs ranged from 5.38 to 5.43 mm Hg for SBP and 3.14 to 5.48 mm Hg for DBP per coded allele (Table 2). The differences in BP responses to dietary sodium and potassium interventions or CPT were slightly smaller. BP differences for genome-wide significant signals were consistent in direction and magnitude across SBP, DBP and MAP within each intervention (Figure 2).
Figure 2.
Effect size estimates and 95% confidence intervals per minor allele of the 8 significant SNPs. Effect sizes are expressed in mm Hg per coded allele.
Cumulative effects on hypertension incidence
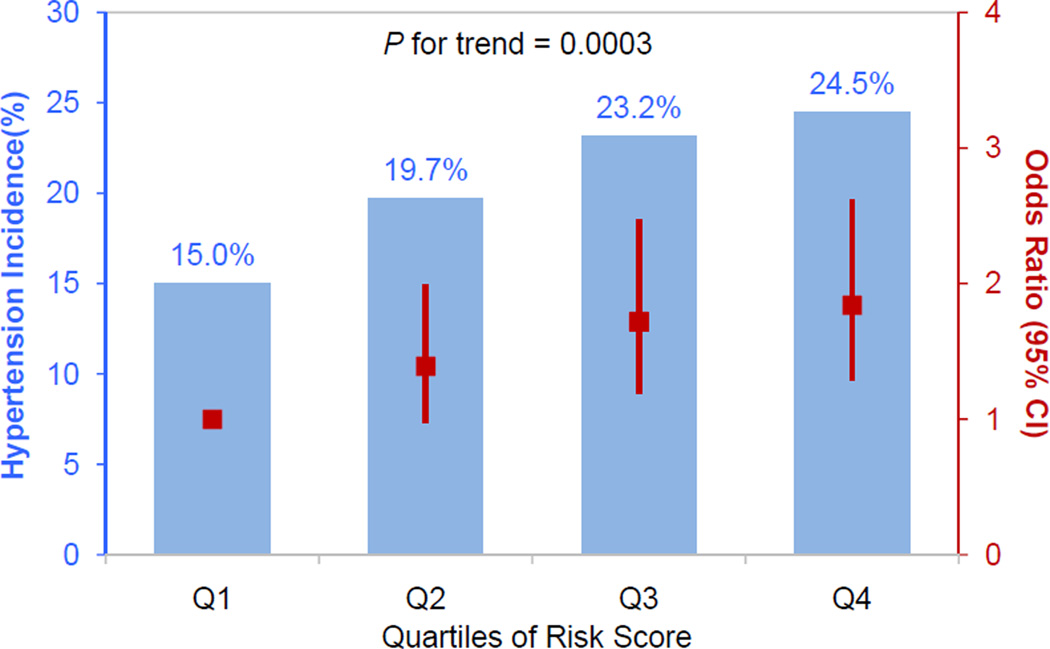
There was a strong dose-response relationship between risk allele quartile and development of hypertension (P=0.0003; Figure 3). The cumulative incidence of hypertension over a median follow-up time of 7.5 years was 15.0%, 19.7% %, 23.2% and 24.5% from the lowest to highest quartiles of risk alleles. Compared to those in the lowest quartile of risk alleles, odds ratios (95% confidence intervals) for those in the second, third and fourth quartiles were 1.39 (0.97, 1.99), 1.72 (1.19, 2.47), and 1.84 (1.29, 2.62), respectively.
Figure 3.
Combined effect of risk alleles on hypertension incidence in the GenSalt follow-up study. Individual risk score was calculated as the sum of the dose of risk alleles of the genome-wide significant SNPs. The blue columns show the hypertension incidence according to quartiles of risk score among the GenSalt participants. Compared to the bottom quartile of risk score, the odds ratio (95% confidence interval) for the other quartiles are 1.39 (0.97, 1.99), 1.72 (1.19, 2.47), and 1.84 (1.29, 2.62), respectively. The odds ratios and their 95% confidence intervals are indicated in red squares and bars, respectively.
Discussion
We identified 8 novel loci for BP responses to dietary sodium and potassium interventions and CPT in the Han Chinese population. This study is the first GWAS to report genome-wide significant associations between genetic variants and intermediate BP phenotypes from interventions. The effect sizes of intermediate BP phenotypes associated with genetic variants are much greater than usual BP reported in the previous GWAS meta-analyses.9–13 Our study suggests that there are undiscovered pathways for BP regulation through sodium and potassium metabolism or the sympathetic system. Our study was able to identify multiple novel loci with a relatively small sample size due to its several unique design features. By controlling dietary intake of sodium, potassium, and other nutrients, environmental influences on BP variations are reduced; therefore, genetic effects on BP variations are amplified and therefore easier to detect in our study. The extreme low and high sodium intake, potassium supplementation, and cold pressor stimulate the expression of genes that are involved in sodium and potassium metabolisms, sympathetic function, and BP regulation. Thus, the associations of these genes with BP are easier to identify. In addition, averaging the multiple BP readings obtained on multiple days reduced the measurement errors of study phenotypes.
Several studies, including the GenSalt study, have showed that BP responses to dietary sodium intake and CPT are reliable and reproducible traits.19–22 Furthermore, BP responses to sodium intake and CPT are associated with the increased risk of hypertension, cardiovascular disease, and mortality.23–25
We identified four novel loci for sodium-BP phenotypes, which physically mapped in or near PRMT6, CDCA7, PIBF1, and IRAK1BP1. The most significant SNP from each of the first 2 loci are located in intergenic regions. The PIBF1 gene encodes a progesterone-induced molecule known to interact with leptin to mediate the effects of progesterone during pregnancy.26,27 The putative role of this gene in BP regulation is unclear. IRAK1BP1 is a part of the signaling pathway which leads to activation of NF-kappa-B1.28 A transcription factor for pro-inflammatory pathway genes, inhibition of NF-kappa-B has been shown to decrease inflammation, BP, and angiotensin-II induced target end-organ damage in animal models,29,30 representing a plausible biological mechanism underlying the observed association. In addition, the nearby gene PHIP has been shown to modulate insulin signaling,31 while HMGN3 represents an important regulator of glucose-stimulated insulin secretion.32
We identified a suggestive genome-wide significant locus at 11p15.5 for MAP responses to high-sodium intervention (P=3.58×10⁻⁷). Marker rs10832417 is located in the intronic region of the KCNQ1 gene. Robust signals at KCNQ1 have been reported previously for type-2 diabetes,33–35 QT interval duration,36–38 and atrial fibrillation.39 Although not previously associated with BP-related traits, as a potassium channel with known protein expression in kidney cell lines,28 KCNQ1 represents a promising salt-sensitivity susceptibility locus.
Four loci were identified for BP during high-sodium and potassium-supplementation, which physically mapped in or near CDCA7, ARL4C, IRAK1BP1, and SALL1 gene. CDCA7 and IRAKBP1 were also associated with sodium-BP phenotypes. ARL4C might be involved in lipid metabolism and inflammation.40,41 SALL1 was previously reported to associate with C-reactive protein in a GWAS.42 In addition, a SALL1 mutation was associated with impaired kidney function in a family.43 The associations between these loci with BP phenotypes have not been reported previously.
Two loci, which physically mapped in or near TRPM8 and FBXL13, were associated with BP response to CPT. Linked previously to neuropathic pain,44 TRPM8 is a logical candidate for BP response to CPT. Acting as a sensor for cold and cold-induced pain, TRPM8 encodes a non-selective cation channel that is activated by cold temperature below 25°C and permeable to sodium, potassium, cesium and calcium.28,45,46 TRPM8 was also close to marker rs1187188 which achieved genome-wide association with BP during high-sodium and potassium-supplementation intervention. Encoding a protein ubiquitin ligase, a functional role of FBXL13 in BP response to CPT is unclear. However, FBXL13 marker rs17135875 lies in a gene dense region and is highly correlated with missense mutation rs17842496 (not successfully imputed in GenSalt but r2=1.00 in the HapMap CHB sample) of the relatively unstudied FAM18A gene. In addition, this marker was also highly correlated with LRRC17 transcription factor binding sites rs17135916 (r2=0.89) and rs7779854 (r2=0.89) as well as NFE4 transcription factor binding site rs2411061 (r2=0.84).
There are several limitations of this study that should be noted. Due to the uniqueness of intervention phenotypes, our study sample size is smaller compared to other (non-intervention) BP GWAS.9–13 In addition, we were not able to identify additional independent samples for replication of our study findings. However, 5 of these SNPs showed nominal significance with usual BP in East Asians of the Asia Genetic Epidemiology Network (Supplemental Table 3). Furthermore, previously reported SNPs are associated with absolute BP levels, but not BP responses to interventions in our samples (Supplemental Tables 4 and 5). Our study is conducted in a community-based sample of the Chinese population. Therefore, the findings from this study may apply to the Chinese general population and other East Asian populations. In addition, previous studies have shown trans-ethnicity replications of GWAS findings of usual BP.11 It is possible that some of our novel genetic loci associated with BP responses can be replicated in other race/ethnicities. Future studies are needed to confirm our findings in other populations.
Additional limitations include that most genetic variants reported in our study are not functional. Candidate genes mentioned in this manuscript are only physically closest to identified novel SNPs. The causal variants in high LD with these SNPs might not be located within these candidate genes. Therefore, targeted deep sequencing studies in the entire genomic regions implied are required to identify rare or low frequency novel functional variants for BP responses to intervention.47 In addition, only a few SNPs for each intervention phenotype were identified. We are not able to develop intervention-specific genetic risk scores for the prediction of hypertension. Furthermore, BP responses to 7-day low-sodium, high-sodium, or potassium-supplementation intervention might not reflect the long-term effect of diet on BP. However, our study and others have documented that BP responses to dietary sodium and potassium interventions become stable after 5 days.48 Finally, multiple correlated BP phenotypes (absolute levels and responses to intervention) are included in our analysis, which may inflate false-positive findings.
In summary, our study identified 8 novel loci for BP phenotypes during dietary sodium and potassium intervention and CPT. The effect size of these novel loci on BP phenotypes are much larger than those reported by the previously published BP-GWAS meta-analyses.9–13 Furthermore, these variants predict the risk of developing hypertension among individuals with normal BP at baseline. Future studies are warranted to confirm these findings in independent populations and/or to investigate the functional mechanisms of these novel loci.
Supplementary Material
Acknowledgments
We acknowledge Upsher–Smith Laboratories, Inc. for providing potassium chloride tablets (Klor–Con®M20).
Funding Sources: The Genetic Epidemiology Network of Salt Sensitivity (GenSalt) is supported by research grants (U01HL072507, R01HL087263, and R01HL090682) from the National Heart, Lung, and Blood Institute, NIH, Maryland and partially supported by the Collins C. Diboll Private Foundation, New Orleans, LA. This study is also partially funded by research grant (2012AA02A516) of the High-Tech Research and Development Program of China (863 Plan) from the Ministry of Science and Technology of China.
Footnotes
Conflict of Interest Disclosures: None.
References
- 1.Kearney PM, Whelton M, Reynolds K, Muntner P, Whelton PK, He J. Global burden of hypertension: Analysis of worldwide data. Lancet. 2005;365:217–223. doi: 10.1016/S0140-6736(05)17741-1. [DOI] [PubMed] [Google Scholar]
- 2.Lopez AD, Mathers CD, Ezzati M, Jamison DT, Murray CJ. Global and regional burden of disease and risk factors, 2001: Systematic analysis of population health data. Lancet. 2006;367:1747–1757. doi: 10.1016/S0140-6736(06)68770-9. [DOI] [PubMed] [Google Scholar]
- 3.Adrogué HJ, Madias NE. Sodium and potassium in the pathogenesis of hypertension. N Engl J Med. 2007;356:1966–1978. doi: 10.1056/NEJMra064486. [DOI] [PubMed] [Google Scholar]
- 4.He J, Gu D, Chen J, Jaquish CE, Rao DC, Hixson JE, et al. Gender difference in blood pressure responses to dietary sodium intervention in the GenSalt study. J Hypertens. 2009;27:48–54. doi: 10.1097/hjh.0b013e328316bb87. [DOI] [PMC free article] [PubMed] [Google Scholar]
- 5.Kelly TN, He J. Genomic epidemiology of blood pressure salt sensitivity. J Hypertens. 2012;30:861–873. doi: 10.1097/HJH.0b013e3283524949. [DOI] [PubMed] [Google Scholar]
- 6.Kasagi F, Akahoshi M, Shimaoka K. Relation between cold pressor test and development of hypertension based on 28-year follow-up. Hypertension. 1995;25:71–76. doi: 10.1161/01.hyp.25.1.71. [DOI] [PubMed] [Google Scholar]
- 7.Chen J, Gu D, Jaquish CE, Chen CS, Rao DC, Liu D, et al. Association between blood pressure responses to the cold pressor test and dietary sodium intervention in a Chinese population. Arch Intern Med. 2008;168:1740–1746. doi: 10.1001/archinte.168.16.1740. [DOI] [PMC free article] [PubMed] [Google Scholar]
- 8.Mei H, Gu D, Rice TK, Hixson JE, Chen J, Jaquish CE, et al. Heritability of blood pressure responses to cold pressor test in a Chinese population. Am J Hypertens. 2009;22:1096–1100. doi: 10.1038/ajh.2009.139. [DOI] [PMC free article] [PubMed] [Google Scholar]
- 9.Newton-Cheh C, Johnson T, Gateva V, Tobin MD, Bochud M, Coin L, et al. Genome-wide association study identifies eight loci associated with blood pressure. Nat Genet. 2009;41:666–676. doi: 10.1038/ng.361. [DOI] [PMC free article] [PubMed] [Google Scholar]
- 10.Levy D, Ehret GB, Rice K, Verwoert GC, Launer LJ, Dehghan A, et al. Genome-wide association study of blood pressure and hypertension. Nat Genet. 2009;41:677–687. doi: 10.1038/ng.384. [DOI] [PMC free article] [PubMed] [Google Scholar]
- 11.Kato N, Takeuchi F, Tabara Y, Kelly TN, Go MJ, Sim X, et al. Meta-analysis identifies five novel loci associated with blood pressure in East Asians. Nat Genet. 2011;43:531–538. doi: 10.1038/ng.834. [DOI] [PMC free article] [PubMed] [Google Scholar]
- 12.International Consortium for Blood Pressure Genome-Wide Association Studies. Genetic variants in novel pathways influence blood pressure and cardiovascular disease risk. Nature. 2011;478:103–109. doi: 10.1038/nature10405. [DOI] [PMC free article] [PubMed] [Google Scholar]
- 13.Wain LV, Verwoert GC, O'Reilly PF, Shi G, Johnson T, Johnson AD, et al. Genome-wide association study identifies six new loci influencing pulse pressure and mean arterial pressure. Nat Genet. 2011;43:1005–1011. doi: 10.1038/ng.922. [DOI] [PMC free article] [PubMed] [Google Scholar]
- 14.GenSalt Collaborative Research Group. GenSalt: rationale, design, methods and baseline characteristics of study participants. J Hum Hypertens. 2007;21:639–646. doi: 10.1038/sj.jhh.1002207. [DOI] [PMC free article] [PubMed] [Google Scholar]
- 15.Zhao Q, Gu D, Chen J, Li J, Cao J, Lu F, et al. Blood pressure responses to dietary sodium and potassium interventions and the cold pressor test: The GenSalt Replication Study in Rural North China. Am J Hypertens. 2013 Sep 4; doi: 10.1093/ajh/hpt163. [Epub ahead of print] [DOI] [PMC free article] [PubMed] [Google Scholar]
- 16.Purcell S, Neale B, Todd-Brown K, Thomas L, Ferreira MAR, Bender D, et al. PLINK: a tool set for whole-genome association and population-based linkage analyses. Am J Human Genet. 2007;81:559–575. doi: 10.1086/519795. [DOI] [PMC free article] [PubMed] [Google Scholar]
- 17.O'Connell JR, Weeks DE. PedCheck: a program for identification of genotype incompatibilities in linkage analysis. Am J Human Genet. 1998;63:259–266. doi: 10.1086/301904. [DOI] [PMC free article] [PubMed] [Google Scholar]
- 18.Li Y, Willer CJ, Ding J, Scheet P, Abecasis GR. MaCH: using sequence and genotype data to estimate haplotypes and unobserved genotypes. Genet Epidemiol. 2010;34:816–834. doi: 10.1002/gepi.20533. [DOI] [PMC free article] [PubMed] [Google Scholar]
- 19.Sharma AM, Schattenfroh S, Kribben A, Distler A. Reliability of salt-sensitivity testing in normotensive subjects. Klin Wochenschr. 1989;67:632–634. doi: 10.1007/BF01718145. [DOI] [PubMed] [Google Scholar]
- 20.Gu D, Zhao Q, Chen J, Chen JC, Huang J, Bazzano LA, et al. Reproducibility of blood pressure responses to dietary sodium and potassium interventions: the GenSalt Study. Hypertension. 2013;62:499–505. doi: 10.1161/HYPERTENSIONAHA.113.01034. [DOI] [PMC free article] [PubMed] [Google Scholar]
- 21.Hassellund SS, Flaa A, Sandvik L, Kjeldsen SE, Rostrup M. Long-term stability of cardiovascular and catecholamine responses to stress tests: an 18-year follow-up study. Hypertension. 2010;55:131–136. doi: 10.1161/HYPERTENSIONAHA.109.143164. [DOI] [PubMed] [Google Scholar]
- 22.Zhao Q, Bazzano LA, Cao J, Li J, Chen J, Huang J, et al. Reproducibility of blood pressure response to the cold pressor test: the GenSalt Study. Am J Epidemiol. 2012;176(Suppl 7):S91–S98. doi: 10.1093/aje/kws294. [DOI] [PMC free article] [PubMed] [Google Scholar]
- 23.Barba G, Galletti F, Cappuccio FP, Siani A, Venezia A, Versiero M, et al. Incidence of hypertension in individuals with different blood pressure salt-sensitivity: results of a 15-year follow-up study. J Hypertens. 2007;25:1465–1471. doi: 10.1097/HJH.0b013e3281139ebd. [DOI] [PubMed] [Google Scholar]
- 24.Weinberger MH, Fineberg NS, Fineberg SE, Weinberger M. Salt sensitivity, pulse pressure, and death in normal and hypertensive humans. Hypertension. 2001;37(2 Part 2):429–432. doi: 10.1161/01.hyp.37.2.429. [DOI] [PubMed] [Google Scholar]
- 25.Knox SS, Hausdorff J, Markovitz JH. Reactivity as a predictor of subsequent blood pressure: racial differences in the Coronary Artery Risk Development in Young Adults (CARDIA) Study. Hypertension. 2002;40:914–919. doi: 10.1161/01.hyp.0000041417.94797.57. [DOI] [PubMed] [Google Scholar]
- 26.Szekeres-Bartho J, Falkay G, Torok A, Pacsa AS. The mechanism of the inhibitory effect of progesterone on lymphocyte cytotoxicity: Ii. Relationship between cytotoxicity and the cyclooxygenase pathway of arachidonic acid metabolism. Am J Reprod Immunol Microbiol. 1985;9:19–22. doi: 10.1111/j.1600-0897.1985.tb00335.x. [DOI] [PubMed] [Google Scholar]
- 27.Miko E, Halasz M, Jericevic-Mulac B, Wicherek L, Arck P, Arató G, et al. Progesterone-induced blocking factor (PIBF) and trophoblast invasiveness. J Reprod Immunol. 2011;90:50–57. doi: 10.1016/j.jri.2011.03.005. [DOI] [PubMed] [Google Scholar]
- 28.Stelzer G, Dalah I, Stein TI, Satanower Y, Rosen N, Nativ N, et al. In-silico human genomics with GeneCards. Hum Genomics. 2011;5:709–717. doi: 10.1186/1479-7364-5-6-709. [DOI] [PMC free article] [PubMed] [Google Scholar]
- 29.Muller DN, Dechend R, Mervaala EM, Park JK, Schmidt F, Fiebeler A, et al. NF-kappaB inhibition ameliorates angiotensin II-induced inflammatory damage in rats. Hypertension. 2000;35:193–201. doi: 10.1161/01.hyp.35.1.193. [DOI] [PubMed] [Google Scholar]
- 30.Rodriguez-Iturbe B, Ferrebuz A, Vanegas V, Quiroz Y, Mezzano S, Vaziri ND. Early and sustained inhibition of nuclear factor-kappaB prevents hypertension in spontaneously hypertensive rats. J Pharmacol Exp Ther. 2005;315:51–57. doi: 10.1124/jpet.105.088062. [DOI] [PubMed] [Google Scholar]
- 31.Farhang-Fallah J, Yin X, Trentin G, Cheng AM, Rozakis-Adcock M. Cloning and characterization of PHIP, a novel insulin receptor substrate-1 pleckstrin homology domain interacting protein. J Biol Chem. 2000;275:40492–40497. doi: 10.1074/jbc.C000611200. [DOI] [PubMed] [Google Scholar]
- 32.Ueda T, Furusawa T, Kurahashi T, Tessarollo L, Bustin M. The nucleosome binding protein HMGN3 modulates the transcription profile of pancreatic beta cells and affects insulin secretion. Mol Cell Biol. 2009;29:5264–5276. doi: 10.1128/MCB.00526-09. [DOI] [PMC free article] [PubMed] [Google Scholar]
- 33.Yasuda K, Miyake K, Horikawa Y, Hara K, Osawa H, Furuta H, et al. Variants in KCNQ1 are associated with susceptibility to type 2 diabetes mellitus. Nat Genet. 2008;40:1092–1097. doi: 10.1038/ng.207. [DOI] [PubMed] [Google Scholar]
- 34.Unoki H, Takahashi A, Kawaguchi T, Hara K, Horikoshi M, Andersen G, et al. SNPs in KCNQ1 are associated with susceptibility to type 2 diabetes in east Asian and European populations. Nat Genet. 2008;40:1098–1102. doi: 10.1038/ng.208. [DOI] [PubMed] [Google Scholar]
- 35.Voight BF, Scott LJ, Steinthorsdottir V, Morris AP, Dina C, Welch RP, et al. Twelve type 2 diabetes susceptibility loci identified through large-scale association analysis. Nat Genet. 2010;42:579–589. doi: 10.1038/ng.609. [DOI] [PMC free article] [PubMed] [Google Scholar]
- 36.Holm H, Gudbjartsson DF, Arnar DO, Thorleifsson G, Thorgeirsson G, Stefansdottir H, et al. Several common variants modulate heart rate, PR interval and QRS duration. Nat Genet. 2010;42:117–122. doi: 10.1038/ng.511. [DOI] [PubMed] [Google Scholar]
- 37.Newton-Cheh C, Eijgelsheim M, Rice KM, de Bakker PI, Yin X, Estrada K, et al. Common variants at ten loci influence QT interval duration in the QTGEN study. Nat Genet. 2009;41:399–406. doi: 10.1038/ng.364. [DOI] [PMC free article] [PubMed] [Google Scholar]
- 38.Pfeufer A, Sanna S, Arking DE, Müller M, Gateva V, Fuchsberger C, et al. Common variants at ten loci modulate the QT interval duration in the QTSCD study. Nat Genet. 2009;41:407–414. doi: 10.1038/ng.362. [DOI] [PMC free article] [PubMed] [Google Scholar]
- 39.Chen YH, Xu SJ, Bendahhou S, Wang XL, Wang Y, Xu WY, et al. KCNQ1 gain-of-function mutation in familial atrial fibrillation. Science. 2003;299:251–254. doi: 10.1126/science.1077771. [DOI] [PubMed] [Google Scholar]
- 40.Engel T, Lueken A, Bode G, Hobohm U, Lorkowski S, Schlueter B, et al. ADP-ribosylation factor (ARF)-like 7 (ARL7) is induced by cholesterol loading and participates in apolipoprotein AI-dependent cholesterol export. FEBS Lett. 2004;566:241–246. doi: 10.1016/j.febslet.2004.04.048. [DOI] [PubMed] [Google Scholar]
- 41.Hong C, Walczak R, Dhamko H, Bradley MN, Marathe C, Boyadjian R, et al. Constitutive activation of LXR in macrophages regulates metabolic and inflammatory gene expression: identification of ARL7 as a direct target. J Lipid Res. 2011;52:531–539. doi: 10.1194/jlr.M010686. [DOI] [PMC free article] [PubMed] [Google Scholar]
- 42.Dehghan A, Dupuis J, Barbalic M, Bis JC, Eiriksdottir G, Lu C, et al. Meta-analysis of genome-wide association studies in >80 000 subjects identifies multiple loci for c-reactive protein levels. Circulation. 2011;123:731–738. doi: 10.1161/CIRCULATIONAHA.110.948570. [DOI] [PMC free article] [PubMed] [Google Scholar]
- 43.Engels S, Kohlhase J, McGaughran J. A SALL1 mutation causes a branchio-oto-renal syndrome-like phenotype. J Med Genet. 2000;37:458–460. doi: 10.1136/jmg.37.6.458. [DOI] [PMC free article] [PubMed] [Google Scholar]
- 44.Chasman DI, Schurks M, Anttila V, de Vries B, Schminke U, Launer LJ, et al. Genome-wide association study reveals three susceptibility loci for common migraine in the general population. Nat Genet. 2011;43:695–698. doi: 10.1038/ng.856. [DOI] [PMC free article] [PubMed] [Google Scholar]
- 45.Voets T, Droogmans G, Wissenbach U, Janssens A, Flockerzi V, Nilius B. The principle of temperature-dependent gating in cold- and heat-sensitive TRP channels. Nature. 2004;430:748–754. doi: 10.1038/nature02732. [DOI] [PubMed] [Google Scholar]
- 46.Proudfoot CJ, Garry EM, Cottrell DF, Rosie R, Anderson H, Robertson DC, et al. Analgesia mediated by the TRPM8 cold receptor in chronic neuropathic pain. Curr Biol. 2006;16:1591–1605. doi: 10.1016/j.cub.2006.07.061. [DOI] [PubMed] [Google Scholar]
- 47.Cirulli ET, Goldstein DB. Uncovering the roles of rare variants in common disease through whole-genome sequencing. Nat Rev Genet. 2010;11:415–425. doi: 10.1038/nrg2779. [DOI] [PubMed] [Google Scholar]
- 48.Chen J, Gu D, Huang J, Rao DC, Jaquish CE, Hixson JE, et al. Metabolic syndrome and salt sensitivity of blood pressure in non-diabetic people in China: a dietary intervention study. Lancet. 2009;373:829–835. doi: 10.1016/S0140-6736(09)60144-6. [DOI] [PMC free article] [PubMed] [Google Scholar]
Associated Data
This section collects any data citations, data availability statements, or supplementary materials included in this article.


