

Abstract
Multiple sclerosis (MS) is an inflammatory and neurodegenerative disease of the central nervous system. While current medication reduces relapses and inflammatory activity, it has only a modest effect on long-term disability and gray matter atrophy. Here, we have characterized the potential neuroprotective effects of testosterone on cerebral gray matter in a pilot clinical trial. Ten men with relapsing–remitting MS were included in this open-label phase II trial. Subjects were observed without treatment for 6 months, followed by testosterone treatment for another 12 months. Focal gray matter loss as a marker for neurodegeneration was assessed using voxel-based morphometry. During the non-treatment phase, significant voxel-wise gray matter decreases were widespread (p≤ 0.05 corrected). However, during testosterone treatment, gray matter loss was no longer evident. In fact, a significant gray matter increase in the right frontal cortex was observed (p≤ 0.05 corrected). These observations support the potential of testosterone treatment to stall (and perhaps even reverse) neurodegeneration associated with MS. Furthermore, they warrant the investigation of testosterone's neuroprotective effects in larger, placebo controlled MS trials as well as in other neurodegenerative diseases. This is the first report of gray matter increase as the result of treatment in MS.
Highlights
-
•
Ten men with MS were observed by MRI before and after testosterone treatment.
-
•
VBM demonstrated an arrest of gray matter atrophy as the result of treatment.
-
•
VBM demonstrated an increase of cortical gray matter as the result of treatment.
1. Introduction
Multiple sclerosis (MS) is a putative autoimmune disease characterized by a relapsing–remitting disease course leading to progressive disability, inflammation, and neurodegeneration (Vigeveno et al., 2012). MS relapses are associated with inflammation and the development of white matter lesions. As a result, anti-inflammatory treatments have been developed based on their ability to reduce relapses and white matter lesions. However, inflammatory activity and white matter lesion burden are only weakly correlated with clinical disease progression (Brex et al., 2002). Gray matter (GM) atrophy correlates strongly with clinical disability (Ontaneda et al., 2012; Rudick and Trapp, 2009; Vigeveno et al., 2012) and neurodegeneration in MS (Bo, 2009; Gold and Voskuhl, 2009; Rudick and Trapp, 2009; Vigeveno et al., 2012). This atrophy is evident from the earliest stages of disease, even before a clinically definite diagnosis can be made (Dalton et al., 2004) and continues throughout the disease course (Fisher et al., 2008). Consequently, GM atrophy has been suggested as a surrogate marker for disease progression and neurodegeneration in MS (Grassiot et al., 2009). GM atrophy has produced different results than inflammatory markers as outcome measures in clinical trials: while anti-inflammatory treatments in MS have been shown to reduce the occurrence of inflammatory markers such as new white matter lesions or relapse rates, their effects on GM atrophy and permanent disability have been modest (Hardmeier et al., 2005; Miller et al., 2007; Rao et al., 2002). To effectively target gray matter atrophy and diminish or prevent permanent disability in MS, neuroprotective therapies are needed.
Testosterone has been shown to be neuroprotective in animal studies (Gold and Voskuhl, 2009; Hussain et al., 2013) including the most widely used MS model, experimental autoimmune encephalomyelitis (EAE) (Bebo et al., 1999; Dalal et al., 1997; Ziehn et al., 2012). Analogously, we hypothesized that testosterone treatment in human disease may be neuroprotective and this would be reflected as a slowing of gray matter atrophy. Thus, the aim of the current study was to evaluate the effects of testosterone treatment on local changes in gray matter volume in MS. Changes in local gray matter volume were quantified using voxel-based morphometry (VBM), a sophisticated, objective whole-brain analysis technique (Draganski et al., 2004). Ten male patients with MS were enrolled in an open-label phase II clinical trial. The patients were observed prior to treatment for 6 months (observation phase), followed by a 12-month period of treatment with testosterone. To account for “wash-in effects”, this 12-month treatment period was divided into an initial 6-month transition phase, which allowed the drug to take action, followed by a 6-month protection phase. Statistically significant changes in GM concentration were mapped for each phase and the GM volume of these localized changes was plotted as a percent change. In addition, the annualized whole-brain GM atrophy rate was calculated in a supplementary analysis.
2. Material and methods
2.1. Study design and subjects
Participants were eligible if they met the criteria for clinically definite relapsing–remitting MS, had had at least one clinical relapse or the appearance of at least one enhancing lesion on MRI over the preceding two years, but were not receiving disease-modifying treatment. The original study has been described in detail (Sicotte et al., 2007). Briefly, this study was an open label phase II trial to assess the safety and tolerability of testosterone treatment using 10 g of gel containing 100 mg of testosterone (Androgel) applied topically daily for one year. The ten men enrolled had a median Expanded Disability Status Scale (EDSS) score of 2.0 (range: 1.5–2.5), a median disease duration of 12.5 years (range: 0.5–25.0 years), and a mean age of 46 years (range: 29–61 years). A cross-over trial design was chosen, where subjects served as their own controls. The protocol was approved by the University of California Los Angeles (UCLA) Human Subjects Protection Committee and the institutional review board of the Los Angeles Biomedical Research Institute at Harbor-UCLA Medical Center.
Contrast-enhanced, FLAIR, and high-resolution T1-weighted brain MRIs were obtained every month from baseline (month 0) until the end of the trial (month 18). All ten subjects completed all nineteen monthly scans (baseline plus monthly scans for 18 months) and were included in the current analysis. Testosterone treatment started at the end of month six. To allow the drug enough time to work (“wash-in”), we divided the trial into three parts: an untreated observation phase, a transition phase, and a protection phase. The observation phase was between baseline and end of month six. The transition phase was defined as end of month six through end of month twelve, leaving the last six months of the trial as the protection phase.
2.2. Image acquisition and processing
Magnetic resonance imaging (MRI) data was acquired on a 1.5 T Siemens Sonata scanner using a T1-weighted sequence (MPRAGE) with the following parameters: TR = 1900 ms, TE = 4.38 ms, flip angle = 15°, 128 sagittal slices, matrix: 256 × 256, and voxel dimensions: 0.9375 × 0.9375 × 1.2 mm3. In addition, a Fluid Attenuated Inversion Recovery (FLAIR) sequence was obtained during the same session using the following parameters: TR = 9140 ms, TE = 100 ms, flip angle = 180°, 50 axial slices, matrix: 256 × 256, and voxel dimensions: 0.9375 × 0.9375 × 3 mm3. Brain images were processed and examined using SPM8, the LST toolbox, and the VBM8 Toolbox following previously described methods (Luders et al., 2009; Schmidt et al., 2012). This processing consisted of lesion in-painting to prevent a possible confound of white matter lesions on tissue segmentation, followed by tissue-segmentation and normalization to a common reference space that allows for voxel-wise testing. Briefly, white matter lesions were automatically delineated using a lesion-growing algorithm (Schmidt et al., 2012) that used information from both the FLAIR and T1-weighted images simultaneously. The lesion growing algorithm was validated and fine-tuned using manual delineations of lesions as described (Schmidt et al., 2012). Based on these delineations, the lesions were in-painted as white matter in the T1-weighted scans (Chard et al., 2010; Schmidt et al., 2012) and the in-painted images were quality controlled to assure accuracy. To accommodate for the longitudinal design of this study, the lesion in-painted images were subsequently realigned for each subject using half-way registrations and corrected for bias-field inhomogeneities using the VBM8 Toolbox (see http://dbm.neuro.uni-jena.de/vbm8/VBM8-Manual.pdf).
Further preprocessing with this toolbox included tissue-classification into gray matter, white matter, and cerebrospinal fluid followed by a registration to MNI space using linear and non-linear transformations (Luders et al., 2009; Luders et al., 2013). More specifically, the tissue segmentation algorithm accounted for partial volume effects (Tohka et al., 2004), and was based on adaptive maximum a posteriori estimations (Rajapakse et al., 1997), a spatially adaptive non-local means denoising filter (Manjon et al., 2010), as well as a hidden Markov random field model (Cuadra et al., 2005). This tissue classification was independent of tissue probability maps (Luders et al., 2009; Luders et al., 2013), thus acting as an additional safeguard against a potential influence of lesions and altered geometry. Using affine registration and the non-linear DARTEL algorithm (Ashburner, 2007), the individual GM and WM segments in native-space were then normalized to the DARTEL-Template supplied with the VBM8 Toolbox (see http://dbm.neuro.uni-jena.de/vbm). This allowed for a comparison between time-points and subjects on voxel-level, yielding an extremely high regional specificity. A quality check was performed using tools from the VBM8 Toolbox and individual visual assessment, which yielded no artifacts or failed segmentation/normalization of the data. Finally, the gray matter segments were smoothed with a Gaussian kernel (12 mm full width at half maximum). These smoothed gray matter segments constituted the input for the statistical model. For visualization, a mean template from all subjects was created using normalized whole-brain images. This way, significant results from the statistical analysis were directly superimposed on the subjects' mean anatomy for anatomic localization of significant changes in local gray matter volume.
2.3. Statistical analyses
The statistical model included all ten subjects and their smoothed gray matter segments from four time points: at baseline, after 6 months (i.e. at the end of the observation phase), after 12 months (i.e. at the end of the transition phase), and after 18 months (i.e. at the end of the protection phase). This selection allowed us to investigate the voxel-wise volume changes over the three phases of the trial. Specifically, a “subject × condition” model was generated (with condition being the four time points). In this model the inter-individual differences between subjects were modeled by the subject factor, while changes between the time points were modeled for each subject by the condition factor. To control for false positives, threshold-free cluster enhancement (TFCE) (Smith and Nichols, 2009) in conjunction with family-wise error correction was used to detect significant clusters at p≤ 0.05.
Patterns of significant local change (i.e. significant gray matter decrease and increase) were visualized on a series of maximum intensity projections illustrating significant changes during the observation, transition, and protection phases. In a subsequent step, the exact locations of gray matter change during the observation and protection phases were mapped on the mean template, as described above. The time course of the volumetric changes for each significance cluster was extracted over all eighteen months of the trial and plotted as percent change to better assess the effects of testosterone therapy on gray matter volume.
2.4. Supplemental analyses
For the supplemental analysis of gray matter changes, lesion in-painted images for each time-point were corrected for bias-field inhomogeneities using the VBM8 Toolbox. Whole-brain masks were generated using the Brain Surface Extractor and manually corrected by a single investigator (AMG) in BrainSuite 13 (Shattuck and Leahy, 2002). Whole-brain masks were applied to the lesion in-painted images and segmented into cerebrospinal fluid, gray matter, and white matter using the FSL Automated Segmentation Tool (FAST) (Zhang et al., 2001), the segmentation tool used in SIENA and SIENAX (Smith et al., 2002; Smith et al., 2004). Annualized gray matter atrophy rates were calculated for each treatment phase for each patient by calculating the best-fit line through the gray matter volume measures during the treatment period and multiplying the slope of the line (change in gray matter volume/month) by 12 months. Differences in gray matter atrophy rates between the observation, transition, and protection phases were assessed using paired t-tests.
For the supplemental analysis of white matter changes, lesion masks for each time-point were warped to MNI space and their overlap calculated. In addition, lesion volumes in native space were calculated for every subject and month (months 0–18) to assess a change in lesion volume over time. Differences in overall lesion volume between the observation and protection phases were assessed using paired t-tests. Finally, the number of gadolinium-enhancing lesions was assessed for every subject and month (months 0–18). A non-parametric Friedman test was applied to test for differences in the number of enhancing lesions between the observation and protection phases (Supplement 2).
2.5. Scan–rescan reliability
To assess the scan–rescan reliability of our measurements, ten patients were scanned within two weeks of each other and had no clinical change in their disease between scans. We determined that the average GM volume difference was 0.22% (1.2 ± 1.8 cm3).
3. Results
During the observation phase, i.e. when patients received no treatment, we observed a significant voxel-wise GM loss across the entire brain (Fig. 1a, Table 1). This loss was widespread throughout cortical, subcortical, and cerebellar structures, extending from its maximum in the paracentral lobe along the central sulcus to the inferior frontal and superior parietal regions (p= 0.0004 at its maximum). The thalamus and basal ganglia also showed highly significant effects (Fig. 2a). Measurement of GM volume changes within this cluster over time demonstrated a significant decrease in the observation phase (p= 0.00006), which leveled off completely during the protection phase (Fig. 2b).
Fig. 1.
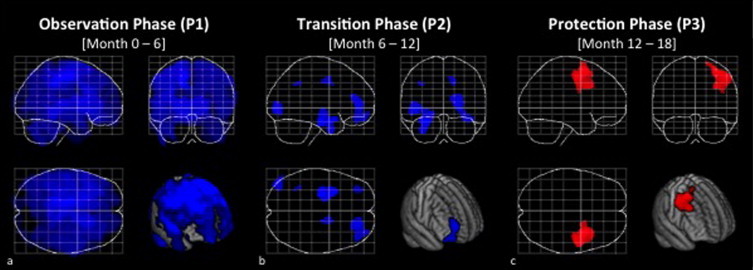
Regional gray matter volume increase in testosterone treated men with MS. (a) Significant gray matter changes during the observation phase, (b) the transition phase, and (c) the protection phase, threshold at p≤ 0.05, FWE-corrected for multiple comparisons. Displayed are maximum intensity projections superimposed onto the SPM standard glass brain together with a rendering onto the mean template. Decreases are shown in blue, increases in red. Note the significant gray matter increase (accompanied by a lack of significant gray matter decrease) during the protection phase.
Table 1.
Cluster-specific descriptors.
| Cluster | Number of voxels | FWE-corrected significance (p) | Coordinates in MNI space (x, y, z) |
|---|---|---|---|
| Decrease during observation phase: | |||
| 1 | 239,330 | 0.0004 | −14, −21, 48 |
| Decrease during transition phase: | |||
| 1 | 2293 | 0.012 | −26, −13, −20 |
| 2 | 1710 | 0.016 | 21, 48, 6 |
| 3 | 836 | 0.018 | −48, −82, −5 |
| 4 | 206 | 0.039 | 16, 0, 40 |
| 5 | 174 | 0.045 | −34, 47, −18 |
| 6 | 26 | 0.049 | −36, −48, 39 |
| Increase during protection phase: | |||
| 1 | 3719 | 0.011 | 33, 6, 61 |
p values and coordinates are provided for one representative local maximum within the significance cluster.
MNI = Montreal Neurological Institute.
Fig. 2.
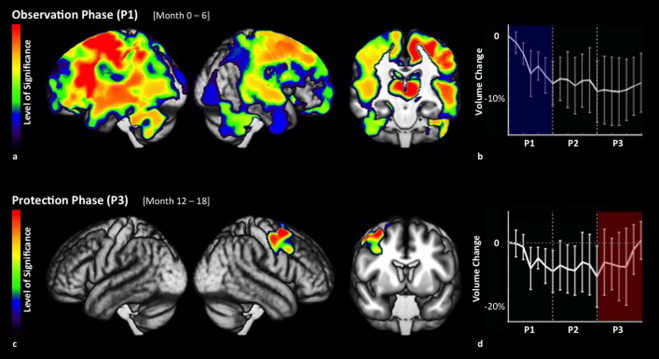
Regional volume changes over time. (a) Regional GM decreases during the observation phase. Heat maps visualize regional differences in the level of significance, thresholded at p≤ 0.05, FWE-corrected for multiple comparisons. (b) The widespread GM decreases seen during the observation phase (P1) were arrested during testosterone treatment (P2 and P3). No GM decrease was observed during the protection phase (P3). (c) Regional GM increases during the protection phase. Heat maps visualize regional differences in the level of significance. (d) In this cluster, testosterone treatment resulted in a GM increase during the protection phase (P3), which locally reversed the GM loss observed before treatment (P1).
During the transition phase, substantially less GM loss was observed and instead of one large, diffuse cluster, we observed several discrete clusters (Fig. 1b, Table 1). In the protection phase, essentially no further atrophy occurred. Instead, a significant increase in GM was observed in a cluster within the right frontal cortex (Fig. 1c), with a maximum located in the right middle frontal gyrus (p= 0.011) (Fig. 2c, Table 1). The posterior portion of this cluster of significant gray matter increase included the motor and premotor regions, while the maximum of significance was located anterior to these regions. Measurement of GM volume changes within this cluster over time demonstrated a significant decrease in the observation phase (p= 0.00034), followed by a significant increase in the protection phase (p= 0.002) (Fig. 2d). Overall, the cluster's volume at month 18 was not statistically different from the volume at baseline (p= 0.7048).
Whole-brain gray matter changes over the course of the trial were consistent with our findings of decreased localized gray matter atrophy (Supplement 1). The annualized gray matter atrophy rate in these untreated MS patients during the observation phase (2.87%) was consistent with previous reports of gray matter atrophy rates in similar untreated or placebo-treated MS populations, specifically annualized gray matter atrophy rates of 0.86%–3.57% in the context of 0.47%–0.94% annualized percent brain parenchymal volume atrophy rates have been reported (Chard et al., 2004; Chen et al., 2004; Dalton et al., 2004; Healy et al., 2009; Tiberio et al., 2005). This pretreatment atrophy was halted in the protection phase (0.18%).
The number and volume of enhancing lesions in white matter were low in the majority of subjects, consistent with the relatively benign clinical course of the subjects choosing to not take DMTs in this trial. Given the low level of enhancement at baseline in the cohort, it was not surprising that a reduction in enhancing lesions was not observed with testosterone treatment. In fact, neither the number of enhancing lesions nor the volume of FLAIR lesions changed significantly over time. Further, no temporal or spatial relationship between lesions and GM changes was observed (Supplement 2).
4. Discussion
The widespread GM loss observed herein by VBM during the observation phase is consistent with previous observations (Grassiot et al., 2009; Prinster et al., 2006; Vigeveno et al., 2012). Specifically, regional GM atrophy in MS has previously been shown in frontal cortical regions (Bendfeldt et al., 2009; Grassiot et al., 2009; Prinster et al., 2006), subcortical structures such as the thalamus (Ceccarelli et al., 2012; Grassiot et al., 2009; Vigeveno et al., 2012) and caudate (Ceccarelli et al., 2012; Grassiot et al., 2009; Prinster et al., 2006; Vigeveno et al., 2012), as well as in the cerebellum (Bendfeldt et al., 2009). However, during testosterone treatment this GM loss was stalled diffusely and even reversed in the right frontal cortex, suggesting a treatment-related recovery of the volume loss. To our knowledge, this is the first report of a treatment-induced GM volume increase in MS, which stands in stark contrast to previous outcomes on gray matter atrophy in anti-inflammatory treatment trials (Hardmeier et al., 2005; Miller et al., 2007; Rao et al., 2002). This observation is particularly interesting since we found no significant correlations between gray matter loss and changes in white matter lesion volume or in newly occurring lesions during testosterone treatment. Since lesions are thought to be a marker of inflammatory activity, this is consistent with testosterone's effects being neuroprotective rather than anti-inflammatory. This observation also supports the notion that MS pathogenesis consists of relatively distinct inflammatory and neuroprotective components. This in turn may explain why anti-inflammatory treatments prevent relapses and newly occurring lesions, but fail to exhibit a similar impact on long-term disability and gray matter atrophy (Hardmeier et al., 2005; Miller et al., 2007; Rao et al., 2002).
GM increases have previously been observed in healthy individuals (Bezzola et al., 2011; Boyke et al., 2008; Draganski et al., 2004; Draganski et al., 2006) and were hypothesized to be caused by increased synaptogenesis and/or neurogenesis (Draganski et al., 2006). Conversely, neuronal cell death and synaptic loss have been observed in gray matter lesions in MS by pathology (Bo, 2009), with these processes posited to underlie gray matter loss (Rudick and Trapp, 2009). Protective signaling pathways and neurotrophic signaling have also been shown to be activated in the gray matter of MS patients, though they do not appear to be sufficient to forestall gray matter loss (Bo, 2009). Testosterone treatment may shift the balance between degenerative and protective processes by acting on these signaling pathways, thus preserving neurons and synapses. Observations from testosterone treatment in the MS animal model, EAE, support this interpretation. Specifically, testosterone treatment resulted in increased synaptogenesis and preservation of neuronal counts in the cerebral cortex of mice with EAE (Ziehn et al., 2012). Increased synaptogenesis in EAE during testosterone treatment was associated with improved excitatory synaptic function (Ziehn et al., 2012), a well established electrophysiological biomarker for cognitive function in mice (Bach et al., 1995; Pompl et al., 1999; Seeger et al., 2004).
In view of this association between increased synaptogenesis and improved cognitive function during testosterone treatment in mice with EAE, it is interesting that cognitive test performance tended to improve in the present cohort, specifically spatial memory (p= 0.06) and information processing speed performance (p= 0.008) (Sicotte et al., 2007). Furthermore, the maximum of local gray matter increase in the right middle frontal gyrus matched a location that has previously been reported to be involved in cognitive tasks. Specifically, a meta-analysis of 275 functional imaging studies demonstrated activations in this region during sustained attention, working memory and episodic memory tasks (Cabeza and Nyberg, 2000). Interestingly, there were no significant changes in other standard MS clinical outcomes, namely EDSS score, 9-Hole Peg Test, or the 25 ft timed walk (Sicotte et al., 2007).
Since testosterone treatment is known to improve depression, decrease fatigue, and increase muscle mass in healthy men (Swerdloff and Wang, 2004), patients may have also been more active or exercised more during testosterone therapy. Indeed, subjects in this trial demonstrated a significant increase (p= 0.02) in muscle mass with testosterone treatment (Sicotte et al. 2007). Thus, testosterone-induced increased physical activity may have contributed to the observed increase in GM volume, analogous to training studies in healthy individuals (Bezzola et al., 2011; Boyke et al., 2008; Draganski et al., 2004; Draganski et al., 2006). Notably, either direct neuroprotection or the benefits of increased physical activity are highly desirable effects and either would represent a favorable therapeutic outcome. Although parts of the right primary motor and premotor regions were located within the cluster, the maximum of the increase was located anteriorly, in an area that is associated with cognitive processing (Cabeza and Nyberg, 2000). Increased physical activity as the sole reason for the observed increase in gray matter may therefore seem unlikely, however, no final conclusions regarding mechanisms can be drawn from the present data. Further studies will therefore be needed to distinguish between possible mechanistic contributions to the observed increase in regional brain gray matter during testosterone treatment.
Gray matter increase can be caused by an increase in CNS resident cells or substructures (more neurons, dendrites, axons, synapses, glia or a combination thereof). Inflammation and edema are also possible causes that are not specific to the gray matter, but are nonetheless important to differentiate, particularly in an inflammatory disease like MS. While we cannot differentiate between increases in various CNS resident cells/substructures, we can comment on the possibility of whether the GM increase was induced by inflammation. White matter lesions and relapses are reliable biomarkers and clinical markers, respectively, for inflammation in MS. No significant increases in lesions or relapses were observed during the course of the trial (Sicotte et al. 2007), which speaks against increases in inflammation and edema. Indeed, the only changes in clinical outcomes were improvements in processing speed and spatial memory. Thus, neurogenesis, synaptogenesis, and increased dendritic arborization are consistent with the observed clinical effects and suggest a neuroprotective action of testosterone treatment.
How generalizable our findings are to all men with MS remains unclear. On the one hand, the subjects had refused treatment with DMTs, which at the time were all given by injection, thereby creating a selection bias for men with relatively benign disease, as evidenced by the low median EDSS score of 2 at 12 years of disease duration. This might suggest that men in this trial may have had relatively lower gray matter atrophy rates, with this lower rate potentially more amenable to testosterone treatment. On the other hand, treatment with DMTs has shown some effect on slowing gray matter atrophy rates, so the fact that our subjects were all untreated might suggest that the men in this trial may have had relatively higher gray matter atrophy rates. Notably, upon assessment of whole gray matter, the annualized atrophy rate of this group was 2.87%, a rate consistent with previously established rates ranging from 0.86% to 3.57% in the MS population.
In theory, a crossover design may be subject to scanner drift as a potential confound, especially if all subjects are enrolled and scanned at the same time. In the present study this potential confound was minimized by the dispersed enrollment over time, i.e. the last subject underwent his baseline scan nearly a year after the first. Effectively, this means that subjects enrolled later in the trial were still in the observation phase (pretreatment control phase), while the earlier subjects were already in the protection phase (maximum treatment effect phase). This makes scanner drift as the driving cause for the observed changes unlikely. Furthermore, scanner drift occurs very gradually over relatively long periods of time. In our study, only 6 months separated the observation phase from the treatment protection phase, the two phases with remarkably different levels of GM atrophy.
The small number of subjects included in this pilot trial restricted the analysis to large effects only, leaving smaller effects undetected. That is, controlling for type I errors (false positives) leads to an increased risk of type II errors (false negatives) in a small sample. On the one hand, this means that we cannot infer that reaching non-significance is the same as non-existence, since we rigorously controlled for type I errors. Therefore, the failure of some GM losses to reach statistical significance may simply mean that their effects were too small to detect with this small sample size. This is equally true for GM increases that did not reach statistical significance. Accordingly, significant results with this small sample size are thus indicative of large and relevant effects. Since this result of halted GM atrophy and the highly novel increase in GM during testosterone therapy has potentially important implications for MS therapies, this study must be replicated and confirmed in a larger trial. Furthermore, the effects of testosterone treatment may theoretically be influenced by age, disease duration, and/or disease severity; however, we found no effects due to our small sample size. Thus, investigating these possible interactions in a trial with a larger sample size is needed.
5. Conclusions
In summary, these observations may reflect the potential of testosterone treatment to reverse gray matter atrophy associated with MS. In addition, the present results corroborate the notion that MS is composed of inflammatory and neurodegenerative components, both of which will have to be addressed for effective treatment. Since current treatments in MS aim primarily to prevent inflammation and white matter lesions, testosterone may provide a complementary treatment aimed at neuroprotection via the preservation/restoration of gray matter. As testosterone treatment in this phase II pilot trial raised no safety concerns (Sicotte et al., 2007), a larger trial that directly assesses such combination treatment is warranted. In addition, several recent reports indicate that testosterone is also being considered in other acute and chronic neurodegenerative diseases (Byers et al., 2012; Carroll and Rosario, 2012; Ransome, 2012). Our observations in MS may therefore encourage and further warrant the study of testosterone in other neurodegenerative diseases.
Acknowledgments
This work was supported by the National Institutes of Health [K24NS062117 (R.R.V.); JF2107 (N.L.S.)], by the German Ministry of Education and Research (BMBF) [01EV0709 (C.G.)], by the National Multiple Sclerosis Society [CA1028 and RG3239 (R.R.V.)], as well as by funding from the Skirball Foundation, the Conrad N. Hilton Foundation, and the Sherak Family Foundation. Additional support was provided by grant M01 RR00425 from the General Clinical Research Centers at Harbor-UCLA Medical Center (RSS).
Footnotes
Supplementary material associated with this article can be found, in the online version, at doi:10.1016/j.nicl.2014.03.001.
Appendix. Supplementary materials
Supplementary material for Neuroprotective effects of testosterone treatment in men with multiple sclerosis.
Supplementary material for Neuroprotective effects of testosterone treatment in men with multiple sclerosis.
References
- Ashburner J. A fast diffeomorphic image registration algorithm. Neuroimage. 2007;38:95–113. doi: 10.1016/j.neuroimage.2007.07.007. 17761438 [DOI] [PubMed] [Google Scholar]
- Bach M.E., Hawkins R.D., Osman M., Kandel E.R., Mayford M. Impairment of spatial but not contextual memory in CaMKII mutant mice with a selective loss of hippocampal LTP in the range of the theta frequency. Cell. 1995;81:905–915. doi: 10.1016/0092-8674(95)90010-1. 7781067 [DOI] [PubMed] [Google Scholar]
- Bebo B.F., Jr., Schuster J.C., Vandenbark A.A., Offner H. Androgens alter the cytokine profile and reduce encephalitogenicity of myelin-reactive T cells. Journal of Immunology. 1999;162:35–40. 9886367 [PubMed] [Google Scholar]
- Bendfeldt K., Kuster P., Traud S., Egger H., Winklhofer S., Mueller-Lenke N., Naegelin Y., Gass A., Kappos L., Matthews P.M., Nichols T.E., Radue E.W., Borgwardt S.J. Association of regional gray matter volume loss and progression of white matter lesions in multiple sclerosis — a longitudinal voxel-based morphometry study. Neuroimage. 2009;45:60–67. doi: 10.1016/j.neuroimage.2008.10.006. 19013533 [DOI] [PubMed] [Google Scholar]
- Bezzola L., Mérillat S., Gaser C., Jäncke L. Training-induced neural plasticity in golf novices. Journal of Neuroscience: the Official Journal of the Society for Neuroscience. 2011;31:12444–12448. doi: 10.1523/JNEUROSCI.1996-11.2011. 21880905 [DOI] [PMC free article] [PubMed] [Google Scholar]
- B⊘ L. The histopathology of grey matter demyelination in multiple sclerosis. Acta Neurologica Scandinavica. Supplementum. 2009:51–57. doi: 10.1111/j.1600-0404.2009.01216.x. 19566500 [DOI] [PubMed] [Google Scholar]
- Boyke J., Driemeyer J., Gaser C., Buchel C., May A. Training-induced brain structure changes in the elderly. Journal of Neuroscience: the Official Journal of the Society for Neuroscience. 2008;28:7031–7035. doi: 10.1523/JNEUROSCI.0742-08.2008. 18614670 [DOI] [PMC free article] [PubMed] [Google Scholar]
- Brex P.A., Ciccarelli O., O'Riordan J.I., Sailer M., Thompson A.J., Miller D.H. A longitudinal study of abnormalities on MRI and disability from multiple sclerosis. New England Journal of Medicine. 2002;346:158–164. doi: 10.1056/NEJMoa011341. 11796849 [DOI] [PubMed] [Google Scholar]
- Byers J.S., Huguenard A.L., Kuruppu D., Liu N.K., Xu X.M., Sengelaub D.R. Neuroprotective effects of testosterone on motoneuron and muscle morphology following spinal cord injury. Journal of Comparative Neurology. 2012;520:2683–2696. doi: 10.1002/cne.23066. [DOI] [PMC free article] [PubMed] [Google Scholar]
- Cabeza R., Nyberg L. Imaging cognition II: an empirical review of 275 PET and fMRI studies. Journal of Cognitive Neuroscience. 2000;12:1–47. doi: 10.1162/08989290051137585. [DOI] [PubMed] [Google Scholar]
- Carroll J.C., Rosario E.R. The potential use of hormone-based therapeutics for the treatment of Alzheimer's disease. Current Alzheimer Research. 2012;9:18–34. doi: 10.2174/156720512799015109. 22329650 [DOI] [PubMed] [Google Scholar]
- Ceccarelli A., Jackson J.S., Tauhid S., Arora A., Gorky J., Dell'Oglio E., Bakshi A., Chitnis T., Khoury S.J., Weiner H.L., Guttmann C.R., Bakshi R., Neema M. The impact of lesion in-painting and registration methods on voxel-based morphometry in detecting regional cerebral gray matter atrophy in multiple sclerosis. AJNR. American Journal of Neuroradiology. 2012;33:1579–1585. doi: 10.3174/ajnr.A3083. 22460341 [DOI] [PMC free article] [PubMed] [Google Scholar]
- Chard D.T., Griffin C.M., Rashid W., Davies G.R., Altmann D.R., Kapoor R., Barker G.J., Thompson A.J., Miller D.H. Progressive grey matter atrophy in clinically early relapsing–remitting multiple sclerosis. Multiple Sclerosis (Houndmills, Basingstoke, England) 2004;10:387–391. doi: 10.1191/1352458504ms1050oa. 15327034 [DOI] [PubMed] [Google Scholar]
- Chard D.T., Jackson J.S., Miller D.H., Wheeler-Kingshott C.A. Reducing the impact of white matter lesions on automated measures of brain gray and white matter volumes. Journal of Magnetic Resonance Imaging: JMRI. 2010;32:223–228. doi: 10.1002/jmri.22214. 20575080 [DOI] [PubMed] [Google Scholar]
- Chen J.T., Narayanan S., Collins D.L., Smith S.M., Matthews P.M., Arnold D.L. Relating neocortical pathology to disability progression in multiple sclerosis using MRI. Neuroimage. 2004;23:1168–1175. doi: 10.1016/j.neuroimage.2004.07.046. 15528116 [DOI] [PubMed] [Google Scholar]
- Cuadra M.B., Cammoun L., Butz T., Cuisenaire O., Thiran J.P. Comparison and validation of tissue modelization and statistical classification methods in T1-weighted MR brain images. IEEE Transactions on Medical imaging. 2005;24:1548–1565. doi: 10.1109/TMI.2005.857652. 16350916 [DOI] [PubMed] [Google Scholar]
- Dalal M., Kim S., Voskuhl R.R. Testosterone therapy ameliorates experimental autoimmune encephalomyelitis and induces a T helper 2 bias in the autoantigen-specific T lymphocyte response. Journal of Immunology. 1997;159:3–6. [PubMed] [Google Scholar]
- Dalton C.M., Chard D.T., Davies G.R., Miszkiel K.A., Altmann D.R., Fernando K., Plant G.T., Thompson A.J., Miller D.H. Early development of multiple sclerosis is associated with progressive grey matter atrophy in patients presenting with clinically isolated syndromes. Brain : a Journal of Neurology. 2004;127:1101–1107. doi: 10.1093/brain/awh126. 14998914 [DOI] [PubMed] [Google Scholar]
- Draganski B., Gaser C., Busch V., Schuierer G., Bogdahn U., May A. Neuroplasticity: changes in grey matter induced by training. Nature. 2004;427:311–312. doi: 10.1038/427311a. 14737157 [DOI] [PubMed] [Google Scholar]
- Draganski B., Gaser C., Kempermann G., Kuhn H.G., Winkler J., Büchel C., May A. Temporal and spatial dynamics of brain structure changes during extensive learning. Journal of Neuroscience: the Official Journal of the Society for Neuroscience. 2006;26:6314–6317. doi: 10.1523/JNEUROSCI.4628-05.2006. 16763039 [DOI] [PMC free article] [PubMed] [Google Scholar]
- Fisher E., Lee J.C., Nakamura K., Rudick R.A. Gray matter atrophy in multiple sclerosis: a longitudinal study. Annals of Neurology. 2008;64:255–265. doi: 10.1002/ana.21436. 18661561 [DOI] [PubMed] [Google Scholar]
- Gold S.M., Voskuhl R.R. Estrogen and testosterone therapies in multiple sclerosis. Progress in Brain Research. 2009;175:239–251. doi: 10.1016/S0079-6123(09)17516-7. 19660660 [DOI] [PMC free article] [PubMed] [Google Scholar]
- Grassiot B., Desgranges B., Eustache F., Defer G. Quantification and clinical relevance of brain atrophy in multiple sclerosis: a review. Journal of Neurology. 2009;256:1397–1412. doi: 10.1007/s00415-009-5108-4. 19353226 [DOI] [PubMed] [Google Scholar]
- Hardmeier M., Wagenpfeil S., Freitag P., Fisher E., Rudick R.A., Kooijmans M., Clanet M., Radue E.W., Kappos L. Rate of brain atrophy in relapsing MS decreases during treatment with IFNbeta-1a. Neurology. 2005;64:236–240. doi: 10.1212/01.WNL.0000149516.30155.B8. 15668419 [DOI] [PubMed] [Google Scholar]
- Healy B., Valsasina P., Filippi M., Bakshi R. Sample size requirements for treatment effects using gray matter, white matter and whole brain volume in relapsing–remitting multiple sclerosis. Journal of Neurology, Neurosurgery, and Psychiatry. 2009;80:1218–1223. doi: 10.1136/jnnp.2008.154732. 19204021 [DOI] [PMC free article] [PubMed] [Google Scholar]
- Hussain R., Ghoumari A.M., Bielecki B., Steibel J., Boehm N., Liere P., Macklin W.B., Kumar N., Habert R., Mhaouty-Kodja S., Tronche F., Sitruk-Ware R., Schumacher M., Ghandour M.S. The neural androgen receptor: a therapeutic target for myelin repair in chronic demyelination. Brain : a Journal of Neurology. 2013;136:132–146. doi: 10.1093/brain/aws284. 23365095 [DOI] [PMC free article] [PubMed] [Google Scholar]
- Luders E., Gaser C., Narr K.L., Toga A.W. Why sex matters: brain size independent differences in gray matter distributions between men and women. Journal of Neuroscience: the Official Journal of the Society for Neuroscience. 2009;29:14265–14270. doi: 10.1523/JNEUROSCI.2261-09.2009. 19906974 [DOI] [PMC free article] [PubMed] [Google Scholar]
- Luders E., Kurth F., Toga A.W., Narr K.L., Gaser C. Meditation effects within the hippocampal complex revealed by voxel-based morphometry and cytoarchitectonic probabilistic mapping. Frontiers in Psychology. 2013;4:398. doi: 10.3389/fpsyg.2013.00398. 23847572 [DOI] [PMC free article] [PubMed] [Google Scholar]
- Manjón J.V., Coupé P., Martí-Bonmatí L., Collins D.L., Robles M. Adaptive non-local means denoising of MR images with spatially varying noise levels. Journal of Magnetic Resonance Imaging: JMRI. 2010;31:192–203. doi: 10.1002/jmri.22003. 20027588 [DOI] [PubMed] [Google Scholar]
- Miller D.H., Soon D., Fernando K.T., MacManus D.G., Barker G.J., Yousry T.A., Fisher E., O'Connor P.W., Phillips J.T., Polman C.H., Kappos L., Hutchinson M., Havrdova E., Lublin F.D., Giovannoni G., Wajgt A., Rudick R., Lynn F., Panzara M.A., Sandrock A.W. MRI outcomes in a placebo-controlled trial of natalizumab in relapsing MS. Neurology. 2007;68:1390–1401. doi: 10.1212/01.wnl.0000260064.77700.fd. 17452584 [DOI] [PubMed] [Google Scholar]
- Ontaneda D., Hyland M., Cohen J.A. Multiple sclerosis: new insights in pathogenesis and novel therapeutics. Annual Review of Medicine. 2012;63:389–404. doi: 10.1146/annurev-med-042910-135833. 21888515 [DOI] [PubMed] [Google Scholar]
- Pompl P.N., Mullan M.J., Bjugstad K., Arendash G.W. Adaptation of the circular platform spatial memory task for mice: use in detecting cognitive impairment in the APP(SW) transgenic mouse model for Alzheimer's disease. Journal of Neuroscience Methods. 1999;87:87–95. doi: 10.1016/S0165-0270(98)00169-1. 10065997 [DOI] [PubMed] [Google Scholar]
- Prinster A., Quarantelli M., Orefice G., Lanzillo R., Brunetti A., Mollica C., Salvatore E., Morra V.B., Coppola G., Vacca G., Alfano B., Salvatore M. Grey matter loss in relapsing–remitting multiple sclerosis: a voxel-based morphometry study. Neuroimage. 2006;29:859–867. doi: 10.1016/j.neuroimage.2005.08.034. 16203159 [DOI] [PubMed] [Google Scholar]
- Rajapakse J.C., Giedd J.N., Rapoport J.L. Statistical approach to segmentation of single-channel cerebral MR images. IEEE Transactions on Medical imaging. 1997;16:176–186. doi: 10.1109/42.563663. 9101327 [DOI] [PubMed] [Google Scholar]
- Ransome M.I. Androgen function in the pathophysiology and treatment of male Huntington's disease patients. Journal of Neuroendocrinology. 2012;24:1275–1283. doi: 10.1111/j.1365-2826.2012.02347.x. 22672384 [DOI] [PubMed] [Google Scholar]
- Rao A.B., Richert N., Howard T., Lewis B.K., Bash C.N., McFarland H.F., Frank J.A. Methylprednisolone effect on brain volume and enhancing lesions in MS before and during IFNbeta-1b. Neurology. 2002;59:688–694. doi: 10.1212/WNL.59.5.688. 12221158 [DOI] [PubMed] [Google Scholar]
- Rudick R.A., Trapp B.D. Gray-matter injury in multiple sclerosis. New England Journal of Medicine. 2009;361:1505–1506. doi: 10.1056/NEJMcibr0905482. 19812410 [DOI] [PubMed] [Google Scholar]
- Schmidt P., Gaser C., Arsic M., Buck D., Förschler A., Berthele A., Hoshi M., Ilg R., Schmid V.J., Zimmer C., Hemmer B., Mühlau M. An automated tool for detection of FLAIR-hyperintense white-matter lesions in multiple sclerosis. Neuroimage. 2012;59:3774–3783. doi: 10.1016/j.neuroimage.2011.11.032. 22119648 [DOI] [PubMed] [Google Scholar]
- Seeger T., Fedorova I., Zheng F., Miyakawa T., Koustova E., Gomeza J., Basile A.S., Alzheimer C., Wess J. M2 muscarinic acetylcholine receptor knockout mice show deficits in behavioral flexibility, working memory, and hippocampal plasticity. Journal of Neuroscience: the Official Journal of the Society for Neuroscience. 2004;24:10117–10127. doi: 10.1523/JNEUROSCI.3581-04.2004. 15537882 [DOI] [PMC free article] [PubMed] [Google Scholar]
- Shattuck D.W., Leahy R.M. BrainSuite: an automated cortical surface identification tool. Medical image Analysis. 2002;6:129–142. doi: 10.1016/S1361-8415(02)00054-3. 12045000 [DOI] [PubMed] [Google Scholar]
- Sicotte N.L., Giesser B.S., Tandon V., Klutch R., Steiner B., Drain A.E., Shattuck D.W., Hull L., Wang H.J., Elashoff R.M., Swerdloff R.S., Voskuhl R.R. Testosterone treatment in multiple sclerosis: a pilot study. Archives of Neurology. 2007;64:683–688. doi: 10.1001/archneur.64.5.683. 17502467 [DOI] [PubMed] [Google Scholar]
- Smith S.M., Jenkinson M., Woolrich M.W., Beckmann C.F., Behrens T.E., Johansen-Berg H., Bannister P.R., De Luca M., Drobnjak I., Flitney D.E., Niazy R.K., Saunders J., Vickers J., Zhang Y., De Stefano N., Brady J.M., Matthews P.M. Advances in functional and structural MR image analysis and implementation as FSL. Neuroimage. 2004;23(Suppl. 1):S208–S219. doi: 10.1016/j.neuroimage.2004.07.051. 15501092 [DOI] [PubMed] [Google Scholar]
- Smith S.M., Nichols T.E. Threshold-free cluster enhancement: addressing problems of smoothing, threshold dependence and localisation in cluster inference. Neuroimage. 2009;44:83–98. doi: 10.1016/j.neuroimage.2008.03.061. 18501637 [DOI] [PubMed] [Google Scholar]
- Smith S.M., Zhang Y., Jenkinson M., Chen J., Matthews P.M., Federico A., De Stefano N. Accurate, robust, and automated longitudinal and cross-sectional brain change analysis. Neuroimage. 2002;17:479–489. doi: 10.1006/nimg.2002.1040. 12482100 [DOI] [PubMed] [Google Scholar]
- Swerdloff R.S., Wang C. Androgens and the ageing male. Best Practice & Research. Clinical Endocrinology & Metabolism. 2004;18:349–362. doi: 10.1016/j.beem.2004.03.011. 15261842 [DOI] [PubMed] [Google Scholar]
- Tiberio M., Chard D.T., Altmann D.R., Davies G., Griffin C.M., Rashid W., Sastre-Garriga J., Thompson A.J., Miller D.H. Gray and white matter volume changes in early RRMS: a 2-year longitudinal study. Neurology. 2005;64:1001–1007. doi: 10.1212/01.WNL.0000154526.22878.30. 15781816 [DOI] [PubMed] [Google Scholar]
- Tohka J., Zijdenbos A., Evans A. Fast and robust parameter estimation for statistical partial volume models in brain MRI. Neuroimage. 2004;23:84–97. doi: 10.1016/j.neuroimage.2004.05.007. 15325355 [DOI] [PubMed] [Google Scholar]
- Vigeveno R.M., Wiebenga O.T., Wattjes M.P., Geurts J.J., Barkhof F. Shifting imaging targets in multiple sclerosis: from inflammation to neurodegeneration. Journal of Magnetic Resonance Imaging: JMRI. 2012;36:1–19. doi: 10.1002/jmri.23578. 22696123 [DOI] [PubMed] [Google Scholar]
- Zhang Y., Brady M., Smith S. Segmentation of brain MR images through a hidden Markov random field model and the expectation–maximization algorithm. IEEE Transactions on Medical imaging. 2001;20:45–57. doi: 10.1109/42.906424. 11293691 [DOI] [PubMed] [Google Scholar]
- Ziehn M.O., Avedisian A.A., Dervin S.M., Umeda E.A., O'Dell T.J., Voskuhl R.R. Therapeutic testosterone administration preserves excitatory synaptic transmission in the hippocampus during autoimmune demyelinating disease. Journal of Neuroscience: the Official Journal of the Society for Neuroscience. 2012;32:12312–12324. doi: 10.1523/JNEUROSCI.2796-12.2012. 22956822 [DOI] [PMC free article] [PubMed] [Google Scholar]
Associated Data
This section collects any data citations, data availability statements, or supplementary materials included in this article.
Supplementary Materials
Supplementary material for Neuroprotective effects of testosterone treatment in men with multiple sclerosis.
Supplementary material for Neuroprotective effects of testosterone treatment in men with multiple sclerosis.