

Abstract
Background:
Genetics and genomics have radically altered our understanding of breast cancer progression. However, the genomic basis of various histopathologic features of breast cancer is not yet well-defined.
Materials and Methods:
The Cancer Genome Atlas (TCGA) is an international database containing a large collection of human cancer genome sequencing data. cBioPortal is a web tool developed for mining these sequencing data. We performed mining of TCGA sequencing data in an attempt to characterize the genomic features correlated with breast cancer histopathology. We first assessed the quality of the TCGA data using a group of genes with known alterations in various cancers. Both genome-wide gene mutation and copy number changes as well as a group of genes with a high frequency of genetic changes were then correlated with various histopathologic features of invasive breast cancer.
Results:
Validation of TCGA data using a group of genes with known alterations in breast cancer suggests that the TCGA has accurately documented the genomic abnormalities of multiple malignancies. Further analysis of TCGA breast cancer sequencing data shows that accumulation of specific genomic defects is associated with higher tumor grade, larger tumor size and receptor negativity. Distinct groups of genomic changes were found to be associated with the different grades of invasive ductal carcinoma. The mutator role of the TP53 gene was validated by genomic sequencing data of invasive breast cancer and TP53 mutation was found to play a critical role in defining high tumor grade.
Conclusions:
Data mining of the TCGA genome sequencing data is an innovative and reliable method to help characterize the genomic abnormalities associated with histopathologic features of invasive breast cancer.
Keywords: Breast cancer, cBioPortal, data mining, histopathology, the cancer genome atlas, tumor grade
INTRODUCTION
Breast cancer is the most prevalent malignancy in American women. In the year 2013, it is estimated that there will be over 200,000 new breast cancer cases that will claim close to 40,000 lives.[1] For over a 100 years, the pathologic diagnosis of cancer was based on morphology using a combination of histological (architectural) criteria and cytological features as assessed by a pathologist using a conventional light (bright-field) microscope. Once a cancer diagnosis is established, further classification, grading and staging is typically performed in order to evaluate the state of the disease and to assess the prognosis. The “pathologic diagnosis" is then used to guide treatment decisions. The state of the art of breast pathology practice has changed little over the years, except for the introduction of several biomarkers, i.e., estrogen receptor (ER or ESR1), progesterone receptor (PR, or PGR) and human epidermal growth factor 2 (HER2 or ERBB2), which are used to further guide treatment and help predict prognosis.[2] More recently, molecular techniques have been used to provide new insights into breast cancer classification and prognosis based on gene expression patterns. In particular, gene expression profiling has been used to classify invasive breast cancer into luminal A, luminal B, HER2-enriched and basal-like types, all of which are closely correlated with a few defined patterns of ER, PR and HER2 expression.[3,4] For example, the luminal A phenotype primarily identifies low grade, ER and/or PR positive, HER2-negative breast carcinomas. In contrast, tumors in the basal-like group are primarily ER, PR and HER2 negative (“triple negative”). Although evaluation of HER2 protein and/or gene status is the only genetic marker routinely used to guide clinical patient care, several gene-based tests including OncotypeDx, Mammaprint, Prosigna (PAM50) and BRCA1/2 mutation tests have been shown to be of value in helping to guide clinical decision making by predicting prognosis and the efficacy of adjuvant therapy in caring for early stage breast cancer patients.[5,6]
Expression variations in genes and their proteins are no doubt critical players in neoplastic initiation, development and progression. With the completion of the human genome project and rapid progress in genomic sequencing technology, personalized (precision) medicine has become a promising and attainable goal for both cancer diagnosis and its treatment. In the past, publicly available databases that contained pathology information along with genomic and genetic data have not been readily available.[7] Since the pathology diagnosis currently remains the gold standard for many cancer related studies, this defect in the public databases made it difficult to independently validate many published genomic findings and made it almost impossible to perform reliable bioinformatic data mining.[7] Large scale whole genome sequencing projects such as The Cancer Genome Atlas (TCGA)[8] with both sequencing and pathologic data have provided an unprecedented opportunity for biomedical researchers and practitioners to explore disease mechanisms multidimensionally at a genomic scale. TCGA is a whole genome sequencing project started in 2006 and sponsored by the National Cancer Institute and the National Human Genome Research Institute. It began with sequencing three types of malignancies, glioblastoma multiforme, squamous carcinoma of the lung and serous cystadenocarcinoma of the ovary. The data was made publicly available in 2011 and its volume has been doubling every 7 months.[9] Since then, TCGA has collected data on 30 different cancers.[8] When possible, the patient's pathology report, microscopic images and clinical treatment information were also made publicly available. The combination of both genomic sequencing data and clinical and pathologic information in TCGA provides an unparalleled opportunity for identifying clinically important biomarkers by data mining.
Clinicians and pathologists are arguably among the best positioned to use TCGA data to improve patient care. However, it is almost impossible for a non-bioinformatician to effectively use these data due to their complexity. Fortunately, a TCGA data mining tool, cBioPortal[10,11] has recently been developed by investigators at the Memorial Sloan-Kettering Cancer Center and is publicly available as a web application (http://www.cbioportal.org/public-portal/). The cBioPortal stores multiple large scale, integrated cancer genomic data sets from both the TCGA and from the International Cancer Genome Consortium. This includes data on somatic mutations, deoxyribonucleic acid (DNA) copy-number alterations, messenger ribonucleic acid (mRNA) and micro ribonucleic acid expression, DNA methylation and protein and phosphoprotein expression. More importantly, it provides a user-friendly platform via a web service to access, analyze and display these large data sets.
To date, correlation between histologic features of cancers and specific genetic and genomic alterations has been limited. With the availability of abundant whole genome sequencing data and the corresponding pathology library within the TCGA and the cBioPortal data mining tool, we sought to evaluate the genetic drivers of certain pathologic features of breast cancers. To that end, we first assessed the quality of the sequencing data in TCGA by using a biological internal control. We then correlated genetic abnormalities such as mutation frequency and gene copy number variance (CNV) with traditional histopathologic features including tumor size, tumor grade and lymph node status, as well as the status of the ER, PR and HER2 as determined by routine clinical assays. Our results suggest that mining of TCGA genome sequencing data is an innovative and reliable method to define the genomic abnormalities associated with cancer histopathology.
MATERIALS AND METHODS
TCGA Data
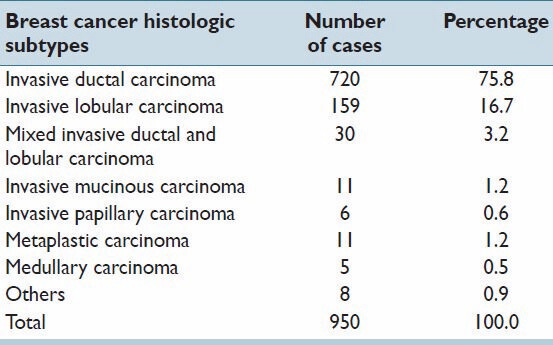
The invasive breast carcinoma (TCGA, Provisional) dataset includes data from 950 cases with pathology reports as of September 1, 2013.[8,12] The case breakdown is presented in Table 1. The pathology report for each patient was reviewed by a pathologist and histologic type, grade, tumor size, lymph node status and ER, PR and HER2 status were extracted. Corresponding gene sequencing results for each breast cancer patient were also obtained for a group of selected genes. The study focused on the analysis of the cases with gene sequencing data including mutation counts (MC) and CNV. The cases without mutation and CNV data were excluded from this study. Therefore, the final cohort used for this analysis included 771 cases.
Table 1.
Distribution of breast cancer histopathology subtypes in TCGA provisional breast cancer project
Data Mining with cBioPortal
All data mining was performed using cBioPortal.[10,11] The selection of breast cancer associated genes with significant mutations or CNV was determined using MutSig[13] and Gistic2[14] from the Broad Institute, Boston, MA. A total of 76 genes significant for mutation and 1130 genes significant for CNV were selected based on statistical significance as measured by the false discovery rate (FDR < 0.1). In this study, we focused on analysis of the data from the top 10 genes with the most prominent mutation or CNV. All searches were performed according to the cBioPortal's online instructions.
Selection of the Breast Cancer Diagnostic Features
The pathologic criteria selected to determine correlation with sequencing data included those considered to be the most important in clinical practice based on the current WHO classification of breast cancer[2] and the AJCC cancer staging manual, 7th edition.[15] These include tumor grade, tumor size, lymph node status and ER/PR/HER2 status.
Bioinformatic Analysis
Class discovery analysis of mutated or amplified genes by unsupervised hierarchical clustering was performed using the Gene Pattern program (Broad Institute, Boston, MA) according to the online instructions.
Statistical Analysis
All tests were performed using the IBM SPSS Statistics Version 21.0 (IBM Corporation, Armonk, New York). Descriptive statistics were used to calculate the mean and standard deviation. One factor ANOVA and Student's t-test were used to compare the overall differences in MCs or CNV between groups. Chi-square tests were utilized to compare the difference in MCs and CNV for selected genes. All P values were two sided and a P < 0.05 was considered to be statistically significant.
RESULTS
Characteristic Mutation Distribution Across Various Malignant Neoplasms
We first explored the feasibility of characterizing the genomic features of various malignant neoplasms using TCGA genome sequencing data. A novel bioinformatic experiment was designed to test the quality of TCGA data using a group of genes with a known pattern of genetic abnormalities, serving as the biological internal control. The rationale for this design was our belief that at least some of the known gene sequence changes or patterns of change should be identifiable when working with data mining through a high quality database. We, thus, examined the gene sequencing data for a group of genes with known changes that correlated with a specific cancer. The selected genes were: TP53 and CDKN2A (p16), two genes with a known high mutation frequency in many different types of malignant neoplasms;[16,17] VHL, APC and KRAS, three genes with known high tissue specific mutational events in corresponding cancer types;[18,19,20] and ACTB and GAPDH, two so called “house-keeping” genes, with non-specific and background levels of mutational changes across various types of neoplasms. The result of this bioinformatic experiment is shown in Figure 1. As expected, TP53 and CDKN2A showed a high mutational frequency across multiple types of malignant neoplasms recorded in TCGA. VHL and APC/KRAS showed a high mutation frequency only in clear cell renal cell carcinoma and colorectal carcinoma, respectively. The mutations identified in ACTB and GAPDH were, as predicted, non-specific across various types of tumors and generally low, representing random background mutational events in cancer. More convincingly, TCGA mutation profiles accurately reflected multiple mutational events known to be involved in several well-characterized carcinogenesis models. For example, colorectal carcinogenesis from mucosal epithelium leading to carcinoma is well-understood and characterized by a multi-step model of mutational events involving the APC, KRAS, DCC and TP53 genes.[21] As shown in Figure 1, this mutation profile is highly consistent with the one identified in TCGA genome sequencing data. The other example is the well-documented role of the VHL gene mutation in the development of clear cell renal cell carcinoma.[18] In contrast, the VHL gene mutation rate is, as expected, at a background level in papillary renal cell carcinoma. These data suggest that the TCGA genome sequencing data has accurately captured the genetic abnormalities in the many types of tumors it has collected. Therefore, we decided to further focus on the breast cancer genome sequencing data in TCGA to explore the feasibility of genomic characterization of breast cancer histopathology.
Figure 1.
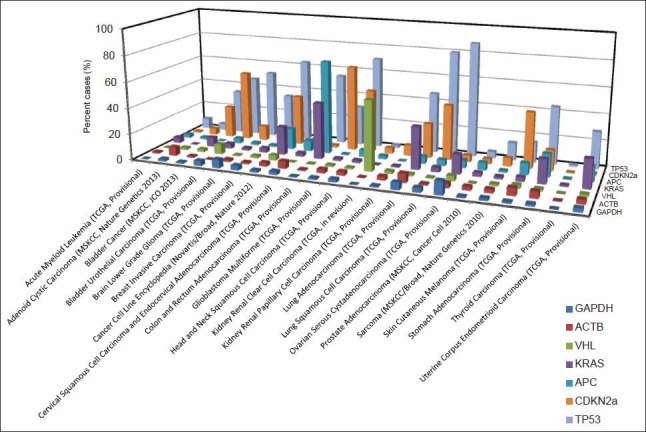
The mutation landscape for a group of known genes across various types of cancer in The Cancer Genome Atlas. The incidence of a group of genes with known cancer specific mutations were searched via cBioPortal. Each bar represents the percent mutation for a selected gene in a particular study. The data were obtained as of September 1, 2013
Breast Cancer Genetic Abnormalities and Histopathology
The cBioPortal database has collected a large corpus of breast cancer genome sequencing data. By September 1, 2013, there were five large breast cancer genome sequencing projects collated. The largest one, the provisional TCGA invasive breast carcinoma project, includes gene sequencing data from 950 breast cancer patients.[10] This is also the only cohort with an embedded corresponding pathology report. As shown in Table 1, among the cases with both genome sequencing data and a pathologic diagnosis, the majority are invasive ductal carcinoma (IDC; 714, 76.9%) and about one sixth are invasive lobular carcinoma (148, 15.9%). This frequency of breast carcinoma histopathologic types parallels that occurring in the general US population.[22]
We first examined the gene MC and gene CNV across the genomes of various histopathologic groups of invasive breast carcinoma. As shown in Figure 2, two high grade histologic subtypes of breast cancer, medullary carcinoma and metaplastic carcinoma, have a significantly higher MC and more CNV across the genome as compared to other types of breast cancer, including IDC. This suggests that gene mutation and copy number changes may be closely associated with the grade of invasive breast cancer. Due to the small number of the cases in these two high grade breast cancers, we further validated the correlation of MC and CNV in relation to the histologic grade in an analysis limited to the IDC, recognizing that IDC accounted for about 75% of the cases in the cohort and is known for its heterogeneity in histologic grade. Among the 641 IDC cases with both tumor grade and genome sequencing data in TCGA, 59 were grade I, 278 grade II and 304 grade III. As it has been shown in Figure 3, both MC and CNV were significantly different among the three groups and clearly increased as histologic grade increased (P < 0.001); the number of MC and CNV in grade III tumors was almost double that in grade I tumors.
Figure 2.
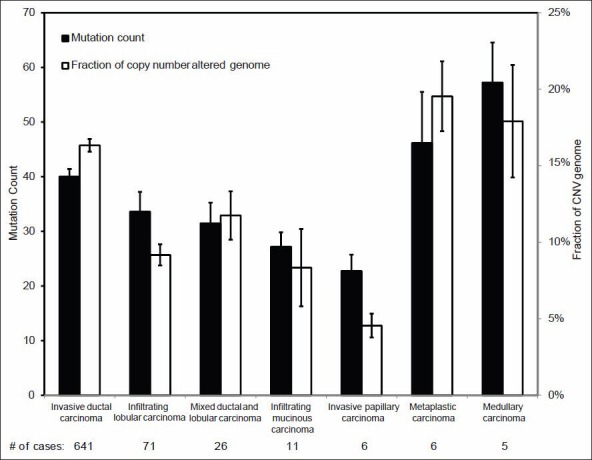
Mutation count (MC) and copy number variance in different breast cancer histologic subtypes. Each column represents the gene MC or the fraction of copy number altered genome (mean ± 1SD) for all the genes sequenced in each case
Figure 3.
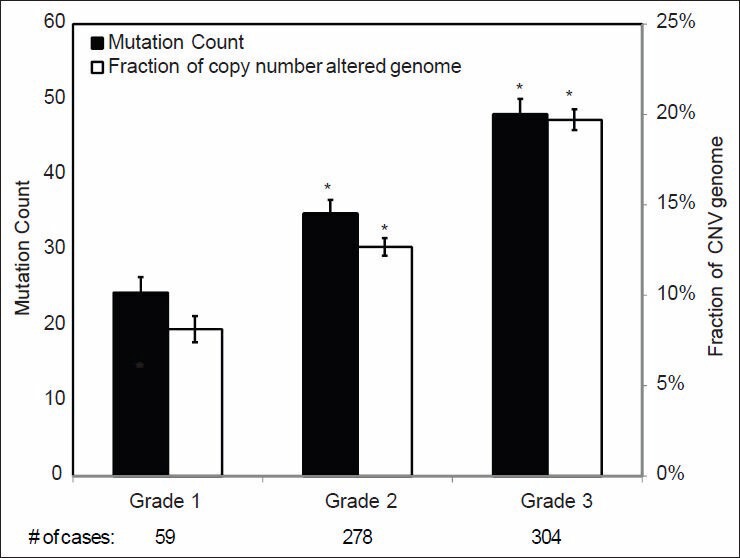
Mutation count and copy number variance in different grades of invasive ductal carcinoma. Statistical significance was calculated by one factor ANOVA and *indicates P < 0.05
Correlations between MC and CNV and tumor size and lymph node status are shown in Figures 4 and 5, respectively. Significant differences in overall MC among T1 (<2.0 cm), T2 (2-5 cm) and T3 (>5 cm) tumors were identified. Significant differences in CNV were also identified between T1 and T2 tumors. Interestingly, no statistically significant differences in MC or CNV were identified between tumors with and without lymph node metastases [Figure 5].
Figure 4.
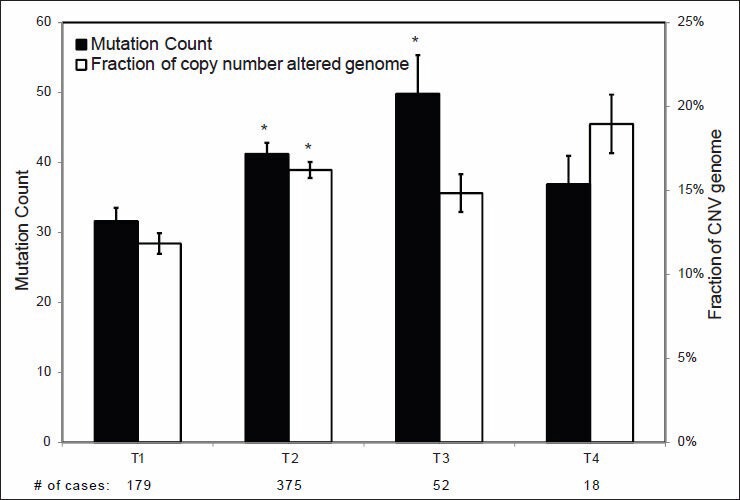
Mutation count and copy number variance in relation to tumor sizes. Statistical significance was calculated by one factor ANOVA and *indicates P < 0.05
Figure 5.
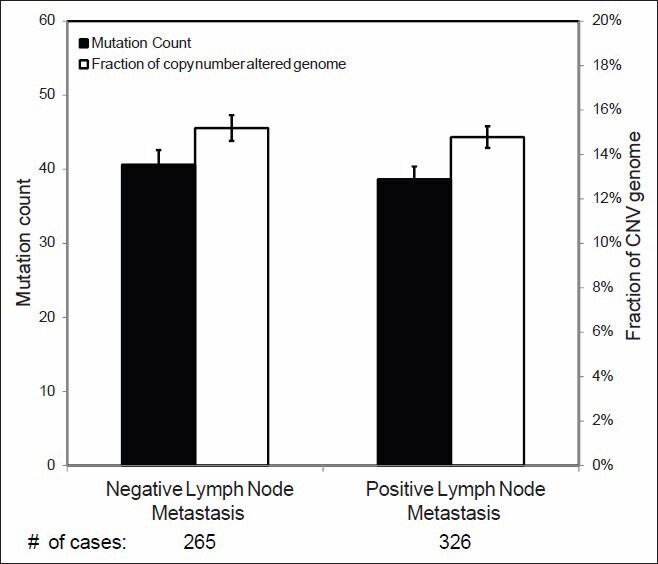
Mutation count and copy number variance in relation to lymph node status. Statistical significance was calculated by Student's t-test and shows no difference (P > 0.05)
Breast Cancer Genetic Abnormalities and Biomarker Status
As it can be observed in Figure 6, ER or PR positive and HER2 negative breast carcinomas have significantly lower MC and CNV than HER2 positive and triple negative (ER-/PR-/HER2-) tumors. Similar findings were also found when tumors were classified according to molecular subtype [Figure 7]: Luminal A tumors showed a significantly lower MC and CNV compared with luminal B, HER2-enriched and basal-like tumors.
Figure 6.
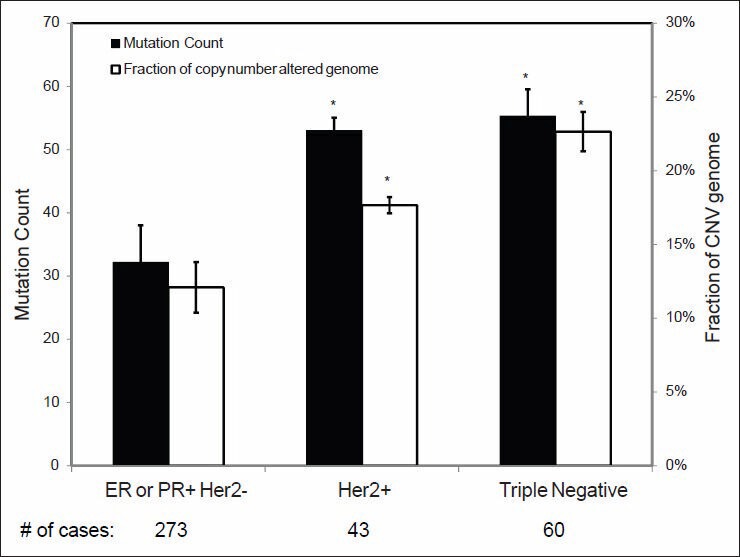
Mutation count and copy number variance in relation to the breast carcinomas with different prognostic marker status. Statistical significance was calculated by one factor ANOVA and *indicates P < 0.05
Figure 7.
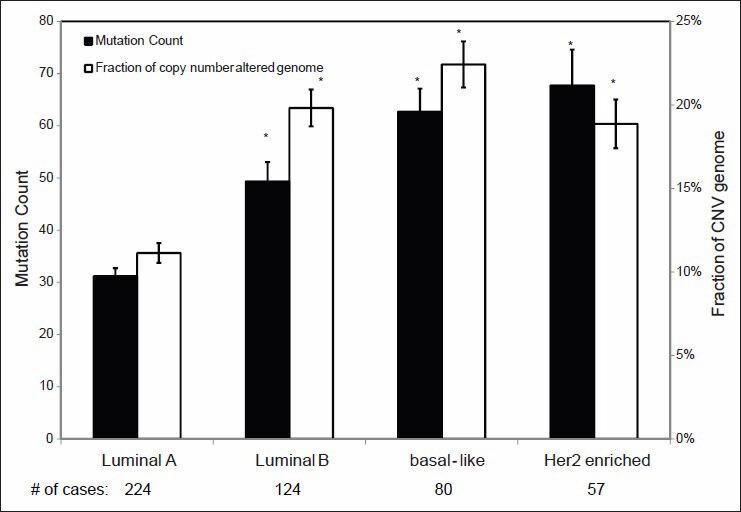
Mutation count and copy number variance in relation to the breast carcinomas of various gene expression based classes. Statistical significance was calculated by one factor ANOVA and *indicates P < 0.05
Individual Genetic Abnormalities Associated with Grade of Invasive Breast Cancer
In current clinical practice, breast cancers are graded based on the scoring of three histologic features: Tubule formation, nuclear pleomorphism and mitotic count.[2] This system works fairly robustly in classifying grade I and grade III invasive breast cancers, but there is a high degree of variability in classifying grade II tumors. Since genetic changes are the drivers of malignant transformation and tumor progression, we further investigated how individual mutations and CNV are correlated with tumor grade. We selected a group of breast cancer associated genes with significant mutations and/or CNV using MutSig and Gistic2 (Broad Institute, Boston, MA), respectively. While a long list of genes with a significant number of mutations or CNV were identified as defined statistically by their FDR, we focused our study on the top 10 genes with the highest number of gene mutations or CNV. As it has been shown in Figure 8, multiple gene sequence changes were found to be statistically associated with the grade of IDCs. These include mutations in TP53, PIK3CA, MAP3K1, GATA3 and CDH1 and CNV in COX6C, ERBB2, GATA3, MAP3K1, MYC, NDRG1 and PIK3CA. The gene showing the most prominent difference in mutation frequency in relation to tumor grade was TP53. Mutations in this gene were identified in 58% of grade III invasive breast carcinomas when compared with only 4% of grade I lesions. Interestingly, PIK3CA mutations were even more frequent than TP53 mutations, but were inversely correlated with grade. PIK3CA mutations were identified in 61% of grade I invasive breast cancers when compared with only 27% rate in grade III tumors. Furthermore, the role of genes with a high number of mutations appears different from those with a high CNV. The genes found with the most prominent CNV were MYC, COX6C and NDRG1. High CNV in these genes were also associated with higher histologic grade.
Figure 8.
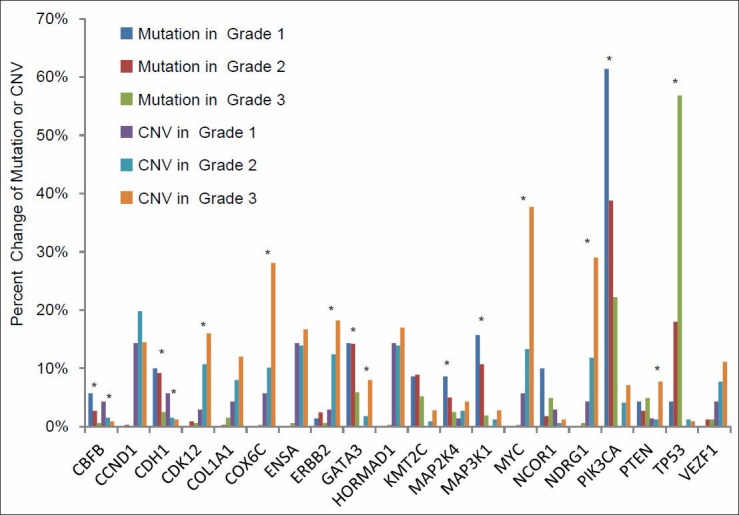
Percent cases with gene mutation and copy number variance (CNV) in different grades of invasive ductal carcinoma. The genes with a significant mutation count and CNV were selected by MutSig and Gistic2, respectively. Statistical significance was calculated by a Chi-square test and *indicates P < 0.05
We further performed the gene class discovery analysis of MC and CNV in relation to the IDC grade by unsupervised hierarchical clustering using the incidence of the top 10 genes with the most frequent MC and CNV. As shown in Figure 9, these genes were clustered into three major groups in relation to tumor grade: Group 1, CDH1, GATA3 and MAP3K1 gene mutations associated with grade I IDC; group 2, AOAH, TBX3, CBFB, MAP2K4, PIK3CA gene mutations associated with grade II IDC; and group 3, TP53 and VEZF1 gene mutations associated with grade III tumors. Similar correlations were also present in a group of genes with significant CNV.
Figure 9.
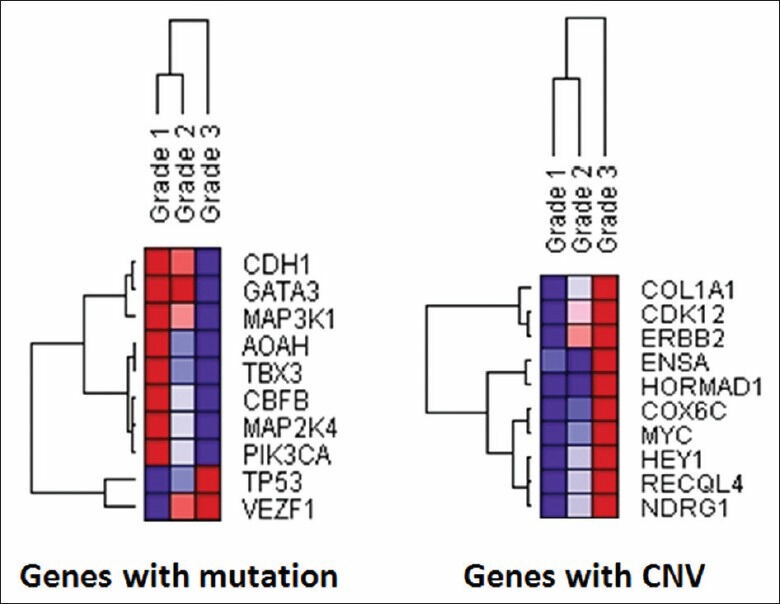
Unsupervised hierarchical clustering of the genes with the most significant genetic changes in relation to histologic grades. An unsupervised hierarchical clustering analysis was performed for the top 10 genes with the most significant mutation count (left) and copy number variance (right) in relation to invasive ductal carcinoma histologic grades using the Gene Pattern software (Broad Institute, Boston, MA) and its default parameters of average linkage and Pearson's correlation. Purple and red colors represent the lowest and highest incidence, respectively, for the genetic changes identified
TP53 gene mutations were found to be significantly associated with higher grade IDC in this study. Since the TP53 gene is a known cancer driver gene associated with a mutator phenotype, we further examined its correlation with the genome wide incidence of gene sequence changes. As shown in Figure 10, the total MCs in the IDC cases with TP53 mutations were significantly higher than those without TP53 mutations. Similar findings were also present when the cases are stratified by grade. However, no significant difference in the total MC was identified for the tumors with and without PIK3CA mutation (data not shown).
Figure 10.
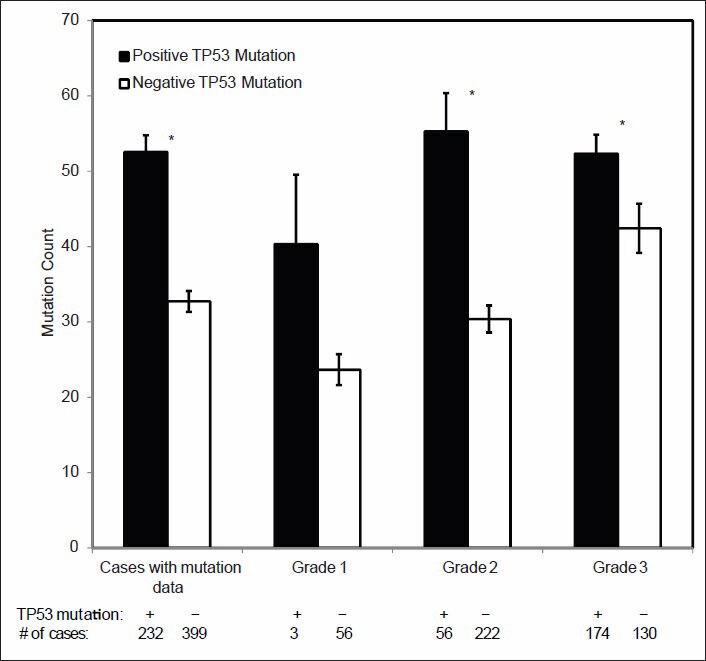
Correlation of TP53 mutation, total mutation count (MC) and histologic grade. The difference of genome wide MCs between invasive ductal carcinoma and its various histologic subgroups with and without TP53 mutation were compared. Statistical significance was calculated by Student's t-test and *indicates P < 0.05
DISCUSSION
An understanding of the genomic alterations associated with specific pathologic features of breast cancers can provide new insights into the molecular underpinnings of the changes pathologists have for decades observed under the microscope. This may also provide new opportunities for pathologists to identify novel molecular tools to guide personalized patient care.
In this study, we first tested the data quality in TCGA/cBioPortal by examining a group of known gene sequence changes. A similar approach was attempted in the past by some of us to examine the quality of high throughput gene expression analysis for data mining.[23] In that study, a panel of genes with known expression patterns were used to test the quality of gene expression data in the Cancer Genome Anatomy Project (http://cgap.nci.nih.gov/cgap.html). After validation, a data mining strategy using combined multiple high throughput analyses was adopted and led to the discovery of three differentially expressed breast cancer related genes, ANXA1, GATA3 and AGR2, whereas simultaneously verifying the value of increased expression of ERBB2 as an internal control.[23,24] These genes were then validated[24,25,26] and all were later found to be biologically important breast cancer associated genes.[27,28,29] In the current study, we applied the same principle to examining the data quality in TCGA. We analyzed the TCGA genome sequencing data for genetic changes in a group of genes with known tissue specific mutation patterns. These include genes with a high mutation rate across many types of malignancies such as TP53 and CDKN2A (p16); genes with tissue specific mutations such as VHL in clear cell renal cell carcinoma and APC and KRAS in colorectal cancer; and ACTB and GAPDH genes with baseline genetic changes. The results, as shown in Figure 1, are highly consistent with the known genetic changes in the corresponding types of cancer and suggest that TCGA genome sequencing data has accurately captured the genetic changes in many types of malignancies. Although many bioinformatic approaches have been developed for the quality control of next generation sequencing projects,[30,31] to the best of our knowledge this study is the first attempt to use a “biological internal control" as a quality control measure to improve data mining of high throughput sequencing data.
Breast cancer is histologically heterogeneous with over a dozen histologic variants.[2] IDCs or invasive carcinomas of no special type comprise approximately 80% of these tumors.[2,22] IDCs, however, comprise a highly heterogeneous group of tumors that vary with regard to their architecture, cytology, biomarker status, treatment response and prognosis. Some correlations between breast cancer histopathology and molecular genetic changes were well-established. For example, histologically low grade tumors are usually ER positive and triple negative and HER2 positive cancers are usually histologically high grade. In this study, we have for first time systematically investigated the genomic changes in relation to the important diagnostic and prognostic features of breast cancers including tumor size, grade, lymph node status and ER, PR and HER2 status. Our results demonstrated that genomic abnormalities were significantly associated with tumor size, histologic grade and ER/PR/HER2 status. A higher number of genome wide MCs and CNV were associated with larger tumor size, higher tumor grade and receptor negativity. These results suggest that accumulation of these genetic abnormalities is probably among the primary driving forces of tumor progression. Interestingly, no significant difference in genomic defects was identified between cases of IDC with and without lymph node metastases [Figure 5]. This finding suggests that no additional genetic changes in the cancer cells themselves are required for metastasis and that genetic changes other than mutation or CNV along with alterations in the tumor microenvironment likely contribute more to this process.[32,33] Although many genetic changes were found to be associated with various pathologic features, no single gene was identified to be responsible for a particular histologic feature in this study.
Histologic grade is one of the most important criteria predicting prognosis and determining treatment for IDC. The prevailing view is that low and high grade tumors have different sets of genetic abnormalities and develop along distinct carcinogenic pathways.[34,35] However, the genetic changes and the molecular pathway of grade II tumors are not well defined. Several studies have applied gene expression profiling to classifying the grade II tumors and found that a significant portion of these tumors could be reclassified as either grade I or grade III based on their gene expression signatures.[36,37] In our study, significant differences were identified in both overall genomic sequence changes [Figure 3] as well as in sequence changes of many individual genes [Figure 8]. Of interest, the patterns of genetic changes in individual genes are quite different in different grades of tumors. For examples, two genes, TP53 and PIK3CA, with the most prominent mutational events in invasive breast carcinoma, have an opposite frequency of mutations in low and high grade tumors, respectively. Although these findings have been reported before,[12] how these mutations contribute to formation of particular histologic grades is not well understood. We then performed an unsupervised hierarchical clustering analysis to look into the correlation of individual prevalent genetic changes with histologic grade based on the incidences of gene mutation of the top 10 genes with the most prominent genetic changes in IDC. The analysis revealed three major gene mutation clusters in relation to respective tumor grade: Group 1, CDH1, GATA3 and MAP3K1 gene mutations associated with grade I IDC; groups 2, AOAH, CBFB, MAP2K4, PIK3CA and TBX3 gene mutations associated with grade II IDC; and groups 3, TP53 and VEZF1 gene mutations associated with grade III tumors. Similar correlations are also present in a group of genes with significant CNVs. The analysis validated the association of TP53 mutation with high tumor grade; however, it suggested that PIK3CA might be more associated with grade II tumors. While this observation requires further experimental validation, our data suggest that tumor grade has a strong genetic basis which could be defined by a limited number of gene sequence changes and that all three histologic grades of IDC may have distinct sets of genetic changes.
In this study, TP53 mutations were found to be significantly associated with high grade IDC [Figure 8]. Wild-type TP53 normally functions in the maintenance of genetic stability and its mutation has been proposed as being responsible for a mutator phenotype in cancer cells.[38,39] In our study, the total MC in the IDC cases with TP53 mutation was significantly higher than those without TP53 mutations. Similar findings were also observed when the cases were stratified by grade. Although the difference is not statistically significant in the grade I IDC group probably due to the small number of cases with TP53 mutation (3 cases only), the few grade I IDC with TP53 mutations in this study had a much higher number of genome wide MCs than those without a TP53 mutation [Figure 10]. While it is possible that these tumors might still be grade I, it is also possible that they may represent the grade I tumors in transition to a higher grade, or they may be simply misgraded due to either sampling issue or misinterpretation of the histology.
Most molecular assays currently used in clinical practice to improve and personalize the care of patients with breast cancer are gene expression based. However it is likely that sequencing approaches, including targeted sequencing, whole exome sequencing, or even whole genome sequencing will be used increasingly to further attain the goals of precision oncology. In addition, with the ongoing progress in computational quantitative pathology,[40,41,42] one promising research direction is to correlate genomic alterations with quantitative histopathologic features, which may, in turn, provide the pathologist with a novel high throughput, slide based method to help identify the underlying genetic aberrations and guide clinical decision making.
CONCLUSION
In summary, we performed data mining using the genome sequencing data from TCGA via cBioPortal to examine the genomic basis of breast cancer histopathology. This analysis shows that accumulation of genomic alterations contributes to larger tumor size, higher tumor grade and receptor negativity. Distinct groups of genomic changes were found to be associated with different grades of IDC. TP53 mutation was found to play an important role in defining high tumor grade and is associated with a mutator phenotype. Our study suggests that data mining of the human genome sequencing data is an innovative and reliable method to define the genomic abnormalities associated with cancer histopathology.
ACKNOWLEDGEMENT
Dr. Shen is a recipient of New Faculty Development Award in Cancer Research from Young Supporters Board of the UAB Comprehensive Cancer Center.
Footnotes
Available FREE in open access from: http://www.jpathinformatics.org/text.asp?2014/5/1/3/126147
REFERENCES
- 1.Bethesda: National Cancer Institute; [Last cited on 2013 Sep 01]. SEER Stat Fact Sheets: Breast. Available from: http://www.seer.cancer.gov/statfacts/html/breast.html#incidence-mortality . [Google Scholar]
- 2.Lakhani SR, Ellis IO, Schnitt SJ, Tan PH, van de Vijver MJ. Vol. 4. France: IARC; 2012. WHO Classification of Tumors of the Breast. [Google Scholar]
- 3.Perou CM, Sørlie T, Eisen MB, van de Rijn M, Jeffrey SS, Rees CA, et al. Molecular portraits of human breast tumours. Nature. 2000;406:747–52. doi: 10.1038/35021093. [DOI] [PubMed] [Google Scholar]
- 4.Sørlie T, Perou CM, Tibshirani R, Aas T, Geisler S, Johnsen H, et al. Gene expression patterns of breast carcinomas distinguish tumor subclasses with clinical implications. Proc Natl Acad Sci U S A. 2001;98:10869–74. doi: 10.1073/pnas.191367098. [DOI] [PMC free article] [PubMed] [Google Scholar]
- 5.Harbeck N, Sotlar K, Wuerstlein R, Doisneau-Sixou S. Molecular and protein markers for clinical decision making in breast cancer: Today and tomorrow. Cancer Treat Rev. 2013 doi: 10.1016/j.ctrv.2013.09.014. [In press] [DOI] [PubMed] [Google Scholar]
- 6.Morgan D, Sylvester H, Lucas FL, Miesfeldt S. Cancer prevention and screening practices among women at risk for hereditary breast and ovarian cancer after genetic counseling in the community setting. Fam Cancer. 2009;8:277–87. doi: 10.1007/s10689-009-9242-z. [DOI] [PubMed] [Google Scholar]
- 7.Berman JJ. Informatics research using publicly available pathology data. J Pathol Inform. 2011;2:5. doi: 10.4103/2153-3539.76154. [DOI] [PMC free article] [PubMed] [Google Scholar]
- 8.Bethesda: National Institute of Health; [Last cited on 2013 Sep 01]. The Cancer Genome Atlas (TCGA) Available from: http://www.cancergenome.nih.gov . [Google Scholar]
- 9.Robbins DE, Grüneberg A, Deus HF, Tanik MM, Almeida JS. A self-updating road map of The Cancer Genome Atlas. Bioinformatics. 2013;29:1333–40. doi: 10.1093/bioinformatics/btt141. [DOI] [PMC free article] [PubMed] [Google Scholar]
- 10.Cerami E, Gao J, Dogrusoz U, Gross BE, Sumer SO, Aksoy BA, et al. The cBio cancer genomics portal: An open platform for exploring multidimensional cancer genomics data. Cancer Discov. 2012;2:401–4. doi: 10.1158/2159-8290.CD-12-0095. [DOI] [PMC free article] [PubMed] [Google Scholar]
- 11.Gao J, Aksoy BA, Dogrusoz U, Dresdner G, Gross B, Sumer SO, et al. Integrative analysis of complex cancer genomics and clinical profiles using the cBioPortal. Sci Signal. 2013;6:pl1. doi: 10.1126/scisignal.2004088. [DOI] [PMC free article] [PubMed] [Google Scholar]
- 12.Cancer Genome Atlas Network. Comprehensive molecular portraits of human breast tumours. Nature. 2012;490:61–70. doi: 10.1038/nature11412. [DOI] [PMC free article] [PubMed] [Google Scholar]
- 13.Boston: Broad Institute; [Last cited on 2013 Sep 01]. MutSig. Available from: http://www.broadinstitute.org/software/cprg/?q=node/35 . [Google Scholar]
- 14.Boston: Broad Institute; [Last cited on 2013 Sep 01]. GISTIC2. Available from: http://www.broadinstitute.org/software/cprg/?q=node/31 . [Google Scholar]
- 15.7th ed. New York: Springer; 2010. American Joint Committee on Cancer. The AJCC Cancer Staging Manual. [Google Scholar]
- 16.France: University P.M CURIE; [Last cited on 2013 Sep 01]. P53 mutation and cancer: The TP53 mutation database. Available from: http://www.p53freefr/Database/p53_cancer_db.html . [Google Scholar]
- 17.Kamb A, Gruis NA, Weaver-Feldhaus J, Liu Q, Harshman K, Tavtigian SV, et al. A cell cycle regulator potentially involved in genesis of many tumor types. Science. 1994;264:436–40. doi: 10.1126/science.8153634. [DOI] [PubMed] [Google Scholar]
- 18.Gnarra JR, Tory K, Weng Y, Schmidt L, Wei MH, Li H, et al. Mutations of the VHL tumour suppressor gene in renal carcinoma. Nat Genet. 1994;7:85–90. doi: 10.1038/ng0594-85. [DOI] [PubMed] [Google Scholar]
- 19.Nishisho I, Nakamura Y, Miyoshi Y, Miki Y, Ando H, Horii A, et al. Mutations of chromosome 5q21 genes in FAP and colorectal cancer patients. Science. 1991;253:665–9. doi: 10.1126/science.1651563. [DOI] [PubMed] [Google Scholar]
- 20.Delattre O, Olschwang S, Law DJ, Melot T, Remvikos Y, Salmon RJ, et al. Multiple genetic alterations in distal and proximal colorectal cancer. Lancet. 1989;2:353–6. doi: 10.1016/s0140-6736(89)90537-0. [DOI] [PubMed] [Google Scholar]
- 21.Cho KR, Vogelstein B. Genetic alterations in the adenoma - Carcinoma sequence. Cancer. 1992;70:1727–31. doi: 10.1002/1097-0142(19920915)70:4+<1727::aid-cncr2820701613>3.0.co;2-p. [DOI] [PubMed] [Google Scholar]
- 22.Eheman CR, Shaw KM, Ryerson AB, Miller JW, Ajani UA, White MC. The changing incidence of in situ and invasive ductal and lobular breast carcinomas: United States, 1999-2004. Cancer Epidemiol Biomarkers Prev. 2009;18:1763–9. doi: 10.1158/1055-9965.EPI-08-1082. [DOI] [PubMed] [Google Scholar]
- 23.Shen D, He J, Chang HR. In silico identification of breast cancer genes by combined multiple high throughput analyses. Int J Mol Med. 2005;15:205–12. [PubMed] [Google Scholar]
- 24.Shen D, Chang HR, Chen Z, He J, Lonsberry V, Elshimali Y, et al. Loss of annexin A1 expression in human breast cancer detected by multiple high-throughput analyses. Biochem Biophys Res Commun. 2005;326:218–27. doi: 10.1016/j.bbrc.2004.10.214. [DOI] [PubMed] [Google Scholar]
- 25.Shen D, Nooraie F, Elshimali Y, Lonsberry V, He J, Bose S, et al. Decreased expression of annexin A1 is correlated with breast cancer development and progression as determined by a tissue microarray analysis. Hum Pathol. 2006;37:1583–91. doi: 10.1016/j.humpath.2006.06.001. [DOI] [PubMed] [Google Scholar]
- 26.Yoon NK, Maresh EL, Shen D, Elshimali Y, Apple S, Horvath S, et al. Higher levels of GATA3 predict better survival in women with breast cancer. Hum Pathol. 2010;41:1794–801. doi: 10.1016/j.humpath.2010.06.010. [DOI] [PMC free article] [PubMed] [Google Scholar]
- 27.Maschler S, Gebeshuber CA, Wiedemann EM, Alacakaptan M, Schreiber M, Custic I, et al. Annexin A1 attenuates EMT and metastatic potential in breast cancer. EMBO Mol Med. 2010;2:401–14. doi: 10.1002/emmm.201000095. [DOI] [PMC free article] [PubMed] [Google Scholar]
- 28.Yan W, Cao QJ, Arenas RB, Bentley B, Shao R. GATA3 inhibits breast cancer metastasis through the reversal of epithelial-mesenchymal transition. J Biol Chem. 2010;285:14042–51. doi: 10.1074/jbc.M110.105262. [DOI] [PMC free article] [PubMed] [Google Scholar]
- 29.Verma S, Salmans ML, Geyfman M, Wang H, Yu Z, Lu Z, et al. The estrogen- responsive Agr2 gene regulates mammary epithelial proliferation and facilitates lobuloalveolar development. Dev Biol. 2012;369:249–60. doi: 10.1016/j.ydbio.2012.06.030. [DOI] [PMC free article] [PubMed] [Google Scholar]
- 30.Medvedev P, Stanciu M, Brudno M. Computational methods for discovering structural variation with next-generation sequencing. Nat Methods. 2009;6:S13–20. doi: 10.1038/nmeth.1374. [DOI] [PubMed] [Google Scholar]
- 31.Teo SM, Pawitan Y, Ku CS, Chia KS, Salim A. Statistical challenges associated with detecting copy number variations with next-generation sequencing. Bioinformatics. 2012;28:2711–8. doi: 10.1093/bioinformatics/bts535. [DOI] [PubMed] [Google Scholar]
- 32.Place AE, Jin Huh S, Polyak K. The microenvironment in breast cancer progression: Biology and implications for treatment. Breast Cancer Res. 2011;13:227. doi: 10.1186/bcr2912. [DOI] [PMC free article] [PubMed] [Google Scholar]
- 33.Vogelstein B, Papadopoulos N, Velculescu VE, Zhou S, Diaz LA, Jr, Kinzler KW. Cancer genome landscapes. Science. 2013;339:1546–58. doi: 10.1126/science.1235122. [DOI] [PMC free article] [PubMed] [Google Scholar]
- 34.Simpson PT, Reis-Filho JS, Gale T, Lakhani SR. Molecular evolution of breast cancer. J Pathol. 2005;205:248–54. doi: 10.1002/path.1691. [DOI] [PubMed] [Google Scholar]
- 35.Lopez-Garcia MA, Geyer FC, Lacroix-Triki M, Marchió C, Reis-Filho JS. Breast cancer precursors revisited: Molecular features and progression pathways. Histopathology. 2010;57:171–92. doi: 10.1111/j.1365-2559.2010.03568.x. [DOI] [PubMed] [Google Scholar]
- 36.Sotiriou C, Wirapati P, Loi S, Harris A, Fox S, Smeds J, et al. Gene expression profiling in breast cancer: Understanding the molecular basis of histologic grade to improve prognosis. J Natl Cancer Inst. 2006;98:262–72. doi: 10.1093/jnci/djj052. [DOI] [PubMed] [Google Scholar]
- 37.Ivshina AV, George J, Senko O, Mow B, Putti TC, Smeds J, et al. Genetic reclassification of histologic grade delineates new clinical subtypes of breast cancer. Cancer Res. 2006;66:10292–301. doi: 10.1158/0008-5472.CAN-05-4414. [DOI] [PubMed] [Google Scholar]
- 38.Petitjean A, Mathe E, Kato S, Ishioka C, Tavtigian SV, Hainaut P, et al. Impact of mutant p53 functional properties on TP53 mutation patterns and tumor phenotype: Lessons from recent developments in the IARC TP53 database. Hum Mutat. 2007;28:622–9. doi: 10.1002/humu.20495. [DOI] [PubMed] [Google Scholar]
- 39.Negrini S, Gorgoulis VG, Halazonetis TD. Genomic instability - An evolving hallmark of cancer. Nat Rev Mol Cell Biol. 2010;11:220–8. doi: 10.1038/nrm2858. [DOI] [PubMed] [Google Scholar]
- 40.Beck AH, Sangoi AR, Leung S, Marinelli RJ, Nielsen TO, van de Vijver MJ, et al. Systematic analysis of breast cancer morphology uncovers stromal features associated with survival. Sci Transl Med. 2011;3:108ra113. doi: 10.1126/scitranslmed.3002564. [DOI] [PubMed] [Google Scholar]
- 41.Yuan Y, Failmezger H, Rueda OM, Ali HR, Gräf S, Chin SF, et al. Quantitative image analysis of cellular heterogeneity in breast tumors complements genomic profiling. Sci Transl Med. 2012;4:157ra143. doi: 10.1126/scitranslmed.3004330. [DOI] [PubMed] [Google Scholar]
- 42.Ghaznavi F, Evans A, Madabhushi A, Feldman M. Digital imaging in pathology: Whole-slide imaging and beyond. Annu Rev Pathol. 2013;8:331–59. doi: 10.1146/annurev-pathol-011811-120902. [DOI] [PubMed] [Google Scholar]