Abstract
Background
Typically, a Fontan connection is constructed as either a lateral tunnel (LT) pathway or an extracardiac (EC) conduit. The LT is formed partially by atrial wall and is assumed to have growth potential, but the extent and nature of LT pathway growth have not been well characterized. A quantitative analysis was performed to evaluate this issue.
Methods
Retrospective serial cardiac magnetic resonance data were obtained for 16 LT and 9 EC patients at two time points (mean time between studies 4.2±1.6 years). Patient-specific anatomies and flows were reconstructed. Geometrical parameters of Fontan pathway vessels and the descending aorta were quantified, normalized to body surface area (BSA), and compared between time points and Fontan pathway types.
Results
Absolute LT pathway mean diameters increased over time for all but 2 patients; EC pathway size did not change (2.4 ± 2.2 mm versus 0.02 ± 2.1 mm, p <0.05). Normalized LT and EC diameters decreased, while the size of the descending aorta increased proportionally to BSA. Growth of other cavopulmonary vessels varied. The patterns and extent of LT pathway growth were heterogeneous. Absolute flows for all vessels analyzed, except for the superior vena cava, proportionally to BSA.
Conclusions
Fontan pathway vessel diameter changes over time were not proportional to somatic growth but increases in pathway flows were; LT pathway diameter changes were highly variable. These factors may impact Fontan pathway resistance and hemodynamic efficiency. These findings provide further understanding of the different characteristics of LT and EC Fontan connections and set the stage for further investigation.
Introduction
The total cavopulmonary connection (TCPC)[1] is the method of choice for single ventricle palliation. The inferior vena cava (IVC) is routed to the bidirectional cavopulmonary connection, forming the Fontan pathway (FP), typically using either an intra-atrial lateral tunnel (LT) pathway, or an extracardiac (EC) conduit. In general, the LT pathway is created by suturing a synthetic baffle inside the atrium[2] and the EC conduit is created from a synthetic tubular graft[3, 4]. Previous studies have shown that the different geometric features of the two connection types are associated with different hemodynamic characteristics, but there is no consensus on which is superior[5, 6].
One of the main differences between LT and EC connections is the potential for growth of the FP. Since the circumferential non-native EC conduit cannot change its size, it is usually performed using a graft that is thought to be large enough to support the circulation into adulthood[7]. The LT pathway is partially formed with native atrial tissue[8] and is thought to have growth potential[9]. Previous studies have looked into growth trends amongst the TCPC vessels in serial cohorts for both LT and EC patients, but a detailed anatomical comparison is not yet available[10–12]. Since the TCPC procedure is usually performed in young patients, the ability for the FP to increase its size as the patient grows may be of critical importance. In particular, as caval flows increase with patient growth, it is vital that the vessels are also proportional to minimize the resistance to blood flow.
A comprehensive quantitative analysis evaluating the growth of the TCPC vessels has yet to be reported. Specifically, it is important to analyze the LT pathway growth relative to the other vessels and to compare it with EC conduit deformation over time. This study seeks to address these questions and to provide information on the growth trends in patients with LT and EC Fontan connections.
Patients and Methods
Patients
Single ventricle patients with a completed TCPC were retrospectively selected for this study based on availability of two serial cardiac magnetic resonance (CMR) scans between 2001and 2012 at Boston Children’s Hospital or the Children’s Hospital of Philadelphia. Patients were excluded if: age exceeded 25 years at the initial scan, change in body surface area[13] (BSA) between the first (T1) and second (T2) scans was less than 0.2m2, image quality was sub-optimal, or if the patients underwent any pulmonary artery (PA) or FP stent implantation between scans. The Institutional Review Boards of all centers involved approved the study.
Anatomy and Flow Reconstruction
Patient-specific anatomies were reconstructed from the CMR data set using previously developed tools[14, 15]. Phase-contrast images acquired perpendicular to the IVC, superior vena cava -SVC, left and right PA –LPA and RPA) and the ascending aorta were used to reconstruct patient-specific flow[16, 17].
Geometry Isolation and Mesh Preparation
The region of interest was isolated from the reconstructed TCPC by cutting at the following cross sectional planes: (i) FP: upstream of the hepatic venous confluence; (ii) SVC: just below the innominate vein; (iii) LPA: immediately before first branching point; (iv) RPA: similar to the LPA, but including the right upper pulmonary artery if it is close to the SVC connection; and (v) any other vessels that formed the connection, such as the azygous vein or left SVC, were cut before the most central tributary.
Unstructured surface meshes were generated on the reconstructed anatomies, using GAMBIT (ANSYS Inc., Lebanon, NH). To ensure optimal vessel length for centerline computation, vessel extensions (5 to 10 mm) were added to the inlets and outlets in the normal direction of the vessel cross-section.
Geometrical Characterization
TCPC vessels centerlines from the vessel cap to the branching point were extracted using the Vascular Modeling Toolkit (VMTK – www.vmtk.org). Centerlines were obtained by finding the center of the maximum inscribed sphere at different points within the vessel. Radii of such maximum inscribed spheres along the centerlines were also computed. MATLAB (Mathworks Inc., MA, USA) was used to extract the geometrical parameters out of the vessel centerlines, including: (i) Minimum, mean and maximum diameter along each vessel; (ii) Nakata index[18] (average of RPA and LPA cross-sectional areas, divided by BSA), and (vi) McGoon[19] ratio (sum of LPA and RPA mean diameters, divided by the descending aorta [dAo] diameter). Diameters were also normalized to BSA. Changes in absolute and normalized diameters from T1 to T2 were calculated.
BSA-normalized dAo growth was used as a control to assess vessel changes relative to somatic growth. DAo cross sectional areas were obtained from PC-MRI anatomic slices; closed polygon area measurements were used to compute the cross-sectional area in into OsiriX (Version 5.5.2; http://www.osirix-viewer.com, Pixmeo). The FP cross-sectional area at the PA branching point has hemodynamic relevance because here the superior and inferior inflows collide. The cross-sectional area of the FP at the point of PA branching was extracted from the 3D geometry and area was calculated using Paraview (Sandia National, Kitware INC, Los Alamos National Laboratory).
Distance between the geometries at the two time points reflected the 3D growth/deformation of the TCPC surface over time, to provide an overall notion of the geometrical changes. Using VMTK a rigid body transformation was performed between the geometry at T1 to best match the geometry at T2, and normal distance was computed.
Statistical Analysis
IBM SPSS Statistics (version 20, IBM Corporation, Armonk, New York) was used in the statistical analysis. Paired comparison of absolute and normalized geometric parameters between the two time points was performed using the Wilcoxon signed rank test (for the overall cohort, and LT and EC groups separately). Comparison of parameters between EC and LT groups was performed using the Mann-Whitney U test.
Results
Patients
A total of 25 patients (16 LT and 9 EC) were included in this study (Table 1). Figure 1A shows the linear relationship between age and BSA, while 1B shows the proportional changes in both parameters when normalized to the initial value. Changes in these parameters did not differ between the LT and EC groups (p-values 0.25 and 0.68 respectively).
Table 1.
Age and BSA for the overall cohort and pathway subgroups at the time points analyzed
| BSA (m2) | Age (years) | ||||
|---|---|---|---|---|---|
|
| |||||
| T1 | T2 | T1 | T2 | ||
| All (N=25) | Range | 0.7–1.9 | 1.2–2.2 | 6.6–17.0 | 11.0–21.0 |
| Median | 1.1 | 1.6 | 10.0 | 14.5 | |
| LT (N=16) | Range | 0.7–1.9 | 1.2–2.2 | 6.6–17.0 | 11.4–21.0 |
| Median | 1.1 | 1.6 | 10.3 | 14.8 | |
| EC (N=9) | Range | 0.9–1.6 | 1.2–1.9 | 7.0–15.0 | 11.0–20.0 |
| Median | 1.1 | 1.6 | 9.0 | 14.0 | |
EC: extra-cardiac; LT: lateral tunnel; T1: initial study; T2: later study
Figure 1.
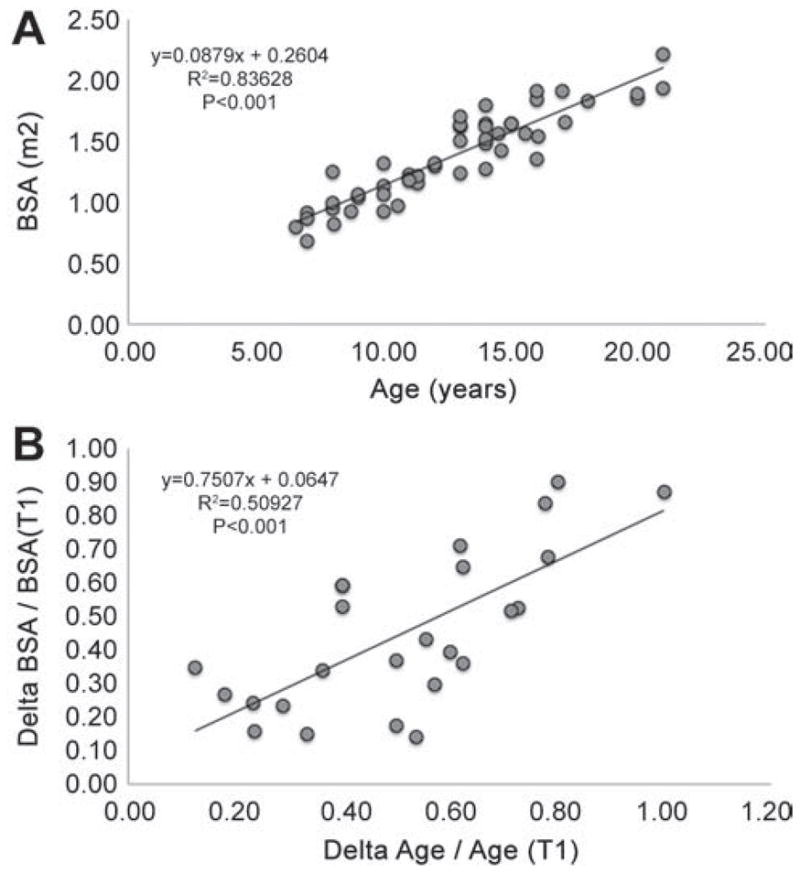
A: relationship between patient age (years) and the body surface area (BSA) (m2) for all the patients included in the study. B: relationship between the changes of age and BSA normalized to the variable value at the initial time point. Linear regression equations are indicated; p-values indicate the regression significance. T1: initial time point
Superior vena cava and pulmonary arteries growth
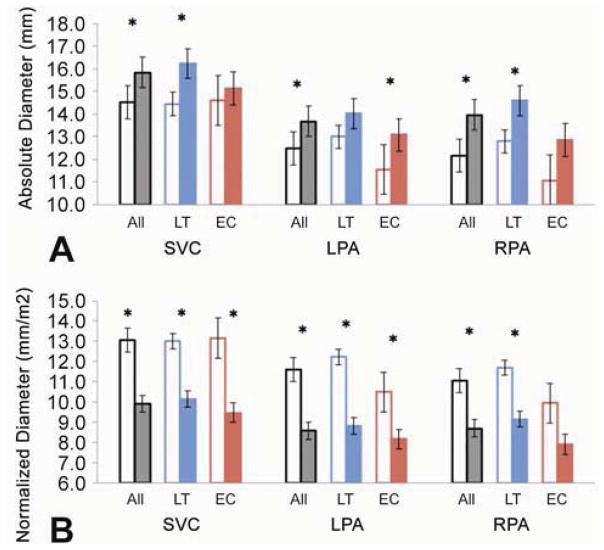
Figure 2 shows the absolute and normalized vessel diameters for the entire cohort, and for LT and EC groups. The absolute diameters of the SVC and both PAs increased from T1 to T2; these changes were significant in all cases, except for the SVC and right PA in the EC group, and the LPA in the LT group. In contrast, all normalized SVC and PA diameters decreased over time.
Figure 2.
Absolute (A) and Normalized (B) mean vessel diameters for the SVC, LPA and RPA in the cohort, LT and EC subgroups. T1 is shown in the open columns and T2 in the solid ones. (*): p-value<0.05
Fontan Pathway growth: EC vs. LT groups
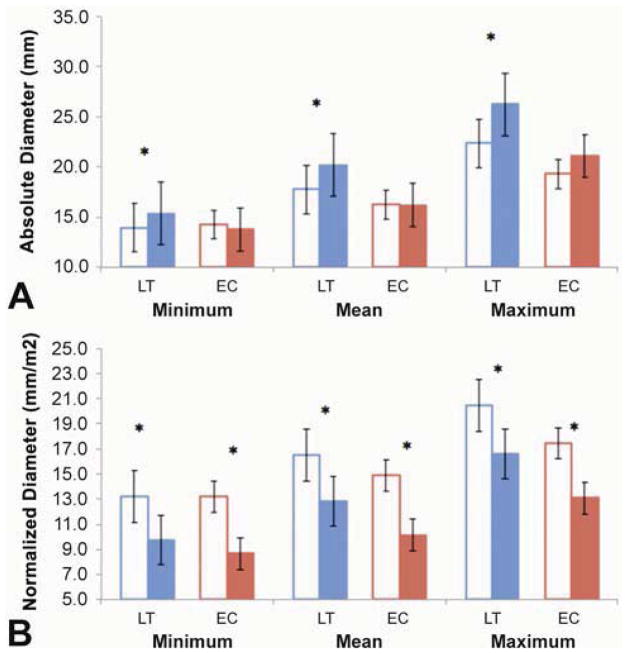
Minimum, mean and maximum absolute FP diameters increased significantly in the LT group (Figure 3A), but remained the same in EC patients. Normalized diameter values decreased significantly in both groups (Figure 3B). Figure 4 shows the relationship between absolute FP diameter and BSA for LT and EC groups. Notably, the absolute mean FP diameter increased in all but 2 LT patients.
Figure 3.
Absolute (A) and Normalized (B) minimum, mean and maximum Fontan Pathway diameters for LT and EC subgroups. T1 is shown in the open columns and T2 in the solid ones (*): p-value<0.05
Figure 4.
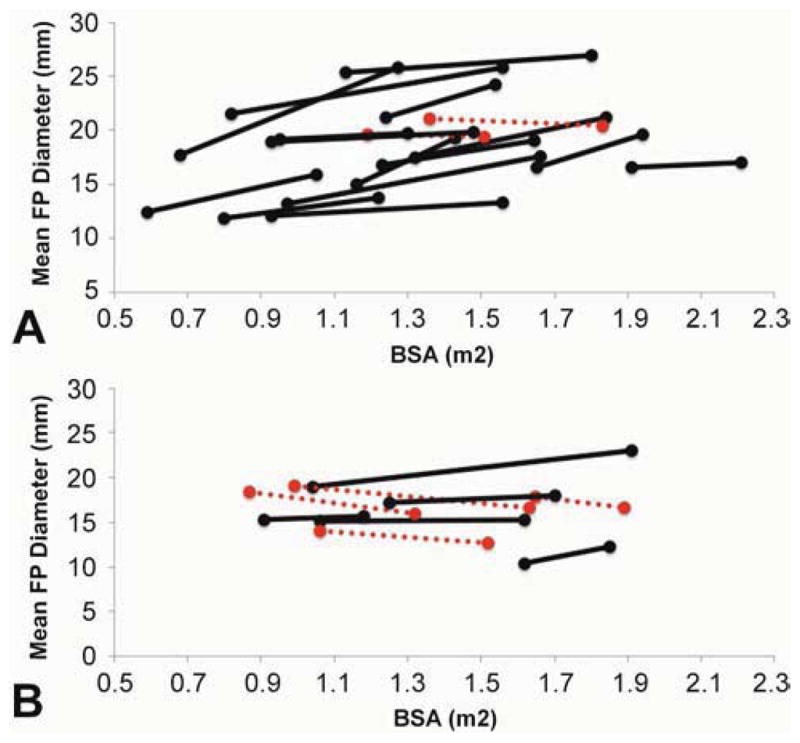
Relationship between absolute mean FP diameters (mm) and body surface area (m2) in LT (A) and EC (B) patients. Dashed red line: decreasing absolute diameter; Solid black line: increasing absolute diameter.
Relevant vessel cross-sectional areas (Figure 5) and Normalized metrics (Table 2)
Figure 5.
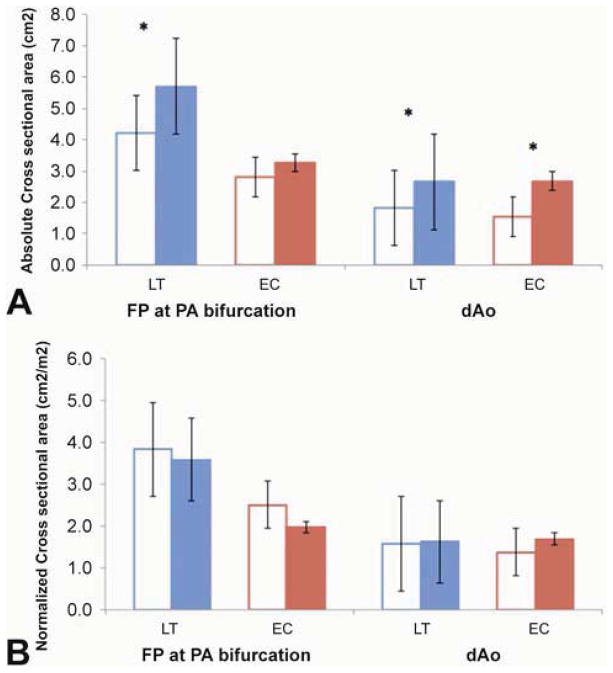
Absolute (A) and Normalized (B) cross-sectional vessel Areas for the FP at the PA bifurcation and the descending Aorta. T1 is shown in the open columns and T2 in the solid ones. (*): p-value<0.05
Table 2.
Normalized metrics for the cohort, LT, and EC groups
| Nakata Index | P-value | McGoon Ratio | P-value | |||
|---|---|---|---|---|---|---|
|
| ||||||
| T1 | T2 | T1 | T2 | |||
| All | 225.12±70.4 | 191.63±38.0 | 0.030* | 1.75±0.35 | 1.55±0.30 | 0.015* |
| LT | 246.4±69.0 | 204.7±37.8 | 0.056 | 1.8±0.4 | 1.6±0.3 | 0.105 |
| EC | 187.3±58.4 | 168.4±26.6 | 0.260 | 1.7±0.3 | 1.4±0.2 | 0.038* |
EC: extra-cardiac; LT: lateral tunnel; T1: initial study; T2: later study; (*): significant
Absolute FP areas at the PA bifurcation were larger at T2 than T1 in the LT group, but not the EC group. Normalized cross-sectional areas of the dAo and FP at the PA bifurcation were similar at T1 and T2 in both groups. Additionally, the dAo normalized area increased in time, which shows proportionality to BSA changes. Another indication of the non-commensurate PA growth was the finding that the Nakata index and the McGoon ratio decreased from T1 to T2, although these changes did not all reach significance (Table 2).
Absolute and Normalized Flow Rates (Figure 6)
Figure 6.
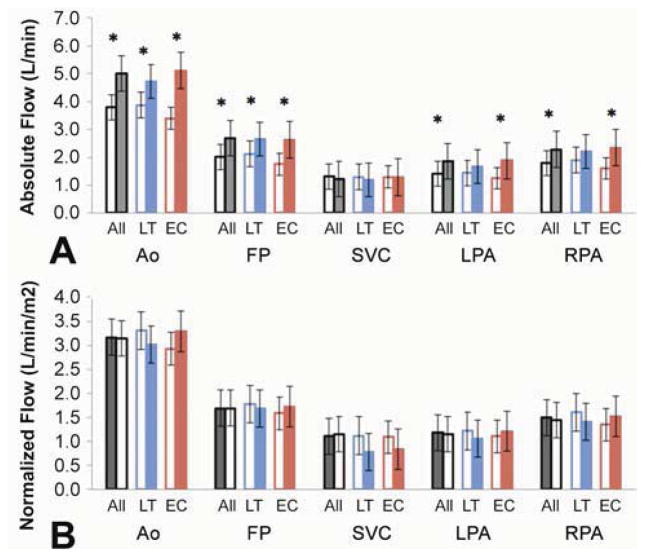
Absolute and Normalized mean flows for the cohort (A), and the LT and EC groups (B). T1 is shown in the open columns and T2 in the solid ones. (*): p-value<0.05
Absolute flow rates were significantly higher for most vessels analyzed at T2 than T1, except for the SVC, which did not change. There were variable changes in normalized flows from T1 to T2, but no significant differences for any vessel or patient group.
Three-dimensional Changes Over Time
The surface distance between the TCPC geometries at the two time points was computed; results for a sample of 4 EC patients and 4 LT patients are shown in Figure 7. In the EC group, distance changes were generally small and uniform (based on a homogeneous color scale). Distance changes were more variable in the LT group, especially in the FP: for example, LT2 presented larger variations than those observed in LT4. It is important to note that these diameter changes were not constant along the length of the vessel; for example, as seen on LT1, LT2 and LT3, there was a considerable expansion at some locations, but a reduction in cross-sectional area at others. The magnitude and patterns of change for the SVC, LPA and RPA were not considerably different between the EC and LT groups.
Figure 7.
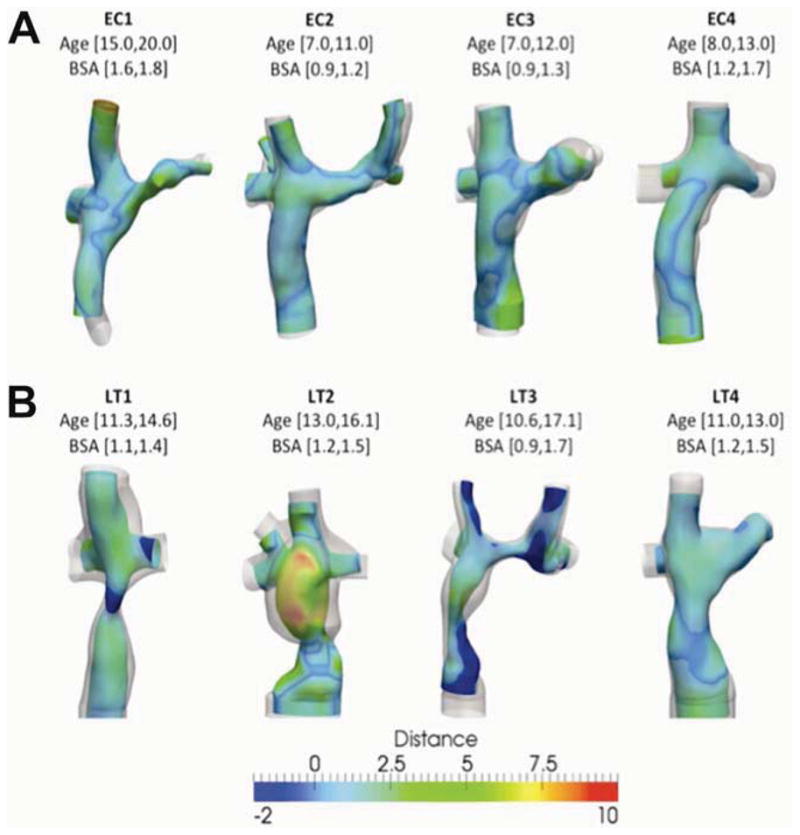
Distance (in mm) between the geometry at the initial time point (color coded) and the latter time (translucent gray). Top row shows extra-cardiac patients (EC1 through EC4); bottom row shows Lateral Tunnel patients (LT1-LT4). Patient’s age and body surface area (BSA) for each time point of the study is indicated
Comment
Given that completion of the Fontan circulation is usually performed in early childhood and must support the patient into adulthood, it is necessary that the Fontan connection grow with the patient. The objective of this study was to quantify the geometrical and flow changes in the vessels forming the TCPC in patients with both LT and EC Fontan connections, who were studied at serial time points between which they increased in BSA by at least 0.2 m2.
The absolute FP diameters increased over time in patients with a LT TCPC, confirming that the growth potential of this connection is realized. As expected, there was no change in the absolute diameter of the FP in EC Fontan patients, given that a circumferential non-viable conduit is used for this connection. Other TCPC vessels, namely, the SVC and PA, grew as well, although small sample size in the EC group made it difficult to determine whether there were differences according to connection type.
One of the important findings of this study was that, although absolute vessel sizes tended to increase over time, BSA-normalized TCPC vessel diameters decreased, while normalized dAo area, as growth control, remained constant. These findings suggest that the rate of TCPC vessel growth did not match somatic growth, which is consistent with what has been reported previously[20]. Salim et al[21] demonstrated a linear relationship between PA diameter and BSA in healthy children; however, previous studies have shown that this is not the case for single ventricle patients[12, 22–24]. In this study, a similar trend was observed with both EC and LT connections, which is important given that PA size may be a factor in the long-term outcome of patients with a Fontan connection[18, 25–29]. The EC group exhibited decreases in normalized FP minimum and mean diameters, which was expected due to the differing material compositions of the two pathways. This is further supported by the greater variation observed in the absolute mean diameter for the FP in the LT compared to the EC (independent of age or BSA), which is consistent with the literature[25, 30].
Taken together, the findings of this study confirm the hypothesis that the LT pathway has growth capability. However, it is important to take into account that the LT pathway showed inconsistent and heterogeneous growth, which may have clinical relevance for a variety of reasons related to the hemodynamics and rheology of the TCPC [31, 32]. The cross-sectional area of the FP at the site of the PA anastomosis was larger in the LT group than the EC group at both time points. This might be a function of either surgical technique or different growth trends, and may have implications for hemodynamics and power loss at the junction of the caval veins with the PA.
This study confirmed that the mean flow rate changes over time in Fontan patients. Absolute Ao flow changed significantly from T1 to T2 in the cohort and subgroups; however, changes between T1 and T2 differed between groups probably due to the small EC sample size. The FP absolute flow increased over time, while the SVC did not. Normalized flows remained constant for the FP and PAs, but decreased significantly in the SVC. The mismatch observed in geometrical and flow rate changes in these patients may have a detrimental effect on energy efficiency and ventricular function[33–35]. In order to avoid high power loss across the connection due to increased flow with growth, there should be a proportional increase in vessel diameter. Therefore, it is important that the TCPC maintains an adequate size as the patient grows older and the flow demand increases.
Study Limitations
The use of retrospective data can present a challenge for a number of reasons, such as heterogeneity in patient population and data quality. However, such a large longitudinal CMR data set with serial measurements in growing Fontan patients has not been reported, which justifies the use of these data in this novel study. A limitation to consider was the imaging resolution: the pixel spacing in the CMR images used in this study was 1.25±0.24mm with a slice thickness of 4.57±1.05mm. Efforts have been applied to interpolate these images to isotropic voxels for the anatomical reconstruction, with a method previously validated with 0.96% error for pulmonary artery (PA) diameter measurement and 1.77% error on radius curvature. In addition, the scans were not acquired at the same age for all patients (or within the same time intervals), which could affect the findings; even though a minimum change of BSA was required, this is not necessarily expected to coincide with meaningful growth in vessel size. The authors attempted to address this by normalizing each geometric parameter to the patient’s BSA. The study groups, particularly the EC group, were relatively small, which may have predisposed to type II error.
Conclusions
In conclusion, this study represents an effort to evaluate vessel growth in Fontan patients by analyzing serial CMR data, computing and comparing geometrical parameters, such as normalized diameters. While growth in absolute terms was observed in all TCPC vessels, normalized diameters generally decreased, indicating that although vessel growth did occur, it was not proportionate to somatic growth. In addition, it was shown that the FP has different growth behavior depending on the connection type: the LT pathway does grow over time in most patients, though the growth was often heterogeneous along the length of the pathway. The implications of these growth trends for adult patients cannot be determined in the present study, but these findings will help serve as a foundation for investigation of the adequacy of FP pathway size and growth in adult patients. It is important to further elucidate the impact of these growth patterns, including the effects of growth on the hemodynamic efficiency of the TCPC, and to understand how the heterogeneity of the vessel growth may influence its hemodynamic performance.
Acknowledgments
This work was partially supported by the National Heart, Lung, and Blood Institute, grants HL67622 and R01HL098252, and the Pre-Doctoral Fellowship Awards (13PRE14580005 and 10PRE3720002) from the American Heart Association. The authors would also like to acknowledge Malavika Mundkur and Colleen Crouch for their work on this study.
Footnotes
Publisher's Disclaimer: This is a PDF file of an unedited manuscript that has been accepted for publication. As a service to our customers we are providing this early version of the manuscript. The manuscript will undergo copyediting, typesetting, and review of the resulting proof before it is published in its final citable form. Please note that during the production process errors may be discovered which could affect the content, and all legal disclaimers that apply to the journal pertain.
References
- 1.de Leval MR, et al. Total cavopulmonary connection: a logical alternative to atriopulmonary connection for complex Fontan operations. Experimental studies and early clinical experience. J Thorac Cardiovasc Surg. 1988;96(5):682–95. [PubMed] [Google Scholar]
- 2.Stamm C, et al. Long-term results of the lateral tunnel Fontan operation. Journal of Thoracic and Cardiovascular Surgery. 2001;121(1):28–41. doi: 10.1067/mtc.2001.111422. [DOI] [PubMed] [Google Scholar]
- 3.Tokunaga S, et al. Total cavopulmonary connection with an extracardiac conduit: experience with 100 patients. Ann Thorac Surg. 2002;73(1):76–80. doi: 10.1016/s0003-4975(01)03302-1. [DOI] [PubMed] [Google Scholar]
- 4.Chowdhury UK, et al. Specific issues after extracardiac fontan operation: ventricular function, growth potential, arrhythmia, and thromboembolism. Ann Thorac Surg. 2005;80(2):665–72. doi: 10.1016/j.athoracsur.2005.02.024. [DOI] [PubMed] [Google Scholar]
- 5.Khairy P, Poirier N. Is the extracardiac conduit the preferred Fontan approach for patients with univentricular hearts? The extracardiac conduit is not the preferred Fontan approach for patients with univentricular hearts. Circulation. 2012;126(21):2516–25. doi: 10.1161/CIRCULATIONAHA.111.075036. discussion 2525. [DOI] [PubMed] [Google Scholar]
- 6.Kogon B. Is the extracardiac conduit the preferred Fontan approach for patients with univentricular hearts? The extracardiac conduit is the preferred Fontan approach for patients with univentricular hearts. Circulation. 2012;126(21):2511–5. doi: 10.1161/CIRCULATIONAHA.111.076398. discussion 2515. [DOI] [PubMed] [Google Scholar]
- 7.Petrossian E, et al. The extracardiac conduit Fontan operation using minimal approach extracorporeal circulation: early and midterm outcomes. J Thorac Cardiovasc Surg. 2006;132(5):1054–63. doi: 10.1016/j.jtcvs.2006.05.066. [DOI] [PubMed] [Google Scholar]
- 8.Fujii Y, et al. Growth of the lateral tunnel in patients who underwent a total cavopulmonary connection at less than 5 years of age. Eur J Cardiothorac Surg. 2010;38(1):66–70. doi: 10.1016/j.ejcts.2010.01.014. [DOI] [PubMed] [Google Scholar]
- 9.Stamm C, et al. Long-term results of the lateral tunnel Fontan operation. J Thorac Cardiovasc Surg. 2001;121(1):28–41. doi: 10.1067/mtc.2001.111422. [DOI] [PubMed] [Google Scholar]
- 10.Voges I, et al. Anatomical and functional assessment of the intra-atrial lateral tunnel in the Fontan circulation. Eur J Cardiothorac Surg. 2013 doi: 10.1093/ejcts/ezt066. [DOI] [PubMed] [Google Scholar]
- 11.Ochiai Y, et al. Longitudinal growth of the autologous vessels above and below the Gore-Tex graft after the extracardiac conduit Fontan procedure. Eur J Cardiothorac Surg. 2010;37(5):996–1001. doi: 10.1016/j.ejcts.2009.12.010. [DOI] [PubMed] [Google Scholar]
- 12.Tatum GH, et al. Pulmonary artery growth fails to match the increase in body surface area after the Fontan operation. Heart. 2006;92(4):511–4. doi: 10.1136/hrt.2005.070243. [DOI] [PMC free article] [PubMed] [Google Scholar]
- 13.Haycock GB, Schwartz GJ, Wisotsky DH. Geometric method for measuring body surface area: a height-weight formula validated in infants, children, and adults. J Pediatr. 1978;93(1):62–6. doi: 10.1016/s0022-3476(78)80601-5. [DOI] [PubMed] [Google Scholar]
- 14.Frakes DH, et al. Application of an adaptive control grid interpolation technique to morphological vascular reconstruction. IEEE Trans Biomed Eng. 2003;50(2):197–206. doi: 10.1109/TBME.2002.807651. [DOI] [PubMed] [Google Scholar]
- 15.Frakes DH, et al. New techniques for the reconstruction of complex vascular anatomies from MRI images. J Cardiovasc Magn Reson. 2005;7(2):425–32. doi: 10.1081/jcmr-200053637. [DOI] [PubMed] [Google Scholar]
- 16.Frakes D, et al. Three-dimensional velocity field reconstruction. J Biomech Eng. 2004;126(6):727–35. doi: 10.1115/1.1824117. [DOI] [PubMed] [Google Scholar]
- 17.Sundareswaran KS, et al. Optimum fuzzy filters for phase-contrast magnetic resonance imaging segmentation. J Magn Reson Imaging. 2009;29(1):155–65. doi: 10.1002/jmri.21579. [DOI] [PMC free article] [PubMed] [Google Scholar]
- 18.Nakata S, et al. A new method for the quantitative standardization of cross-sectional areas of the pulmonary arteries in congenital heart diseases with decreased pulmonary blood flow. J Thorac Cardiovasc Surg. 1984;88(4):610–9. [PubMed] [Google Scholar]
- 19.Piehler JM, et al. Management of pulmonary atresia with ventricular septal defect and hypoplastic pulmonary arteries by right ventricular outflow construction. J Thorac Cardiovasc Surg. 1980;80(4):552–67. [PubMed] [Google Scholar]
- 20.Tomita H, et al. Potential goals for the dimensions of the pulmonary arteries and aorta with stenting after the Fontan operation. Catheter Cardiovasc Interv. 2002;56(2):246–53. doi: 10.1002/ccd.10174. [DOI] [PubMed] [Google Scholar]
- 21.Salim MA, et al. Contribution of superior vena caval flow to total cardiac output in children. A Doppler echocardiographic study. Circulation. 1995;92(7):1860–5. doi: 10.1161/01.cir.92.7.1860. [DOI] [PubMed] [Google Scholar]
- 22.Reddy VM, et al. Pulmonary artery growth after bidirectional cavopulmonary shunt: is there a cause for concern? J Thorac Cardiovasc Surg. 1996;112(5):1180–90. doi: 10.1016/S0022-5223(96)70131-9. discussion 1190–2. [DOI] [PubMed] [Google Scholar]
- 23.Mendelsohn AM, et al. Central pulmonary artery growth patterns after the bidirectional Glenn procedure. J Thorac Cardiovasc Surg. 1994;107(5):1284–90. [PubMed] [Google Scholar]
- 24.Borowski A, et al. Pulmonary artery growth after systemic-to-pulmonary shunt in children with a univentricular heart and a hypoplastic pulmonary artery bed. Implications for Fontan surgery. Jpn Heart J. 1998;39(5):671–80. doi: 10.1536/ihj.39.671. [DOI] [PubMed] [Google Scholar]
- 25.Fontan F, et al. The size of the pulmonary arteries and the results of the Fontan operation. J Thorac Cardiovasc Surg. 1989;98(5 Pt 1):711–9. discussion 719–24. [PubMed] [Google Scholar]
- 26.Baek JS, et al. Pulmonary artery size and late functional outcome after Fontan operation. Ann Thorac Surg. 2011;91(4):1240–6. doi: 10.1016/j.athoracsur.2010.12.002. [DOI] [PubMed] [Google Scholar]
- 27.Xu MY, Kowalski R, d’Udekem Y. Pulmonary artery size at the time of bidirectional cavopulmonary shunt and Fontan surgery influences long-term outcomes. J Thorac Cardiovasc Surg. 2012;143(4):989–90. doi: 10.1016/j.jtcvs.2011.10.092. author reply 990. [DOI] [PubMed] [Google Scholar]
- 28.Hosein RB, et al. Factors influencing early and late outcome following the Fontan procedure in the current era. The ‘Two Commandments’? Eur J Cardiothorac Surg. 2007;31(3):344–52. doi: 10.1016/j.ejcts.2006.11.043. discussion 353. [DOI] [PubMed] [Google Scholar]
- 29.Itatani K, et al. The lower limit of the pulmonary artery index for the extracardiac Fontan circulation. J Thorac Cardiovasc Surg. 2011;142(1):127–35. doi: 10.1016/j.jtcvs.2010.11.033. [DOI] [PubMed] [Google Scholar]
- 30.Ochiai Y, et al. Mid-term follow-up of the status of Gore-Tex graft after extracardiac conduit Fontan procedure. Eur J Cardiothorac Surg. 2009;36(1):63–7. doi: 10.1016/j.ejcts.2009.02.013. discussion 67–8. [DOI] [PubMed] [Google Scholar]
- 31.Kaulitz R, et al. Fontan-type procedures: residual lesions and late interventions. Ann Thorac Surg. 2002;74(3):778–85. doi: 10.1016/s0003-4975(02)03756-6. [DOI] [PubMed] [Google Scholar]
- 32.Mets JM, et al. Outcomes of stent implantation for obstruction of intracardiac lateral tunnel fontan pathways. Circ Cardiovasc Interv. 2013;6(1):92–100. doi: 10.1161/CIRCINTERVENTIONS.112.000099. [DOI] [PubMed] [Google Scholar]
- 33.Tang E, et al. A retrospective cohort of 100 fontan connections: Relationship between geometric features and hemodynamics outcomes(abstract) J Am Coll Cardiol. 2013:61(E490). [Google Scholar]
- 34.Haggerty C, et al. Increased power loss in the total cavopulmonary connection is related to decreased single ventricle volume (abstract) J Am Coll Cardiol. 2013:61(E491). [Google Scholar]
- 35.Dasi LP, et al. Fontan hemodynamics: importance of pulmonary artery diameter. J Thorac Cardiovasc Surg. 2009;137(3):560–4. doi: 10.1016/j.jtcvs.2008.04.036. [DOI] [PMC free article] [PubMed] [Google Scholar]


