

Abstract
BACKGROUND AND PURPOSE
This study aimed to investigate the relationship between the plasma concentration (PK) of the novel histamine H3 receptor antagonist, GSK239512, and the brain occupancy of H3 receptors (RO) in healthy human volunteers.
EXPERIMENTAL APPROACH
PET scans were obtained after i.v. administration of the H3-specific radioligand [11C]GSK189254. Each subject was scanned before and after single oral doses of GSK239512, at 4 and 24 h after dose. PET data were analysed by compartmental analysis, and regional RO estimates were obtained by graphical analysis of changes in the total volumes of distribution of the radioligand, followed by a correction for occupancy by the high affinity radioligand. The PK/RO relationship was analysed by a population-modelling approach, using the average PK of GSK239512 during each scan.
KEY RESULTS
Following administration of GSK239512, there was a reduction in the brain uptake of [11C]GSK189254 in all regions, including cerebellum. RO at 4 h was higher than at 24 h, and the PK/RO model estimated a PK associated with 50% of RO of 0.0068 ng·mL−1. This corresponds to a free concentration of 4.50 × 10⁻¹² M (pK = 11.3).
CONCLUSIONS AND IMPLICATIONS
The affinity of GSK239512 for brain H3 receptors in humans in vivo is much higher than that expected from studies in vitro, and higher than that observed in PET studies in pigs. The study illustrates the utility of carrying out PET studies in humans early in drug development, providing accurate quantification of GSK239512 RO in vivo as a function of time and dose.
Keywords: H3 receptors, drug development, pharmacokinetics, receptor occupancy, PET study
Introduction
The neurotransmitter histamine mediates its biological effects by activating four transmembrane GPCRs (H1, H2, H3 and H4; Hill et al., 1997; Nguyen et al., 2001; receptor nomenclature follows Alexander et al. (2013), with highest affinity for the H3 receptor. The mammalian brain expresses H3 receptors heterogeneously, with particularly high densities in the basal ganglia (Martinez-Mir et al., 1990; Pillot et al., 2002). These receptors are located presynaptically on both histaminergic and non-histaminergic neurones where they act as autoreceptors and heteroreceptors, respectively (Arrang et al., 1983; Schlicker et al., 1989; Prast et al., 1999). Histamine H3 receptors have been implicated in a range of disorders, including cognitive deficits, obesity, diabetes mellitus and sleep disorders (Hancock and Fox, 2004; Yoshimoto et al., 2006; Parmentier et al., 2007). Thus, the H3 receptor is of particular interest as a pharmacological target (Celanire et al., 2005).
Previous clinical studies with H3 receptor antagonists have shown that high occupancy of H3 receptors in the CNS gives rise to poor tolerability, mainly because of sleep disturbance. Therefore, understanding the receptor occupancy (RO) of novel H3 antagonists at an early stage in drug development may allow the prediction of their therapeutic window early and with a greater degree of accuracy.
Previously, Plisson et al. (2009) described the radiosynthesis and preclinical evaluation of [11C-N-methyl]-6-(3-cyclobutyl-2,3,4,5-tetrahydro-1H-benzo[d]azepin-7-yloxy)-nicotamide ( [11C]GSK189254) as a novel radioligand for investigating the H3 receptor using PET. Subsequently, Ashworth et al. (2010) showed that [11C]GSK189254 could be used to quantify H3 receptor availability in humans in vivo using PET.
In the present study, we used [11C]GSK189254 to evaluate the RO of GSK239512, a novel H3 receptor antagonist under clinical development for cognitive disorders. PET scans were acquired before and after single oral doses of GSK239512, at the time of maximum plasma concentration (Tmax = 4 h) and again at 24 h after dose. The affinity of GSK239512 for the H3 receptor in humans was determined to be much higher than previously estimated using both in vitro studies and preclinical PET studies, highlighting the importance of carrying out these types of PET studies in humans in order to guide dose selection for clinical trials.
Methods
This study (H3B106026) was a single-centre, open-label, non-randomized RO study, sponsored by GlaxoSmithKline (GSK) and carried out at the Centre for Addiction and Mental Health, Toronto. The protocol was posted on http://clinicaltrial.gov (identifier NCT00474513) before study initiation.
Radiochemistry
6-[ (3-Cyclobutyl-2,3,4,5-tetrahydro-1H-3-benzo[d]azepin-7-yl)oxy]-3-nicotamide (GSK185071B), 1-[6-[(3-cyclobutyl-2,3,4,5-tetrahydro-1H-3-benzazepin-7-yl)oxy]-3-pyridinyl]-2-pyrrolidinone (GSK239512) and [N-methyl]-6-(3-cyclobutyl-2,3,4,5-tetrahydro-1H-benzo[d]azepin-7-yloxy)-nicotamide (GSK189254) were synthesized at GSK (Harlow, UK). [11C]GSK189254 was prepared by [11C]-methylation of the carboxamide precursor GSK185071B as previously described (Wilson et al., 1994). The chemical structures of GSK189254 and GSK239512 were published by Medhurst et al. (2007) and Wilson et al. (2013), respectively.
Study volunteers
The local research ethics board and Health Canada approved the study. Volunteers provided a written informed consent and then underwent screening. They had a physical examination, including a 12-lead ECG, vital signs assessment, laboratory safety blood tests and urine/blood analyses for substances of abuse. Volunteers with history of neurological or psychiatric diseases, including seizures, mood disorders, schizophrenia and sleep disorders, were excluded. Seven of the planned 12 volunteers completed the study before it was terminated because of slow recruitment. Data from seven healthy male volunteers with a mean age of 42 (range 37–45) are reported.
PET imaging with [11C]GSK189254
On each day of PET scanning, the volunteers were cannulated in a forearm or antecubital vein for radioligand administration and in the contralateral radial artery for blood sampling. Six volunteers underwent three PET scan measurements, at baseline (scan 1), at 4 h after an oral dose of GSK239512 (scan 2) and at 24 h after an oral dose of GSK239512 (scan 3). Scans 1 and 2 were conducted on the same day, but scan 3 was conducted approximately 1 month after scan 2 to allow for healing of the cannulation site. The oral doses of GSK239512 administered for scans 2 and 3 were the same for an individual volunteer (6, 14 or 120 μg). Volunteer 4 only underwent a PET scan at baseline and at 4 h after dosing, but withdrew before scan 3.
Each volunteer was scanned on a Siemens-Biograph HiRez XVI PET camera system (Siemens Molecular Imaging, Knoxville, TN, USA.), as previously described (Brambilla et al., 2005). [11C]GSK189254 (300–393 MBq) was administered by i.v. bolus injection via a venous cannula. The specific activity at the time of injection was 21.7–86.3 GBq·μmol−1. GSK189254 has a molecular weight of 351.5, and therefore the mass dose associated with these injections was 1.34–4.98 μg. Each volunteer, except volunteer 4, also had a 3-D volumetric MRI scan using a fast spoiled gradient echo sequence acquired in the axial plane to provide an anatomical image for co-registration with their PET data. MR scans were performed using a GE medical system Signa Excite HD 1.5T scanner system (GE Healthcare, Milwaukee, WI, USA).
Blood sampling and metabolite analysis
Six serial venous blood samples were collected from each volunteer, before and up to 12 h after GSK239512 administration, for pharmacokinetic analysis. Further venous blood samples were collected immediately prior to and immediately following scans 2 and 3 for determination of the plasma exposure–RO relationship. Pharmacokinetics of GSK239512 was measured by a validated analytical method based on protein precipitation, followed by HPLC/MS/MS analysis. The lower limit of quantification was 0.005 ng·mL−1. The method was in accordance with the principles of Good Laboratory Practices in terms of selectivity, sensitivity, linearity, bias, precision, stability and the ability to dilute samples above the upper limit of quantification (Food and Drug Administration, 2001).
Arterial blood samples were collected continuously at a rate of 5 mL·min−1 during the PET scans for the first 10 min after [11C]GSK189254 administration. Further discrete samples of arterial blood were taken throughout each scan for measurement of whole blood activity, plasma activity and the fraction of the total radioactivity in plasma attributable to the parent tracer. Whole-blood samples were placed into heparinized tubes and centrifuged to obtain plasma. Both blood and plasma aliquots were measured on a gamma counter to establish time–radioactivity profiles. For radiolabelled metabolite analyses, HPLC was performed as described previously (Hilton et al., 2000; Ashworth et al., 2010).
Kinetic analysis of PET data
We have previously described in detail the kinetic analysis of [11C]GSK189254 PET data (Ashworth et al., 2010). In brief: a metabolite-corrected plasma input function was generated from the blood and plasma time–activity profiles and metabolite data. For each volunteer, except volunteer 4, regions of interest (ROIs; cerebellum, frontal cortex, insula cortex, anterior cingulate cortex, parietal cortex, occipital cortex, caudate, putamen, hippocampus, amygdala and thalamus) were defined on the MR image for that volunteer using a region template. The MR image was co-registered to each PET image for that volunteer using SPM2 (Wellcome Trust Centre for Neuroimaging, 2003). The ROIs were subsequently applied to the dynamic PET data to generate tissue time–activity curves (TACs). Five ROIs were defined directly on the PET image for volunteer 4 (cerebellum, motor cortex, putamen, caudate and thalamus). For subsequent analysis, data from volunteer 4 are not included in the mean data, but are reported separately.
For presentation purposes, tissue radioactivity concentrations were normalized for the radioactive dose injected and for the volunteer's body mass, giving standard uptake values (SUV), (kBq·mL−1 tissue) / (kBq·g−1 body mass).
A two-tissue compartment model was applied to the plasma and tissue data, involving four rate parameters (K1 – k4; Mintun et al., 1984), as described previously (Ashworth et al., 2010). The model also incorporated parameters to account for the delay and dispersion of the blood in the withdrawal cannula. Because of the kinetics of this radioligand, with a slow ‘off-rate’ from the receptor, a shared parameter approach to the fitting was used. Thus, all regional TACs from a scan were estimated simultaneously. Individual estimates for plasma-to-tissue clearance (K1) and the fractional rate of specific binding (k3) were obtained for each region, but other parameters were estimated as common across regions. The total volume of distribution for each region [VT, (Innis et al., 2007) ] was calculated using Equation 1.
| (1) |
The apparent fractional RO (ROapp) by GSK239512 in scans 2 and 3 relative to the baseline scan was calculated from the slopes of a revised Lassen plot (Cunningham et al., 2009). Thus, (VTbaseline – VTocc) was plotted against VTbaseline for each region of scans 2 and 3, and linear fits to these two datasets with a common intercept on the x axis were obtained using linear least squares. ROapp was calculated from the slopes of the fits and an estimate of non-displaceable volume of distribution (VND) obtained from the intercept on the x axis. The RO derived in this way is referred to as ‘apparent’ because [11C]GSK189254 displays a very high affinity for the H3 receptor with significant self occupancy at the doses used in these PET scans (Ashworth et al., 2010). Planeta-Wilson et al. (2010) have published an algorithm to correct for these effects within scans and for the carry-over of GSK189254 between scans carried out in succession, which has been implemented here. The mean plasma concentration of GSK189254 between 60 and 90 min in each scan was calculated from the measured input functions and the specific activity of [11C]GSK189254 at the time of injection, with appropriate decay corrections. The carry-over from scan 1 to scan 2 was estimated by extrapolating the input function from scan 1 into the 60–90 min period of scan 2. A half saturation constant of 0.031 nM [in plasma (Ashworth et al., 2010) ] was then used within the correction algorithm (Planeta-Wilson et al., 2010) to correct the occupancy values in this study.
Relationship between GSK239512 exposure in plasma and RO
The plasma exposure–RO relationship (PK/RO) was analysed by a population-modelling approach implemented in the NONMEM software (Beal and Sheiner, 1998). The analysis uses (i) the average GSK239512 concentration in plasma during each PET scan, calculated as the geometric mean of blood samples taken before and after the scan (cf. section blood sampling and metabolite analysis) and (ii) the corrected RO values at each scan (cf. section kinetic analysis of PET data).
The population-modelling approach applies a non-linear mixed-effects model to repeated measurements from a group of individuals (the population), and describes the influence of both fixed effects and random effects (Sheiner, 1984; Aarons, 1991). Fixed effects or population values are factors that are either measured or controlled; random effects are factors that cannot be controlled, and are divided into residual error and between-subject random effects. One main advantage of this population-modelling approach is that it offers the possibility of gaining integrated information on pharmacokinetics and response from relatively sparse observational data and thus, it is often used for PK analysis (Food and Drug Administration, 1999).
With only three scans per subject, the PK/RO model of choice was a simple Emax model relating the average GSK239512 plasma concentration during the PET scan (Cpi) to the corrected drug occupancy derived from the kinetic PET data analysis (ROi, Equation 2; Burton et al., 2011).
| (2) |
where i denotes subject, ROi is the corrected drug occupancy, Cpi is GSK239512 average concentration in plasma during PET scan, Emax is the maximum drug occupancy, ECi50 is the plasma concentration leading to 50% of drug occupancy.
All PK and RO data were simultaneously fitted and the estimation method used was the first-order conditional estimation method with interaction. Between-subject variability was considered for ECi50 and was characterized by a log-normal distribution. Emax was fixed to 100%. A proportional error model was used to describe the residual variability in the drug occupancy values derived from the kinetic PET data analysis.
The selection of the PK/RO model was based on scientific judgement, the goodness-of-fit plots and the difference in NONMEM objective function (approximately −2 × log likelihood) between hierarchical models (i.e. the likelihood ratio test; Jonsson and Karlsson, 1998). Model adequacy was assessed using simulation-based diagnostics such as visual-predictive check, which visually compared simulated data with observed data (Karlsson and Savic, 2007). In particular, the median, the 5th and the 95th percentiles of simulated RO values from the PK/RO model (300 replicates), were plotted and superposed on the corrected RO values derived from kinetic PET data analysis.
Results
Volunteers reported no adverse events that were considered to be related to the study drug by the investigator.
Occupancy of the H3 receptor by GSK239512
Following oral administration of GSK239512, there was a reduction in the brain uptake of [11C]GSK189254 (Figure 1). A marked reduction in regional VT was apparent following GSK239512 administration at all the doses tested, even doses as low as 6 μg (Tables 1 and 2). This effect was seen in all regions, including the cerebellum.
Figure 1.
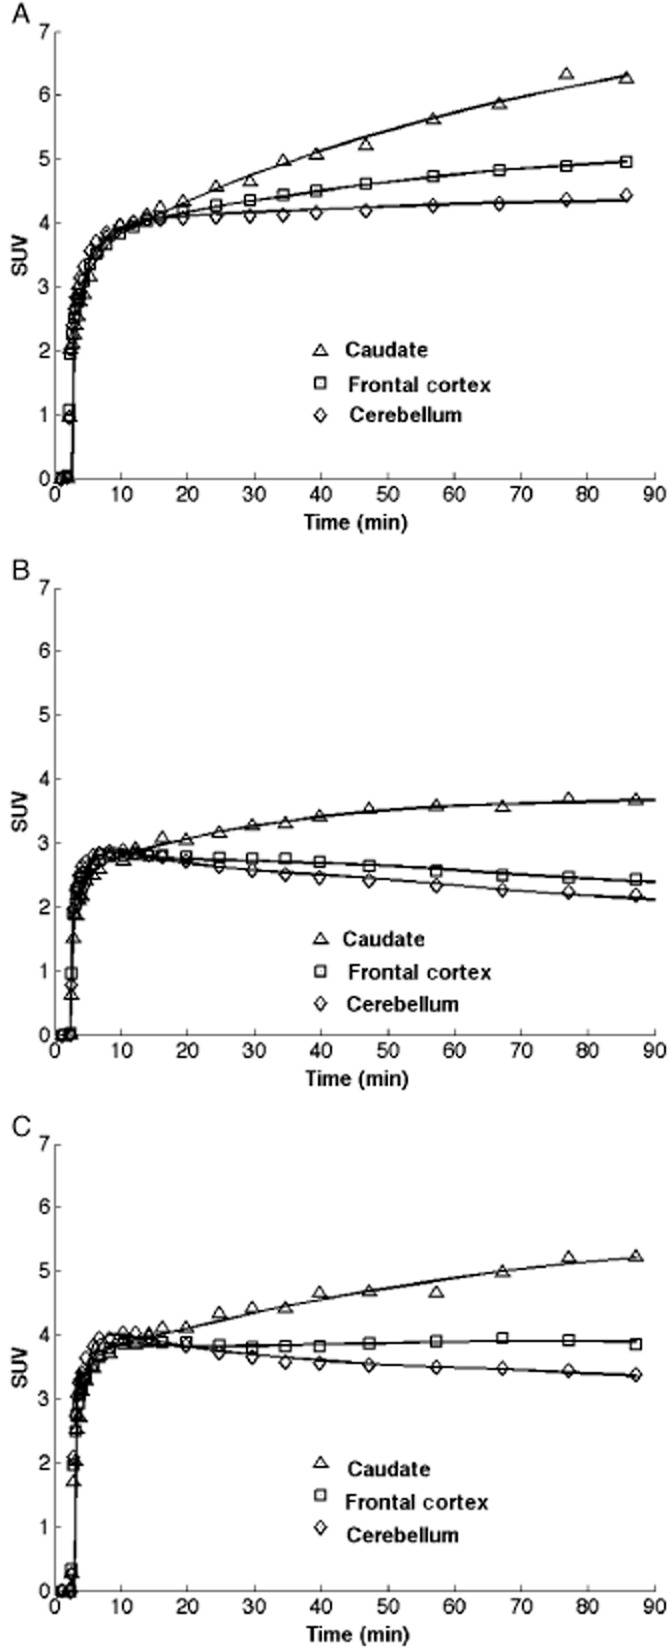
Representative time-activity curves from one subject following administration of [11C]GSK189254 at baseline (a), 4h (b) and 24h (c) after an oral dose of GSK239512 (14 μg).
Table 1.
Estimates of regional VT before and after oral administration of GSK239512
| 4 h after administration of GSK239512 | 24 h after administration of GSK239512 | ||||||
|---|---|---|---|---|---|---|---|
| ROI | Baseline (n = 6) (mean ± SD) | 6 μg (n = 3) (mean ± SD) | 14 μg (n = 2) (mean) | 120 μg (n = 1) | 6 μg (n = 3) (mean ± SD) | 14 μg (n = 2) (mean) | 120 μg (n = 1) (mean) |
| Caudate | 49.6 ± 11.1 | 25.8 ± 3.0 | 23.8 | 7.90 | 35.5 ± 11.7 | 36.4 | 16.6 |
| Putamen | 71.0 ± 12.0 | 35.3 ± 1.7 | 28.8 | 8.98 | 46.2 ± 11.1 | 44.0 | 19.4 |
| Cerebellum | 20.4 ± 3.8 | 11.0 ± 0.6 | 11.8 | 6.03 | 14.2 ± 0.7 | 17.7 | 10.2 |
| Frontal cortex | 25.6 ± 4.1 | 13.4 ± 0.5 | 13.0 | 6.11 | 18.4 ± 2.1 | 20.7 | 9.94 |
| Parietal cortex | 21.5 ± 3.5 | 11.8 ± 0.3 | 11.6 | 6.17 | 16.1 ± 1.8 | 17.9 | 9.40 |
| Occipital cortex | 20.6 ± 3.2 | 10.9 ± 0.5 | 11.2 | 6.20 | 14.9 ± 1.6 | 17.0 | 9.12 |
| Insula cortex | 33.1 ± 3.8 | 17.0 ± 0.4 | 15.4 | 7.07 | 23.0 ± 2.8 | 25.0 | 12.6 |
| Anterior cingulate cortex | 37.2 ± 7.1 | 19.5 ± 1.7 | 15.8 | 6.45 | 24.9 ± 2.2 | 25.3 | 12.1 |
| Hippocampus | 17.4 ± 3.4 | 10.3 ± 0.6 | 11.1 | 6.05 | 13.1 ± 0.8 | 15.8 | 8.81 |
| Amygdala | 31.8 ± 4.6 | 16.6 ± 1.6 | 15.4 | 6.81 | 23.1 ± 2.8 | 22.2 | 11.4 |
| Thalamus | 20.7 ± 4.1 | 11.8 ± 0.3 | 12.8 | 6.31 | 15.8 ± 1.4 | 19.1 | 9.29 |
Table 2.
Estimates of regional VT before and after oral administration of GSK239512 for volunteer 4
| Region of interest | Baseline | 4h after administration of 14 ug of GSK239512 |
|---|---|---|
| Caudate | 83.1 | 24.4 |
| Putamen | 120.1 | 28.2 |
| Cerebellum | 27.5 | 13.5 |
| Motor cortex | 37.5 | 14.5 |
| Thalamus | 23.8 | 13.4 |
Figure 2 shows representative plots of (VTbaseline – VTocc) versus VTbaseline following administration of GSK239512 at each dose. Occupancies determined from these plots were high across all doses tested, including the lowest dose of 6 μg. After correction for tracer self-occupancy (see Methods), occupancies by GSK239512 of 62–70% and 40–64% were observed in the three volunteers dosed at 6 μg at Tmax and at 24 h respectively (Table 3).
Figure 2.
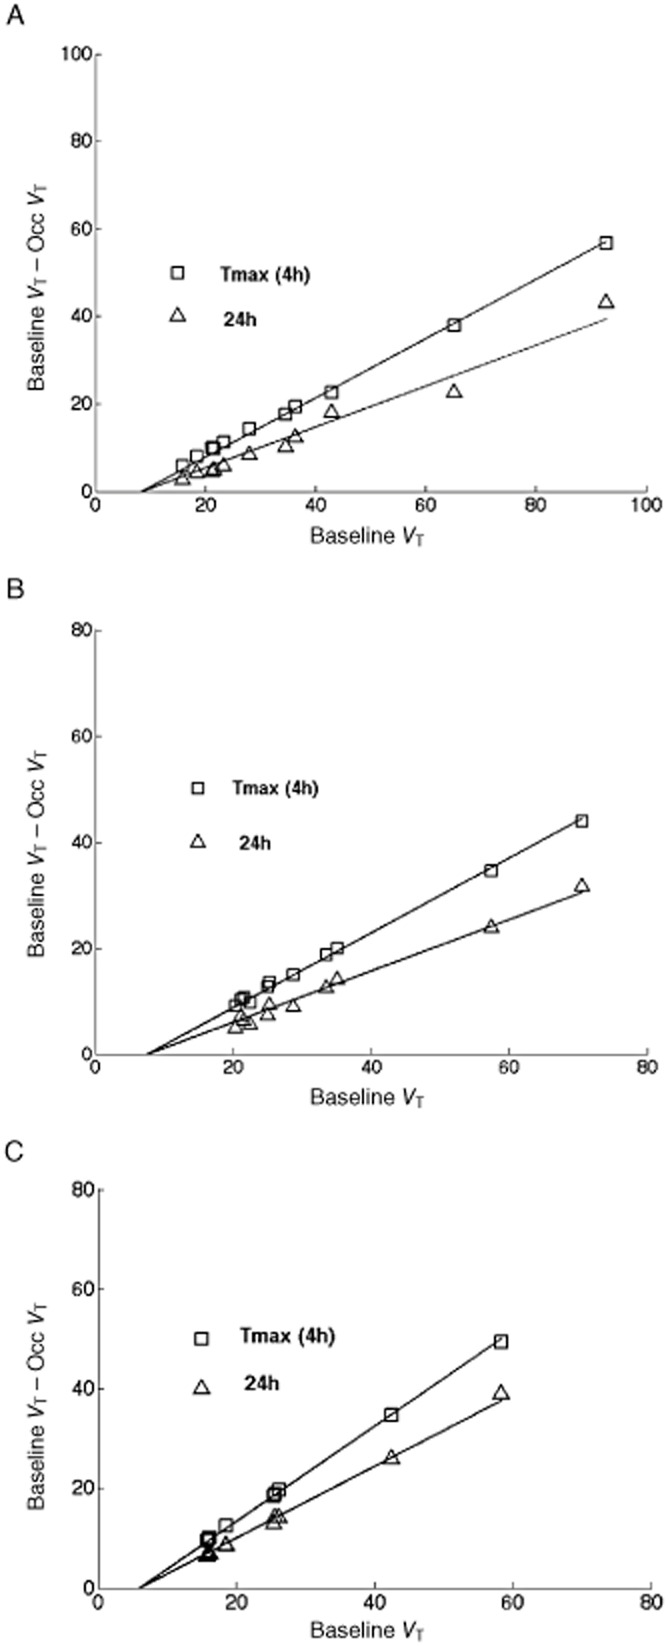
Graphical estimation of occupancy and VND of GSK239512 for individual volunteers at Tmax (4h) and at 24h after administration of 6 μg (a), 14 μg (b) and 120 μg (c).
Table 3.
Receptor occupancy of GSK239512 for each volunteer
| Receptor occupancy | ||||||
|---|---|---|---|---|---|---|
| Volunteer | Dose (ug) | Scan time (h after dose) | Average plasma GSK239512 concentration (ng·mL−1) | VND | No tracer occupancy correction | Tracer occupancy correction |
| 1 | 120 | 3.5 | 0.18[1] | 6.1 | 95.5 | 97.5 |
| 24 | 0.08 | 72.0 | 85.0 | |||
| 2 | 14 | 4 | 0.033 | 7.6 | 70.6 | 74.5 |
| 24 | 0.008 | 48.5 | 55.3 | |||
| 3 | 14 | 4 | 0.015 | −1.7 | 49.6 | 49.3 |
| 24 | 0.006 | 20.3 | 24.3 | |||
| 4 | 14 | 4 | 0.018 | 10.9 | 83.4 | 87.5 |
| 24 | NA | NA | NA | |||
| 5 | 6 | 4 | 0.012 | 7.6 | 59.3 | 62.2 |
| 24 | 0.0033[2] | 57.6 | 63.7 | |||
| 6 | 6 | 4 | 0.007 | 6.5 | 63.5 | 67.2 |
| 24 | 0.004[2] | 31.4 | 39.5 | |||
| 7 | 6 | 4 | 0.009 | 8.4 | 67.7 | 70.0 |
| 24 | 0.0034[2] | 46.7 | 54.3 | |||
Concentration unphysiologically high. Replaced with relevant concentrations from scan 3, subject 1.
Concentrations < limit of quantification (0.005 ng·mL−1). Extrapolation from the rest of the plasma concentration profile.
NA, not available as the subject withdrew from the study.
Relationship between GSK239512 exposure in plasma and RO
Table 3 also lists the average GSK239512 concentrations in plasma during each scan. Despite the low number of volunteers in this study, the mean plasma concentrations during scans 2 and 3 for each volunteer suggested a proportional increase in GSK239512 plasma exposure across the doses tested.
Table 4 describes the estimated fixed effect and random effect parameters of the PK/RO model. The estimated population plasma EC50 was 0.0068 ng·mL−1 and was associated with a large between-volunteer variability of 45%. The residual error was estimated to be approximately 23%. Figure 3 compares the simulated PK/RO profiles generated by the model and the corrected RO values directly derived from the PET observations. A total of 91% of the observations fell between the 5th and the 95th percentiles of the simulated profiles (percentiles represented by the dotted line on Figure 3). In addition, the corrected RO values derived from the study appeared to be randomly distributed around the median of the PK/RO simulations, irrespective of the time of the scan (+ and Δ versus the continuous line on Figure 3).
Table 4.
Estimates from the direct Emax PK/RO model.
| Parameter | Units | Estimate | Standard error (%RMSE) |
|---|---|---|---|
| Fixed-effect parameter | |||
| EC50 | ng·mL−1 | 0.0068 | ±0.0023 ng·mL−1 |
| Random-effect parameters | |||
| Between-volunteer variability around EC50 | % | 45 | ±22% |
| Residual error | % | 23 | ±6.5% |
% RMSE, percentage root mean square error.
Figure 3.
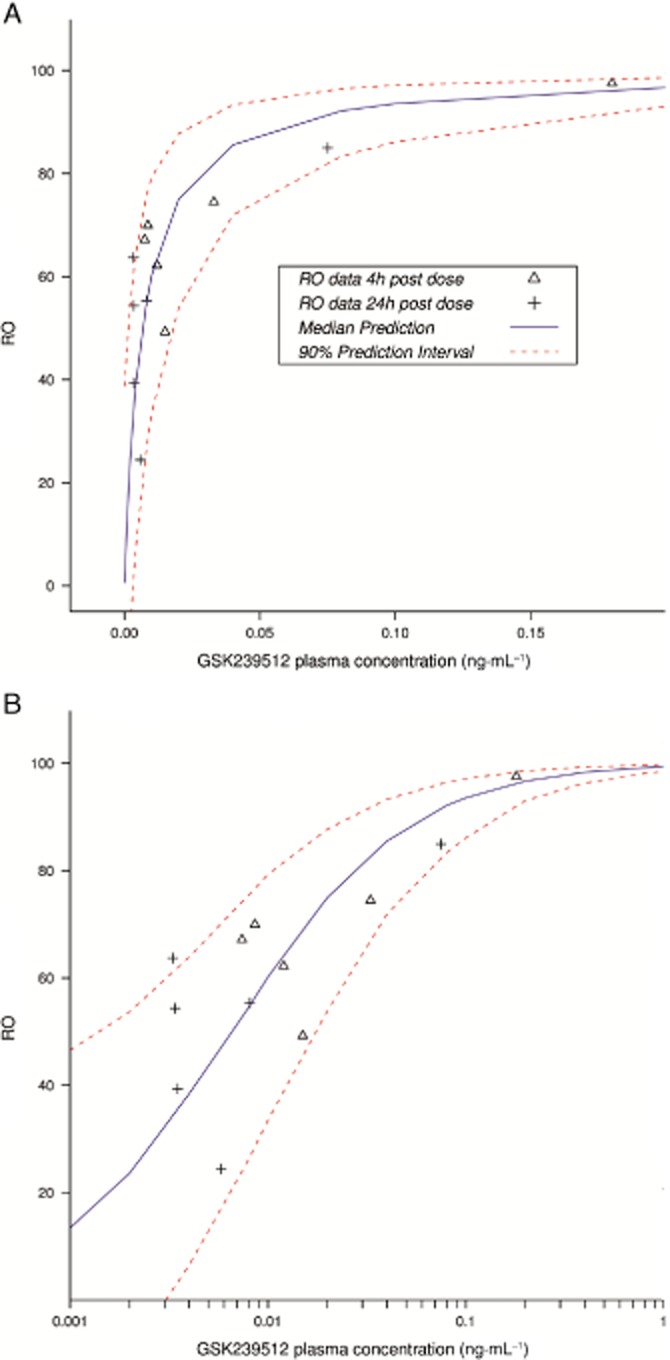
Corrected RO value derived from the study and simulations from the PK/RO model. Please note that the upper graph has a linear concentration scale and the lower graph a logarithmic scale.
The plasma-free fraction (fP) of GSK239512 is 0.25 (Wilson et al., 2013) and its molecular weight is 377.49. The estimated plasma EC50 of 0.0068 ng·mL−1 therefore corresponds to a free KD in vivo of 4.50 × 10⁻¹² M, that is pK = 11.3.
Discussion
Drug candidates with high occupancy of H3 receptors in the brain have been shown to produce poor tolerability because of common adverse events associated with sleep disturbance (Brioni et al., 2011). Knowledge of the level of RO associated with such adverse events, and the relationship between RO and plasma levels (PK) may allow a dosing regimen to be designed (or formulations developed) to mitigate such risks. In the present study, we modelled the relationship between PK and the occupancy of the H3 receptors in the brain (RO) by the novel H3 receptor antagonist, GSK239512, in healthy volunteers. The PK/RO model used allowed the simulation of steady-state PK–RO curves following any dose. This approach proved to be very valuable in exploring doses to be used in subsequent studies with GSK239512 and guided the early development of this molecule, which has been under development for the symptomatic treatment of cognitive impairment, primarily in mild-to-moderate Alzheimer's disease.
Following an oral dose of GSK239512 (6, 14 or 120 μg), occupancy measurements were made at 4 h after dosing and at 24 h, to investigate the time course of RO. Based on previous published pharmacokinetic data (Nathan et al., 2013), the peak plasma concentration of GSK239512 was expected to occur within 2–4 h after dose and the mean plasma half-life was 14 h. In general, the occupancy measured at 4 h was higher (49.3–97.5%) than at 24 h (24.3–85.0%).
[11C]GSK189254 was used as the radioligand in the present study. It might be noted that, under tracer conditions, it is not necessary to take into account the affinity of the radioligand or its mass dose when estimating the occupancy of competing unlabelled drugs at pharmacologically active concentrations. However, because of its very high affinity, [11C]GSK189254 is subject to tracer mass–dose effects when used in vivo (Plisson et al., 2009; Ashworth et al., 2010). A correction to the occupancy data was therefore required, to account for the contribution of the tracer occupancy (Planeta-Wilson et al., 2010) and resulted in higher final occupancies compared with uncorrected values. This tracer correction affected the estimation of the PK/RO model parameters, and more particularly the population estimate of EC50, which was decreased by 25% (data not shown), together with the resulting PK–RO curves.
In the present study, the in vivo affinity of GSK239512 for the human H3 receptor, equivalent to a negative log of the dissociation constant (pK), was estimated as 11.3, that is KD = 4.50 × 10⁻¹² M. This estimate, which takes into account a plasma-free fraction (fP) of 0.25 for GSK239512 and which presumes a one-to-one ratio of free concentration between brain and plasma, is more than an order of magnitude higher than that measured in vitro for the same compound, assuming 100% free compound in the assay (pK = 9.9–9.7; KD = 1.26-2.00 × 10⁻¹⁰ M; Wilson et al., 2013). It might be noted that the structurally similar compound, GSK189254, shows a similar discrepancy in humans between in vivo estimates of pK, determined using PET (pK = 11.0, KD = 1.00 × 10⁻¹¹ M Ashworth et al., 2010), compared with an in vitro pK of 9.9–9.6 (KD = 1.26–2.51 × 10⁻¹⁰ M Medhurst et al., 2007). Preclinical studies in pig, however, show a closer agreement between estimates in vivo and in vitro for both compounds. Thus the in vivo affinity in the pig of GSK239512 (pK = 10.4, KD = 3.98 × 10⁻¹¹ M) is closer to the corresponding in vitro estimate (pK = 9.9, KD = 1.26 × 10⁻¹⁰ M; unpublished data); and likewise, the in vivo affinity in the pig of GSK189254 (pK = 10.0, KD = 1.00 × 10⁻¹⁰ M, Plisson et al., 2009) is similar to the in vitro estimate (pK 9.6, KD = 2.51 × 10⁻¹⁰ M, Plisson et al., 2009).
Several possible explanations for the apparent higher in vivo affinity of GSK239512 were considered. Diffusion limitation as a result of a high Bmax leading to re-association of both radiotracer and drug could decrease the apparent washout rates from the tissue (Hirvonen et al., 2010; Sanabria-Bohórquez and Van Laere, 2010), but in this case, it would be expected that the apparent rates of uptake would also be changed to the same extent, and the estimated binding potential refers to an equivalent equilibrium state. Internalization of the H3 receptor may affect the apparent rate of dissociation of the drug, although no studies on GSK239512 and H3 receptor internalization have been conducted. A further possible explanation for differences in tracer affinity between in vivo and in vitro might be simple competition with endogenous histamine, but this would result in a decrease in the apparent affinity relative to in vitro estimates, not an increase as seen here.
The data from this study did not suggest evidence of any delay between the occurrence of the maximum GSK239512 concentration (Cmax) in the plasma and the maximum RO in the tissue. A direct Emax model linking the plasma drug exposure and occupancy and assuming equivalent half-life in plasma and in brain appeared to properly fit the data. However, potential delay between the drug PK and RO was explored using a more complex indirect model (kon–koff model), involving a finite rate of exchange between free and bound drug in the tissue (data not shown). This model did not provide any improvement in model fitting, as depicted by goodness-of-fit plots or likelihood ratio test. In addition, although the data from the PET study could not reliably estimate all the parameters of the kon–koff model, the estimated mean ratio between koff and kon was very close to the EC50 derived from the Emax model.
In order to properly characterize the time course occupancy profiles, a study design including flexible PET scan time points should be considered more appropriate (rather than fixed time points like 4 and 24 h). This optimization of post-dose PET scan timings was recently described by Zamuner et al. (2010), using the adaptive-optimal design methods and the d-optimality criterion. The PK/RO analysis adopted in this study illustrates the integration of PET occupancy studies into drug development, particularly in terms of dose selection and optimization.
Without the in vivo affinity data, dose selection for clinical trials with the candidate drug discussed here would be erroneously high, potentially leading to a higher incidence of adverse events such as sleep disturbances. In vivo experiments in humans such as those possible with PET are therefore highly beneficial in providing accurate measurements to support the optimal design and dosing regimens of clinical trials and thereby ensuring successful drug development.
Acknowledgments
We thank staff of CAMH who carried out the acquisition of the data and provided care for the volunteers while they underwent the procedures.
Sharon Ashworth, Alienor Berges, Eugenii Rabiner, Robert Comley, Robert Lai, Rebecca Boardley, Graham Searle, Roger Gunn, Marc Laruelle and Vincent Cunningham were all GSK employees at the time the study was conducted. Alan Wilson's contribution was funded by GSK.
Abbreviations
- CNS
central nervous system
- FSPGR
fast spoiled gradient echo
- GPCRs
G-protein coupled receptors
- HPLC
high-performance liquid chromatography
- MRI
magnetic resonance imaging
- MS
mass spectrometry
- PET
positron emission tomography
- PK
plasma levels
- RO
receptor occupancy
- ROI
region of interest
- SUV
standard uptake value
- SPM
statistical parametric mapping
- TAC
time–activity curve
Conflicts of interest
None.
References
- Aarons L. Population pharmacokinetics: theory and practice. Br J Clin Pharmacol. 1991;32:669–670. [PMC free article] [PubMed] [Google Scholar]
- Alexander SPH, Benson HE, Faccenda E, Pawson AJ, Sharman JL, Catterall WA, Spedding M, Peters JA, Harmar AJ CGTP Collaborators. The Concise Guide to PHARMACOLOGY 2013/14: Overview. Br J Pharmacol. 2013;170:1449–1867. doi: 10.1111/bph.12447. [DOI] [PMC free article] [PubMed] [Google Scholar]
- Arrang JM, Garbarg M, Schwartz JC. Auto-inhibition of brain histamine release mediated by a novel class (H3) of histamine receptor. Nature. 1983;302:832–837. doi: 10.1038/302832a0. [DOI] [PubMed] [Google Scholar]
- Ashworth S, Rabiner EA, Gunn RN, Plisson C, Wilson AA, Comley RA, et al. Evaluation of 11C-GSK189254 as a novel radioligand for the H3 receptor in humans using PET. J Nucl Med. 2010;51:1021–1029. doi: 10.2967/jnumed.109.071753. [DOI] [PubMed] [Google Scholar]
- Beal S, Sheiner LB. 1998. NONMEM User Guides (Nonmem Project Group)
- Brambilla M, Secco C, Dominietto M, Matheoud R, Sacchetti G, Inglese E. Performance characteristics obtained for a new 3-dimensional lutetium oxyorthosilicate-based whole-body PET/CT scanner with the national electrical manufacturers association NU 2-2001 standard. J Nucl Med. 2005;46:2083–2091. [PubMed] [Google Scholar]
- Brioni JD, Esbenshade TA, Garrison TR, Bitner SR, Cowart MD. Discovery of histamine H3 antagonists for the treatment of cognitive disorders and Alzheimer's disease. J Pharmacol Exp Ther. 2011;336:38–46. doi: 10.1124/jpet.110.166876. [DOI] [PubMed] [Google Scholar]
- Burton ME, Shaw LM, Schentag JJ, Evans WE. Applied Pharmacokinetics and Pharmacodynamics: Principles of Therapeutic Drug Monitoring. Baltimore: Lippincott, Williams, Wilkins; 2011. [Google Scholar]
- Celanire S, Wijtmans M, Talaga P, Leurs R, de Esch IJP. Keynote review: histamine H3 receptor antagonists reach out for the clinic. Drug Discov Today. 2005;10:1613–1627. doi: 10.1016/S1359-6446(05)03625-1. [DOI] [PubMed] [Google Scholar]
- Cunningham VJ, Rabiner EA, Slifstein M, Laruelle M, Gunn RN. Measuring drug occupancy in the absence of a reference region: the Lassen plot re-visited. J Cereb Blood Flow Metab. 2009;30:46–50. doi: 10.1038/jcbfm.2009.190. [DOI] [PMC free article] [PubMed] [Google Scholar]
- Food and Drug Administration. Guidance for industry on population pharmacokinetics; Availability. FDA, HHS. Notice. Fed Regist. 1999;64:6663–6664. [PubMed] [Google Scholar]
- Food and Drug Administration. 2001. Guidance for Industry; Bioanalytical Method Validation. FDA, HHS. Notice. Fed Regist.
- Hancock AA, Fox GB. Perspectives on cognitive domains, H3 receptor ligands and neurological disease. Expert Opin Investig Drugs. 2004;13:1237–1248. doi: 10.1517/13543784.13.10.1237. [DOI] [PubMed] [Google Scholar]
- Hill SJ, Ganellin CR, Timmerman H, Schwartz JC, Shankley NP, Young JM, et al. International union of pharmacology. XIII. Classification of histamine receptors. Pharmacol Rev. 1997;49:253–278. [PubMed] [Google Scholar]
- Hilton J, Yokoi F, Dannals RF, Ravert HT, Szabo Z, Wong DF. Column-switching HPLC for the analysis of plasma in PET imaging studies. Nucl Med Biol. 2000;27:627–630. doi: 10.1016/s0969-8051(00)00125-6. [DOI] [PubMed] [Google Scholar]
- Hirvonen J, Terry GE, Halldin C, Pike VW, Innis RB. Approaches to quantify radioligands that wash out slowly from target organs. Eur J Nucl Med Mol Imaging. 2010;37:917–919. doi: 10.1007/s00259-010-1426-0. [DOI] [PMC free article] [PubMed] [Google Scholar]
- Innis RB, Cunningham VJ, Delforge J, Fujita M, Gjedde A, Gunn RN, et al. Consensus nomenclature for in vivo imaging of reversibly binding radioligands. J Cereb Blood Flow Metab. 2007;27:1533–1539. doi: 10.1038/sj.jcbfm.9600493. [DOI] [PubMed] [Google Scholar]
- Jonsson EN, Karlsson MO. Automated covariate model building within NONMEM. Pharm Res. 1998;15:1463–1468. doi: 10.1023/a:1011970125687. [DOI] [PubMed] [Google Scholar]
- Karlsson MO, Savic RM. Diagnosing model diagnostics. Clin Pharmacol Ther. 2007;82:17–20. doi: 10.1038/sj.clpt.6100241. [DOI] [PubMed] [Google Scholar]
- Martinez-Mir MI, Pollard H, Moreau J, Arrang JM, Ruat M, Traiffort E. Three histamine receptors (H1, H2 and H3) visualised in the brain of human and nonhuman primates. Brain Res. 1990;526:322–327. doi: 10.1016/0006-8993(90)91240-h. [DOI] [PubMed] [Google Scholar]
- Medhurst AD, Atkins AR, Beresford IJ, Brackenborough K, Briggs MA, Calver AR, et al. GSK189254, a novel H3 receptor antagonist that binds to histamine H3 receptors in Alzheimer's disease brain and improves cognitive performance in preclinical models. J Pharmacol Exp Ther. 2007;321:1032–1045. doi: 10.1124/jpet.107.120311. [DOI] [PubMed] [Google Scholar]
- Mintun MA, Raichle ME, Kilbourn MR, Wooten GF, Welch MJ. A quantitative model for the in vivo assessment of drug binding sites with positron emission tomography. Ann Neurol. 1984;15:217–227. doi: 10.1002/ana.410150302. [DOI] [PubMed] [Google Scholar]
- Nathan PJ, Boardley R, Scott N, Berges A, Maruff P, Sivananthan T, et al. The safety, tolerability, pharmacokinetics and cognitive effects of GSK239512, a selective histamine H3 receptor antagonist in patients with mild to moderate Alzheimer's disease: a preliminary investigation. Curr Alzheimer Res. 2013;10:240–251. doi: 10.2174/1567205011310030003. [DOI] [PubMed] [Google Scholar]
- Nguyen T, Shapiro DA, George SR, Setola V, Lee D, Cheng R, et al. Discovery of a novel member of the histamine receptor family. Mol Pharmacol. 2001;59:427–433. doi: 10.1124/mol.59.3.427. [DOI] [PubMed] [Google Scholar]
- Parmentier R, Anaclet C, Guhennec C, Brousseau E, Bricout D, Giboulot T, et al. The brain H3-receptor as a novel therapeutic target for vigilance and sleep-wake disorders. Biochem Pharmacol. 2007;73:1157–1171. doi: 10.1016/j.bcp.2007.01.002. [DOI] [PubMed] [Google Scholar]
- Pillot C, Heron A, Cochois V, Tardivel-Lacombe J, Ligneau X, Schwartz JC, et al. A detailed mapping of the histamine H3 receptor and its gene transcripts in rat brain. Neuroscience. 2002;114:173–193. doi: 10.1016/s0306-4522(02)00135-5. [DOI] [PubMed] [Google Scholar]
- Planeta-Wilson B, Labaree D, Gallezot J-D, Lin S-F, Nabulsi N, Williams WA, et al. A correction algorithm for carryover of tracer in paired C-11 studies: Application to the H-3 receptor antagonist [C-11]GSK189254. Neuroimage. 2010;52:S166. 201. [Google Scholar]
- Plisson C, Gunn RN, Cunningham VJ, Bender D, Salinas CA, Medhurst AD, et al. 11C-GSK189254: a selective radioligand for in vivo central nervous system imaging of histamine H3 receptors by PET. J Nucl Med. 2009;50:2064–2072. doi: 10.2967/jnumed.109.062919. [DOI] [PubMed] [Google Scholar]
- Prast H, Tran MH, Fischer H, Kraus M, Lamberti C, Grass K, et al. Histaminergic neurons modulateacetylcholine release in the ventral striatum: role of H3 histamine receptors. Naunyn Schmiedebergs Arch Pharmacol. 1999;360:558–564. doi: 10.1007/s002109900097. [DOI] [PubMed] [Google Scholar]
- Sanabria-Bohórquez SM, Van Laere K. Quantitative PET imaging of radioligands with slow kinetics in human brain. Eur J Nucl Med Mol Imaging. 2010;37:1613–1615. doi: 10.1007/s00259-010-1518-x. [DOI] [PubMed] [Google Scholar]
- Schlicker E, Fink K, Hinterthaner M, Gothert M. Inhibition of noradrenaline release in the rat brain cortex via presynaptic H3 receptors. Naunyn Schmiedebergs Arch Pharmacol. 1989;340:633–638. doi: 10.1007/BF00717738. [DOI] [PubMed] [Google Scholar]
- Sheiner LB. The population approach to pharmacokinetic data analysis: rationale and standard data analysis methods. Drug Metab Rev. 1984;15:153–171. doi: 10.3109/03602538409015063. [DOI] [PubMed] [Google Scholar]
- Wellcome Trust Centre for Neuroimaging. 2003. Statistical Parametric Mapping. Available at: http://www.fil.ion.ucl.ac.uk/spm (accessed 10 January 2014)
- Wilson AA, Dasilva JN, Houle S. Facile radiolabelling and purification of 2β-[O-11CH3]-carbomethoxy-3β-aryltropanes: radiotracers for the dopamine transporter. J Label Compd Radiopharm. 1994;34:759–765. [Google Scholar]
- Wilson D, Apps J, Bailey N, Bamford MJ, Beresford IJ, Brackenborough K, et al. Identification of clinical candidates from the benzazepine class of histamine H3 receptor antagonists. Bioorg Med Chem Lett. 2013;23:6890–6896. doi: 10.1016/j.bmcl.2013.09.090. [DOI] [PubMed] [Google Scholar]
- Yoshimoto R, Miyamoto Y, Shimamura K, Ishihara A, Takahashi K, Kotani H, et al. Therapeutic potential of histamine H3 receptor agonist for the treatment of obesity and diabetes mellitus. Proc Natl Acad Sci U S A. 2006;103:13866–13871. doi: 10.1073/pnas.0506104103. [DOI] [PMC free article] [PubMed] [Google Scholar]
- Zamuner S, Di Iorio VL, Nyberg J, Gunn RN, Cunningham VJ, Gomeni R, et al. Adaptive-optimal design in PET occupancy studies. Clin Pharmacol Ther. 2010;87:563–571. doi: 10.1038/clpt.2010.9. [DOI] [PubMed] [Google Scholar]