

Abstract
Purpose
Currently, there is no reliable tool to predict response to intravesical bacillus Calmette-Guérin (BCG). Based on the fact that BCG is a Th1-polarizing immunotherapy, we attempt to correlate the pretreatment immunologic tumor microenvironment (Th1 or Th2) with response to therapy.
Materials and methods
Bladder cancer patients with initial diagnosis of carcinoma in situ (Tis) were stratified based on their response to BCG treatment. A total of 38 patients met inclusion criteria (20 patients who responded and 18 patients who did not respond). Immunohistochemical (IHC) methods known to assess the type of immunologic microenvironment (Th1 vs. Th2) were performed on tumor tissue obtained at initial biopsy/resection: the level of tumor eosinophil infiltration and degranulation (Th2 response); the number of tumor-infiltrating GATA-3+ (Th2-polarized) lymphocytes; and the number of tumor-infiltrating T-bet+ (Th1-polarized) lymphocytes. Results obtained from these metrics were correlated with response to treatment with BCG immunotherapy.
Results
The IHC metrics of the tumor immune microenvironment prior to BCG treatment were each statistically significant predictors of responders (R) vs. nonresponders (NR). Eosinophil infiltration and degranulation was higher for R vs. NR: 1.02±0.17 vs. 0.5±0.12 (P = 0.01) and 1.1±0.15 vs. 0.56±0.15 (P = 0.04), respectively. Ratio of GATA-3+ (Th2-polarized) lymphocytes to T-bet+ (Th1-polarized) lymphocytes was higher for R vs. NR: 4.85±0.94 vs. 0.98±0.19 (P<0.001). The 3 markers were combined to create a Th2 signature biomarker, which was a statistically significant (P<0.0001) predictor of R vs. NR. All IHC markers demonstrated that a preexisting Th1 immunologic environment within the tumor was predictive of BCG failure.
Conclusion
The Th1 vs. Th2 polarization of bladder tumor immune microenvironment prior to treatment with BCG represents a prognostic metric of response to therapy. If a patient has a preexisting Th1 immunologic response within the tumor, there is no value in using a therapy intended to create a Th1 immunologic response. An algorithm integrating 3 IHC methods provided a sensitive and specific technique that may become a useful tool for pathologists and urologists to predict response to BCG in patients with carcinoma in situ of the bladder.
Keywords: Eosinophils, Tumor immune microenvironment, GATA-3, T-bet, Degranulation, Bladder cancer
1. Introduction
Non–muscle invasive bladder cancer (NMIBC) represents 70% of all initial bladder cancer diagnoses [1] and [2] with Tis tumors present in 10% to 15% of these patients [3]. The propensity of Tis tumors to progress to an invasive phenotype in up to 83% of untreated cases is indicative of a potentially aggressive tumor [4] and [5]. The intravesical administration of live attenuated bacillus Calmette-Guérin (BCG) is the primary postresection treatment option for NMIBC [6]. Nonetheless, the reported response rate to this therapy is only 60% with a 5-year recurrence rate of 30% to 40% [7] and [8]. Moreover, for those patients with T1 disease or carcinoma in situ or both that are unresponsive to BCG therapy, the risk of progression to invasive disease may reach 50% [9] and [10].
Intravesical administration of BCG is hypothesized to act as a localized Th1-polarizing immunomodulator that induces a massive influx of inflammatory cells (e.g., Th1-polarized lymphocytes and neutrophils), the generation of classically activated resident tissue macrophages (M1), the production of Th1 as well as late phase inflammatory cytokines in the bladder mucosa and lumen (e.g., IFN-γ, IL-12, and TNF-α), and ultimately the generation of tumor cell-targeted, Th1-mediated cytotoxic responses [11] and [12]. Based on this hypothesis, one would expect a preexisting Th2 immune microenvironment represented by Th2-polarized lymphocytes and eosinophils, as previously described [13] and [14], that would be susceptible to BCG Th1 polarization. Reliable and reproducible assessments of the induced changes within the bladder tumor immune microenvironment prior to treatment with BCG are sparse [15]. Thus, patients with NMIBC are treated with BCG using a “one-size-fits-all” approach with a general belief that efficacy is dependent on polarizing bladder tumor immune responses to the Th1 type. The out-of-the-box diagnostic approach described in this study is based on the proposed goal of BCG immune therapy to elicit antitumorigenic Th1 immune responses within the bladder tumor immune microenvironment. Our hypothesis is that assessments of the tumor immune microenvironment at the time of initial patient diagnosis would provide needed metrics to identify the 4 of 10 patients with NMIBC whose tumor immune microenvironments are already Th1 polarized and are unlikely to respond to standard-of-care BCG therapy. In other words, if the goal of BCG induction is to incite a Th1 response, then determining the baseline immunologic environment (Th1 or Th2) should be performed to see whether polarization one way or the other is associated with response. In addition, our goal was to determine the optimal test or combination of tests to assess “degree” or ratio of Th1 or Th2 polarization and to develop a possible novel diagnostic assessment of the baseline tumor-associated immunologic environment.
2. Materials and methods
2.1. Study subjects
After institutional review board approval, a retrospective review of our bladder cancer registry was conducted. Patients included for analysis had to have their initial resection and diagnosis at our institution, have no history of previous treatment (e.g., intravesical therapy), a Tis only (no Ta, T1, or ≥ T2) diagnosis, and have only received a single, standard 6-cycle induction course of BCG (Tice, Merck & Co., Inc., Whitehouse Station, NJ), but no other intravesical therapy at the time of resection or following resection. All patients included in this analysis had follow-up for 6 to 8 weeks following completion of induction BCG. Patients were stratified as nonresponders (NR) if they had a biopsy positive for Cis following the induction course of BCG. Responders (R) were defined as patients without any recurrence or evidence of disease based on follow-up cystoscopy, cytology, and rebiopsy following induction BCG. Specifically, in 6 cases, the results of patient’s cytology and office cystoscopy 6 to 8 weeks following BCG induction were completely normal/negative. In the remaining 14 R, a repeat biopsy was performed after induction BCG as per the protocol of the physician. In all cases, the findings of cytology were negative as well. Patients with any history of treatment with immunosuppressive drugs or other potential confounders were excluded. A total of 38 patients were identified for this analysis and divided into 2 groups: Group 1 included 20 R and Group 2 included 18 NR. Patient demographics were similar among the 2 groups and are presented in Table 1.
Table 1.
Demographics of patients with Tis bladder cancer: BCG nonresponders (BCG-NR) and BCG responders (BCG-R)
| BCG nonresponders (BCG-NR) (n = 18) | BCG responders (BCG-R) (n = 20) | Statistical (P) | |||
|---|---|---|---|---|---|
| Age (y) | 72±3.17 | 71±2.23 | 0.357 | ||
| Mean±SEM | |||||
| BMI (kg/m2) | 27±1.10 | 27±0.15 | 0.169 | ||
| Mean±SEM | |||||
| ASA class | Number of patients | Percent of patients | Number of patients | Percent of patients | |
| 1 | 0 | 0 | 0 | 0 | 0.740 |
| 2 | 10 | 55 | 13 | 65 | |
| 3 | 8 | 45 | 7 | 35 | |
| 4 | 0 | 0 | 0 | 0 | |
| Gender | 0.117 | ||||
| Female | 6 | 33 | 2 | 10 | |
| Male | 12 | 67 | 18 | 90 | |
BMI = body mass index; SEM, standard error of mean.
2.2. Histopathologic and immunohistochemical staining of bladder tissue sections
Tissue blocks were procured on the identified patients, and 4 recuts were performed for the individual stains. The original tissue biopsies were cold cup biopsies or transurethral resection chips of the bladder. H&E staining of slides was performed by the Mayo Clinic Arizona clinical histology unit. Immunohistochemical analysis was performed using an eosinophil-specific monoclonal antibody (EPX-mAb) as previously described [16]. Additional serial sections were stained by immunohistochemistry (Dako Cytomation; Carpinteria, CA) with monoclonal antibodies specific for either the Th2-associated transcription factor GATA-3 ([AF2605] R&D Systems; Minneapolis, MN) or the Th1-associated transcription factor T-bet ([H-210] Santa Cruz Biotechnology Inc; Santa Cruz, CA).
2.3. The histologic scoring of slides and the development of numerical algorithms
Immunohistochemical staining for Th2-associated immune metrics unique to eosinophils and T cells was identified and then subsequently integrated into numerical algorithms:
Eosinophil infiltration (Emax): The extent of eosinophil infiltration in EPX-mAb–stained bladder tumor biopsies was quantified as the maximal focus of eosinophil infiltration per 400×high-power field (hpf, 0.29 mm2 field of view) from an average of 5 fields (Emax). Numerical values were assigned to each level of tumor eosinophil infiltration based on the normal distribution displayed by the data and are listed in Table 2 and IHC staining is shown in Fig. 1.
Eosinophil degranulation (Edgn): EPX-mAb staining was used to identify (400×hpf) the maximum level of eosinophil degranulation in a given biopsy. Numerical values were assigned to each degranulation level based on the normal distribution of the data and are listed in Table 3. The degranulation levels by IHC are demonstrated in Fig. 2. For final analysis and algorithms, the 3 levels of degranulation assigned to biopsies were 0, 1 (a or b), or 2.
Th2-polarized (GATA-3+)/Th1-polarized (T-bet+) lymphocyte ratio (G/T): Surveys at 160×(1.8 mm2 field of view) were performed on the H&E-stained sections of a given biopsy series to identify the maximum focus of mononuclear cell tumor infiltration. The number of GATA-3+ (Th2-polarized [17]) relative to T-bet+ (Th1-polarized [18]) T lymphocytes at this site (i.e., numerical G/T ratio) was determined as an average of five 400×hpf fields by evaluating the corresponding areas of the biopsies following immunohistochemical staining. IHC staining with GATA-3+ and T-bet+ is demonstrated in Fig. 3.
Eosinophil activity index (EAI) of a given bladder tumor: Sum of numerical scores of maximal eosinophil infiltration (Emax) and degranulation (Edgn).
Th2 Signature Biomarker of a given bladder tumor: Sum of the numerical scores of EAI and G/T (i.e., Emax + Edgn + G/T).
Figure 1.
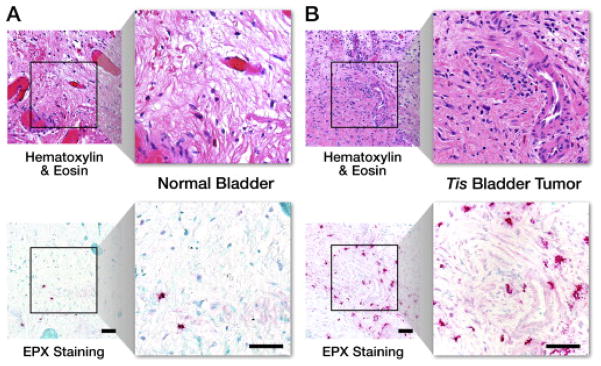
Immunohistochemical analysis of eosinophil infiltration (Emax): hematoxylin & eosin and EPX-mAb staining in (A) normal bladder and (B) Tis bladder cancer. Scale bar = 50 μm.
Table 3.
Eosinophil degranulation (Edgn): Maximal level of eosinophil degranulation. Numerical values assigned to each level of degranulation
| Level of eosinophil degranulation | Description | |
|---|---|---|
| Level 0 | Lack of any evidence for the release of eosinophil peroxidase | |
| Level 1 | 1a | Minimal level of degranulation restricted to the areas immediately surrounding otherwise intact tissue infiltrating eosinophils |
| 1b | Patients displaying eosinophil degranulation that includes evidence of EPX-mAb stained enucleated cytoplasmic fragments | |
| Level 2 | Extensive “painting” of the extracellular matrix of the biopsy, the presence of stained enucleated cytoplasmic fragments, and evidence of cell-free intact secondary granules | |
Figure 2.

Immunohistochemical analysis of eosinophil degranulation (Edgn): representative photomicrographs (400×hpf [0.29 mm2 field of view]) for each level of degranulation as determined by EPX-mAb–based immunohistochemistry (magenta staining cells and extracellular matrix regions). Scale bar = 50 μm.
Figure 3.

Th2-polarized (GATA-3+)/Th1-polarized (T-bet+) lymphocyte ratio (G/T): representative photomicrographs (160×, 1.8 mm2 field of view, insert: 400×hpf [0.29 mm2 field of view]) of the maximum focus of mononuclear cell infiltration of a hematoxylin & eosin–stained section from a (A) normal bladder and (B) Tis bladder tumor are shown in comparison with similarly stained and photographed serial sections from the same subjects following immunohistochemical identification of GATA-3+ and T-bet+ T cells. Scale bar = 50 μm.
To control for interobserver variability, all IHC scoring was performed in duplicate between 2 different outcome-blinded investigators. The scores from the 2 investigators were compared for variability.
2.4. Statistical analysis
Data are expressed as the mean±standard error of the mean. Statistical analysis for comparisons between groups was performed using either the Student t test or Wilcoxon 2-sample test for nonparametric data. Differences between the mean values reported were noted with P values to indicate the level of statistical significance. Intraclass correlation coefficients (ICC) and Kappa statistical correlations (κ) were also determined between investigators reading slides as measures of interrater agreement [19].
3. Results
3.1. Eosinophil infiltration (Emax)
EPX-mAb staining of tumor tissue to evaluate eosinophilic infiltration (Emax), representative of the Th2 response, was significantly different (P = 0.01) between Group 1 and Group 2. Emax was found to be higher in BCG-R (Group 1) as demonstrated in Fig. 4. The mean Emax of R was 1.02±0.17. The mean Emax of NR was 0.5±0.12. In addition, there was little interobserver variation for Emax scoring: ICC = 0.993 (95% confidence interval: 0.988–0.997).
Figure 4.

Level of eosinophilic infiltration in the tumor microenvironment (Th2 arm effector) among BCG responders and nonresponders.
3.2. Eosinophil degranulation (Edgn)
As was found for eosinophil infiltration, Edgn was significantly different (P = 0.04) between the 2 groups (Fig. 5). The mean level of degranulation found in R was 1.1±0.15, whereas the NR had an Edgn of 0.56±0.15. Stratifying patients among the 3 groups (0, 1[a or b], or 2) based on the normal distribution of the data had the added benefit of allowing outcome-blinded investigators to reproducibly stratify patients based on this metric without intraobserver/interobserver variation (Kappa [κ] statistical correlation [95% confidence interval] = 1 [1, 1]).
Figure 5.
Level of eosinophilic degranulation in the tumor microenvironment (Th2 arm effector) among BCG responders and nonresponders.
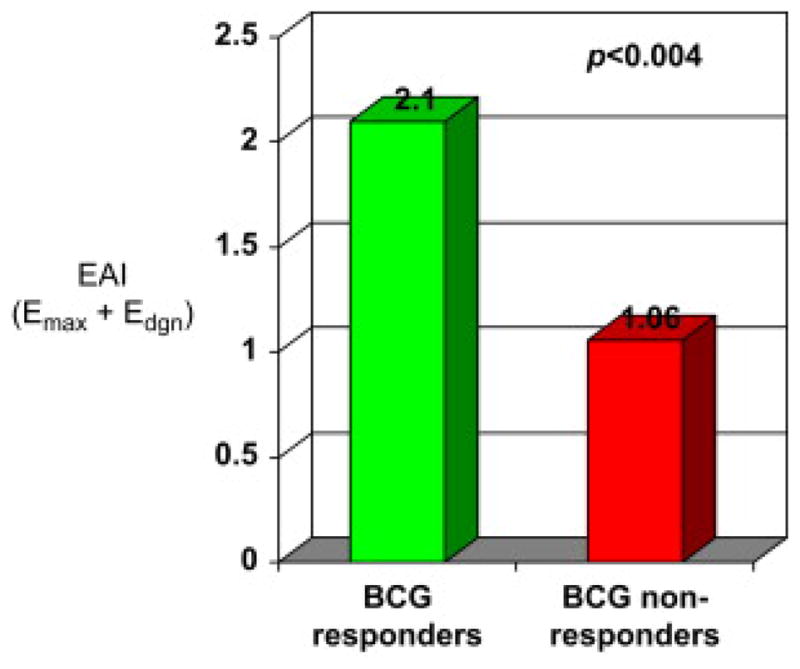
3.3. EAI
EAI (Emax + Edgn) was calculated for each group. The summation of both eosinophil-associated metrics provided an even more robust measure with which to differentiate between R (2.10±0.24) to BCG and NR (1.06±0.24) to BCG (P<0.004). The data are presented in Fig. 6.
Figure 6.

Eosinophil activity index (EAI) scores (Emax + Edgn) among BCG responders and nonresponders
3.4. Th2 vs. Th1 lymphocyte polarization of the tumor immune microenvironment
Evaluation of the Th1- or Th2-polarized lymphocytic infiltrate of the tumor immune microenvironment revealed a significant difference (P<0.001) between BCG-R and BCG-NR. A highly Th2-polarized (GATA-3+) lymphocytic infiltration in the tumor microenvironment (G/T ratio of 4.85±0.94) was observed in BCG-R. In contrast, lymphocytes were found to be Th1 polarized (G/T ratio of 0.98±0.19) in BCG-NR. These results are demonstrated in Fig. 7. Outcome-blinded investigators displayed little intraobserver/interobserver variation of these assessments (ICC = 0.988 [95% confidence interval: 0.978–0.994]).
Figure 7.

Th2 vs. Th1 lymphocyte polarization of the tumor immune microenvironment. (G/T ratio = GATA-3+ lymphocytes/T-bet+ lymphocytes) among BCG responders and nonresponders.
3.5. Th2 signature biomarker
The EAI score for individual patients was combined with the observed differential assessments of tumor-infiltrating lymphocytes (G/T) to yield a diagnostic algorithm of high clinical utility defined as the Th2 Signature Biomarker (EAI + G/T). The mean score for BCG-R was 6.95±0.91 vs. 2.03±0.32 for NR (Fig. 8). These assessments demonstrated that the Th2 Signature Biomarker of pretreatment biopsies provides the highest level of discrimination (P<0.0001).
Figure 8.

Th2 Signature Biomarker (Emax + Edgn + G/T) among BCG responders and nonresponders.
The diagnostic value of evaluating, and then predicting, the responsiveness of patients with bladder cancer to intravesical administration of BCG was demonstrated in the statistical receiver operating characteristic analyses presented in Fig. 9. In particular, Fig. 9A showed that each individual patient Th2 Signature Biomarker (BCG-R patients as controls) provided a diagnostic assay that is highly sensitive (i.e., capable of identifying all patients who were BCG-NR) yet offers a high level of specificity (i.e., few BCG-R patients are misidentified as NR). The importance and value of this diagnostic ability is highlighted in Fig. 9B where the sensitivity and specificity of this assay are concurrently plotted as functions of the bladder tumor Th2 Signature Biomarker score. These analyses showed that a Th2 Signature Biomarker cutoff score of 4.10 was linked with an ability to identify BCG-NR with 100% sensitivity while simultaneously correctly identifying 80% of the BCG-R patients assessed.
Figure 9.

Receiver operating characteristic (ROC) analyses of the Th2 signature biomarker of Tis bladder tumors. (A) ROC plot of the sensitivity displayed by the Th2 signature biomarker to correctly identify patients with Tis bladder cancer who do not respond to BCG immune therapy. (B) The concurrent plotting of the sensitivity and specificity of this diagnostic strategy as a function of Th2 signature biomarker score demonstrates that at a 4.10 cutoff score, 100% of BCG nonresponders are correctly identified while simultaneously correctly identifying 80% of the BCG responders.
4. Discussion
Despite efforts to predict response to BCG therapy, investigators have been unable to, correlate a given biomarker with either patient responsiveness to BCG or patient outcomes [15], [20] and [21]. Our study looked beyond standard clinical and pathologic factors. Our attempt was to see whether there was something within the tumor microenvironment prior to treatment that may give insight as to identifying NR from R. There are other reports in the literature on potential inflammatory markers. Some of these markers include the role of neutrophils [22], macrophages [23], and urinary cytokines [24], [25] and [26]. In most of the studies, patients were treated with BCG and inflammatory markers were analyzed following treatment and not used to identify patients ahead of time. The most important aspect of our study was our ability to identify inflammatory signatures that might exist before treatment and correlate it with response. We were able to identify the NR before treatment based on the fact that they were already polarized to Th1 in the tumor microenvironment. Simply put, adding BCG or any immune modulator intended to incite a Th1 response is unlikely to improve on a tumor microenvironment that is already Th1.
Other markers that are often analyzed include intratumoral cellular markers as well as gene signatures. Investigators have attempted to correlate common tumor markers such as p53 [27] expression and Ki-67 [28] expression with response rates. Gene expression profiling, comparative genomic hybridization, and gene sequencing techniques have been and continue to be used on tumor and normal tissue to identify potential targetable gene signatures. The current clinical usefulness of gene analyses is limited by current cost constraints. A significant advantage of our study is that the algorithmic interpretation of eosinophilic response to tumor and pretreatment immunologic polarization can be done with immunohistochemical techniques available to any standard pathology laboratory and less costly than gene sequencing.
Most importantly, our assessments demonstrated a direct correlation between the level of Th2 polarization and a patient’s response to BCG therapy. Specifically, our assessments of these initial patient biopsies showed that tumor-infiltrating, Th2-polarized GATA-3+ (G) vs. Th1-polarized T-bet+ (T) lymphocytes (G/T ratio) significantly correlated with subsequent post-BCG treatment outcomes. In addition, an independent, yet similarly significant, correlation was revealed using a unique eosinophil-specific antibody assessing another Th2 metric, the extent of eosinophil infiltration and degranulation occurring in bladder cancer biopsies (EAI). Furthermore, the Th2 signature biomarker is an algorithm that incorporates both diagnostic metrics of Th2 polarization (G/T + EAI). It provided a sensitive and specific assay with significant prognostic value regarding the efficacy of BCG.
The limitations of this study are primarily associated with the inherent limitations of its retrospective design. Selection of the 2 groups of patients with outcomes already known and restriction of the T stage to Tis patients limits the ability to generalize conclusions to all potential candidates for BCG treatment (high-grade Ta and T1). The patient groups are small and our findings need to be further validated with a larger cohort as well as a heterogeneous group of T stages. Nevertheless, we feel the small numbers of our sample is compensated for by the statistical strength of the findings. Furthermore, the findings simply “make sense.” If the goal of intravesical BCG immunotherapy is to cause a Th1 response and a tumor has managed to escape the Th1 immunologic environment already, then trying to incite a Th1 immune response is unlikely to work. However, if a tumor exists in a Th2 environment and has yet to be exposed to a Th1 inflammatory response, then a treatment inciting such a response should be beneficial.
Developing a reproducible and reliable marker that accurately predicts response to BCG would be a significant advance in the treatment of NMIBC. This is particularly true considering the recent issues many of us had in 2012 with availability of BCG. Because of the shortage of BCG, many urologists had to withhold treatment with BCG and there was a concern that the rates of cystectomy would rise for high-grade NMIBC. In fact, the U.S. Food and Drug Administration, as well as the American Urological Association, published statements and policy briefs regarding the management of the BCG shortage in 2012 [29] and [30]. Clearly, there is a need for such a tool to identify the right patients who should be directed to bladder-sparing treatments with BCG, alternative intravesical therapies, or more definitive treatment with radical cystectomy.
5. Conclusions
The Th1 vs. Th2 polarization of bladder tumor immune microenvironment prior to treatment with BCG represents a prognostic metric of response to therapy. If a patient has a preexisting Th1 immunologic response within the tumor, there is no value in using a therapy intended to create a Th1 immunologic response. An algorithm integrating 3 IHC methods provided a sensitive and specific technique that may become a useful tool for pathologists and urologists to predict response to BCG in patients with carcinoma in situ of the bladder.
Table 2.
Eosinophil infiltration (Emax): Maximal focus of eosinophil infiltration per 400×high-power field (hpf, 0.29 mm2 field of view) from an average of 5 fields. Numerical values assigned to each level of tumor eosinophil infiltration
| Level of eosinophil infiltration | Number of maximal focus of eosinophil infiltration |
|---|---|
| Level 0 | <6 |
| Level 1 | 6–60 |
| Level 2 | 61–120 |
| Level 3 | >120 |
Acknowledgments
This work was supported by Mayo Foundation and a grant from National Institutes of Health (JJL) R01 CA112442.
References
- 1.Fleshner NE, Herr HW, Stewart AK, Murphy GP, Mettlin C, Menck HR. The National Cancer Data Base report on bladder carcinoma. The American College of Surgeons Commission on Cancer and the American Cancer Society. Cancer. 1996;78:1505–13. doi: 10.1002/(sici)1097-0142(19961001)78:7<1505::aid-cncr19>3.0.co;2-3. [DOI] [PubMed] [Google Scholar]
- 2.Sylvester RJ, van der MA, Lamm DL. Intravesical bacillus Calmette-Guerin reduces the risk of progression in patients with superficial bladder cancer: a meta-analysis of the published results of randomized clinical trials. J Urol. 2002;168:1964–70. doi: 10.1016/S0022-5347(05)64273-5. [DOI] [PubMed] [Google Scholar]
- 3.Fast stats: An interactive tool for access to SEER czncer statistics. [Accessed on 3-15-2011];Surveillance Research Program national Cancer institute. Faststats. http://seer.cancer.gov/faststats.
- 4.Sylvester RJ, van der Meijden A, Witjes JA, Jakse G, Nonomura N, Cheng C, Torres A, Watson R, Kurth KH. High-grade Ta urothelial carcinoma and carcinoma in situ of the bladder. Urology. 2005;66:90–107. doi: 10.1016/j.urology.2005.06.135. [DOI] [PubMed] [Google Scholar]
- 5.Babjuk M, Oosterlinck W, Sylvester R, Kaasinen E, Bohle A, Palou-Redorta J, Roupret M. EAU guidelines on non-muscle-invasive urothelial carcinoma of the bladder, the 2011 update. Eur Urol. 2011;59:997–1008. doi: 10.1016/j.eururo.2011.03.017. [DOI] [PubMed] [Google Scholar]
- 6.Herr HW, Morales A. History of bacillus Calmette-Guerin and bladder cancer: an immunotherapy success story. J Urol. 2008;179:53–6. doi: 10.1016/j.juro.2007.08.122. [DOI] [PubMed] [Google Scholar]
- 7.Griffiths TR, Charlton M, Neal DE, Powell PH. Treatment of carcinoma in situ with intravesical bacillus Calmette-Guerin without maintenance. J Urol. 2002;167:2408–12. [PubMed] [Google Scholar]
- 8.Nadler RB, Catalona WJ, Hudson MA, Ratliff TL. Durability of the tumor-free response for intravesical bacillus Calmette-Guerin therapy. J Urol. 1994;152:367–73. doi: 10.1016/s0022-5347(17)32741-6. [DOI] [PubMed] [Google Scholar]
- 9.Witjes JA. Management of BCG failures in superficial bladder cancer: a review. Eur Urol. 2006;49:790–797. doi: 10.1016/j.eururo.2006.01.017. [DOI] [PubMed] [Google Scholar]
- 10.Barmoshe S, Zlotta AR. Prognosis of T1G3 tumors: Clinical factors. Eur Urol Suppl. 2004;3:73–78. [Google Scholar]
- 11.Ponticiello A, Perna F, Maione S, Stradolini M, Testa G, Terrazzano G, Ruggiero G, Malerba M, Sanduzzi A. Analysis of local T lymphocyte subsets upon stimulation with intravesical BCG: a model to study tuberculosis immunity. Respir Med. 2004;98:509–514. doi: 10.1016/j.rmed.2003.12.003. [DOI] [PubMed] [Google Scholar]
- 12.Power CA, Wei G, Bretscher PA. Mycobacterial dose defines the Th1/Th2 nature of the immune response independently of whether immunization is administered by the intravenous, subcutaneous, or intradermal route. Infect Immun. 1998;66:5743–5750. doi: 10.1128/iai.66.12.5743-5750.1998. [DOI] [PMC free article] [PubMed] [Google Scholar]
- 13.Lee JJ, Jacobsen EA, McGarry MP, Schleimer RP, Lee NA. Eosinophils in Health and Disease: The LIAR Hypothesis. Clin Exp Allergy. 2010;40:563–575. doi: 10.1111/j.1365-2222.2010.03484.x. [DOI] [PMC free article] [PubMed] [Google Scholar]
- 14.Lee JJ, Rosenberg HF, editors. Eosinophils in Health and Disease. Elsevier; Waltham, MA: 2012. [Google Scholar]
- 15.Zuiverloon TCM, Nieuweboer AJM, Vékony H, Kirkels WJ, Bangma CH, Zwarthoff EC. Markers Predicting Response to Bacillus Calmette-Guérin Immunotherapy in High-Risk Bladder Cancer Patients: A Systematic Review. Eur Urol. 2011 doi: 10.1016/j.eururo.2011.09.026. Published online ahead of print on October 6, 2011. [DOI] [PubMed] [Google Scholar]
- 16.Protheroe CA, Woodruff SA, DePetris G, Mukkada V, Ochkur SI, Janarthanan S, Lewis JC, Pasha S, Lunsford T, Harris L, Sharma VK, McGarry MP, Lee NA, Furuta GT, Lee JJ. A novel histological scoring system to evaluate mucosal biopsies from patients with eosinophilic esophagitis. Clinical Gastroenterology and Hepatology. 2009;7:749–755. e711. doi: 10.1016/j.cgh.2009.03.022. [DOI] [PMC free article] [PubMed] [Google Scholar]
- 17.Ranganath S, Murphy KM. Structure and specificity of GATA proteins in Th2 development. Mol Cell Biol. 2001;21:2716–2725. doi: 10.1128/MCB.21.8.2716-2725.2001. [DOI] [PMC free article] [PubMed] [Google Scholar]
- 18.Szabo SJ, Kim ST, Costa GL, Zhang X, Fathman CG, Glimcher LH. A novel transcription factor, T-bet, directs Th1 lineage commitment. Cell. 2000;100:655–669. doi: 10.1016/s0092-8674(00)80702-3. [DOI] [PubMed] [Google Scholar]
- 19.Shrout PE, Fleiss JL. Intraclass correlations: uses in assessing rater reliability. Psychol Bull. 1979;86:420–428. doi: 10.1037//0033-2909.86.2.420. [DOI] [PubMed] [Google Scholar]
- 20.Fernandez-Gomez J, Madero R, Solsona E, Unda M, Martinez-Pineiro L, Gonzalez M, Portillo J, Ojea A, Pertusa C, Rodriguez-Molina J, Camacho JE, Rabadan M, Astobieta A, Montesinos M, Isorna S, Muntanola P, Gimeno A, Blas M, Martinez-Pineiro JA. Predicting nonmuscle invasive bladder cancer recurrence and progression in patients treated with bacillus Calmette-Guerin: the CUETO scoring model. J Urol. 2009;182:2195–2203. doi: 10.1016/j.juro.2009.07.016. [DOI] [PubMed] [Google Scholar]
- 21.Lima L, Dinis-Ribeiro M, Longatto-Filho A, Santos L. Predictive biomarkers of bacillus calmette-guerin immunotherapy response in bladder cancer: where are we now? Adv Urol. 2012;2012:232609. doi: 10.1155/2012/232609. [DOI] [PMC free article] [PubMed] [Google Scholar]
- 22.Simons MP, O’Donnell MA, Griffith TS. Role of neutrophils in BCG immunotherapy for bladder cancer. Urol Oncol. 2008;26:341–345. doi: 10.1016/j.urolonc.2007.11.031. [DOI] [PMC free article] [PubMed] [Google Scholar]
- 23.Takayama H, Nishimura K, Tsujimura A, Nakai Y, Nakayama M, Aozasa K, Okuyama A, Nonomura N. Increased infiltration of tumor associated macrophages is associated with poor prognosis of bladder carcinoma in situ after intravesical bacillus Calmette-Guerin instillation. J Urol. 2009;181:1894–1900. doi: 10.1016/j.juro.2008.11.090. [DOI] [PubMed] [Google Scholar]
- 24.Videira PA, Calais FM, Correia M, Ligeiro D, Crespo HJ, Calais F, Trindade H. Efficacy of bacille Calmette-Guerin immunotherapy predicted by expression of antigen-presenting molecules and chemokines. Urology. 2009;74:944–950. doi: 10.1016/j.urology.2009.02.053. [DOI] [PubMed] [Google Scholar]
- 25.Saint F, Patard JJ, Maille P, Soyeux P, Hoznek A, Salomon L, Abbou CC, Chopin DK. Prognostic value of a T helper 1 urinary cytokine response after intravesical bacillus Calmette-Guerin treatment for superficial bladder cancer. J Urol. 2002;167:364–367. [PubMed] [Google Scholar]
- 26.Watanabe E, Matsuyama H, Matsuda K, Ohmi C, Tei Y, Yoshihiro S, Ohmoto Y, Naito K. Urinary interleukin-2 may predict clinical outcome of intravesical bacillus Calmette-Guerin immunotherapy for carcinoma in situ of the bladder. Cancer Immunol Immunother. 2003;52:481–486. doi: 10.1007/s00262-003-0384-9. [DOI] [PMC free article] [PubMed] [Google Scholar]
- 27.Peyromaure M, Weibing S, Sebe P, Verpillat P, Toublanc M, Dauge MC, Boccon-Gibod L, Ravery V. Prognostic value of p53 overexpression in T1G3 bladder tumors treated with bacillus Calmette-Guerin therapy. Urology. 2002;59:409–413. doi: 10.1016/s0090-4295(01)01551-5. [DOI] [PubMed] [Google Scholar]
- 28.Zlotta AR, Noel JC, Fayt I, Drowart A, Van Vooren JP, Huygen K, Simon J, Schulman CC. Correlation and prognostic significance of p53, p21WAF1/CIP1 and Ki-67 expression in patients with superficial bladder tumors treated with bacillus Calmette-Guerin intravesical therapy. J Urol. 1999;161:792–798. [PubMed] [Google Scholar]
- 29.<Available at: http://www.fda.gov/BiologicsBloodVaccines/CellularGeneTherapy/Products/ApprovedProducts/ucm310645.htm>
- 30.<Available at: http://www.auanet.ort/forms/hpbrief/view.cfm?=1160&a2764>