

Background: TRPM2 channels are present in the heart, but their function is unknown.
Results: Genetic ablation of TRPM2 results in cardiac mitochondrial dysfunction, enhanced ROS production, and exacerbated cardiac ischemic injury.
Conclusion: TRPM2 channels preserve cardiac mitochondrial bioenergetics and protect cardiac myocytes from ischemic injury.
Significance: TRPM2 is a rational target for treatment of ischemic heart disease.
Keywords: Calcium Channels, Cardiovascular Disease, Electrophysiology, Mitochondria, TRP Channels, Cardiac Ischemia, Global Proteomics Analysis, Mitochondrial Bioenergetics
Abstract
Cardiac TRPM2 channels were activated by intracellular adenosine diphosphate-ribose and blocked by flufenamic acid. In adult cardiac myocytes the ratio of GCa to GNa of TRPM2 channels was 0.56 ± 0.02. To explore the cellular mechanisms by which TRPM2 channels protect against cardiac ischemia/reperfusion (I/R) injury, we analyzed proteomes from WT and TRPM2 KO hearts subjected to I/R. The canonical pathways that exhibited the largest difference between WT-I/R and KO-I/R hearts were mitochondrial dysfunction and the tricarboxylic acid cycle. Complexes I, III, and IV were down-regulated, whereas complexes II and V were up-regulated in KO-I/R compared with WT-I/R hearts. Western blots confirmed reduced expression of the Complex I subunit and other mitochondria-associated proteins in KO-I/R hearts. Bioenergetic analyses revealed that KO myocytes had a lower mitochondrial membrane potential, mitochondrial Ca2+ uptake, ATP levels, and O2 consumption but higher mitochondrial superoxide levels. Additionally, mitochondrial Ca2+ uniporter (MCU) currents were lower in KO myocytes, indicating reduced mitochondrial Ca2+ uptake was likely due to both lower ψm and MCU activity. Similar to isolated myocytes, O2 consumption and ATP levels were also reduced in KO hearts. Under a simulated I/R model, aberrant mitochondrial bioenergetics was exacerbated in KO myocytes. Reactive oxygen species levels were also significantly higher in KO-I/R compared with WT-I/R heart slices, consistent with mitochondrial dysfunction in KO-I/R hearts. We conclude that TRPM2 channels protect the heart from I/R injury by ameliorating mitochondrial dysfunction and reducing reactive oxygen species levels.
Introduction
Transient receptor potential channels are voltage-independent, monovalent and divalent cation-permeable ion channels with six transmembrane domains (1, 2). To form a functional channel, TRP3 proteins assemble into either homo- or heterotetramers (3, 4). The mammalian TRP superfamily consists of 28 members grouped into 6 subfamilies (1, 2), of which TRPM is one subfamily. TRPM subfamily contains eight mammalian members (TRPM1-TRPM8) (2), of which TRPM2 (5), -M4, -M5, and -M7 (6) have been demonstrated by immunostaining, RT-PCR, and biochemical studies to be expressed in the heart. Of these, TRPM2 has a role in the regulation of glucose uptake and insulin signaling in the heart (7), whereas TRPM4 is associated with conduction abnormalities and cardiac arrhythmias (8, 9). There are significant structural and functional differences between TRPM2 and TRPM4. Unlike TRPM2, TRPM4 is not expressed in normal adult ventricular myocytes (9), lacks ADPR pyrophosphatase domain (Nudix-like domain) in its C terminus (10), and is permeable to monovalent cations but impermeable to Ca2+ (11). The unitary conductance of TRPM2 (52–80 picosiemens (pS)) is much larger than TRPM4 (25 pS) (2). Phenotypically, compared with their respective WT controls, TRPM4 KO mice have elevated blood pressure (12), prolonged PR and QRS intervals on ECG, and cardiac hypertrophy due to neonatal hyperplasia (9), whereas TRPM2 KO mice have normal LV mass and ejection fraction (5) as well as normal blood pressure and ECG under basal conditions.
We previously demonstrated that TRPM2 channels are expressed in the sarcolemma and transverse tubules in adult mouse ventricular myocytes (5). When stimulated with H2O2 in physiological [Ca2+]o, increases in [Ca2+]i are much higher in WT compared with TRPM2 KO myocytes. A H2O2-induced [Ca2+]i increase in WT myocytes is dependent on extracellular Ca2+ and inhibited by clotrimazole. These observations provide support that TRPM2 channels are functional in adult cardiac myocytes. In addition, in contrast to the classical paradigm in which enhanced Ca2+ signaling with TRPM2 activation in pathological states contributes to cell injury and death (13), it was recently revealed that TRPM2 channels protect hearts from I/R injury (5). Protection is associated with reduced I/R-induced oxidative stress, but the cellular mechanisms by which protection is achieved remain to be elucidated. The present study was undertaken to (i) measure TRPM2 currents and evaluate GCa:GNa ratio in adult cardiac myocytes, (ii) analyze proteomes of WT-I/R and TRPM2 KO-I/R hearts to identify major cellular mechanisms that afford protection from I/R injury, (iii) perform Western blots to validate proteomics results, (iv) evaluate whether mitochondrial function is more severely depressed in TRPM2 KO-H/R compared with WT-H/R myocytes, and (v) measure ROS in TRPM2 KO-I/R and WT-I/R heart slices in situ. We found that loss of TRPM2 in cardiac myocytes perturbed mitochondrial proteomes and mitochondrial function. Additionally, TRPM2 KO hearts subjected to I/R exhibited exacerbation of mitochondrial malfunction.
EXPERIMENTAL PROCEDURES
Generation of Global TRPM2-KO Mouse
Global TRPM2 KO mice were generated as described previously (5). For brevity, throughout the manuscript TRPM2 knock-out is abbreviated to KO whether applied to mice, hearts, myocytes, or LV homogenates. Homozygous adult littermates ∼8–10 weeks old were used in this study. Mice were housed and fed on a 12:12-h light-dark cycle in either the Temple University or the Pennsylvania State University animal facility supervised by full-time veterinarian staff members. Standard care was provided to all mice used for experiments. All protocols and procedures applied to the mice in this study were approved and supervised by the Institutional Animal Care and Use Committees at Temple University and the Pennsylvania State University.
Isolation of Adult Murine Ventricular Myocytes
Cardiac myocytes were isolated from the LV free wall and septum of WT and KO mice according to the protocol of Zhou et al. (14) and modified by us (15–20). Myocytes were either seeded onto laminin-coated coverslips or left in suspension and used within 2–8 h of isolation.
Measurement of TRPM2 Current and Estimation of GCa/GNa in Adult Ventricular Myocytes
TRPM2 currents were measured in isolated LV myocytes (30 °C) with whole cell patch clamp (15–20). Fire-polished pipettes (tip diameter 4–6 μm) with resistances of 0.8–1.4 megaohms when filled with pipette solutions were used. Pipette solution contained 110 mm CsCl, 20 mm triethylammonium chloride, 10 mm HEPES, 10 mm EGTA, and 5 mm MgATP, pH 7.2, and bathing solution contained 127 mm NaCl, 5.4 mm CsCl, 2 mm CaCl2, 1.3 mm MgSO4, 4 mm 4-aminopyridine, 10 mm HEPES, 10 mm Na-HEPES, 15 mm glucose, and 0.001 mm verapamil, pH 7.4. Our solutions are designed to minimize L-type Ca2+ current, Na+-K+-ATPase current, Na+/Ca2+ exchange current, and potassium currents. Freshly isolated mouse LV myocytes were held at −70 mV. To inactivate fast inward Na+ current, myocytes were held at −40 mV before application of voltage ramp (+100 to −100 mV; 500 mV/s). In some experiments, ADPR (300 μm) was included in pipette solutions to activate TRPM2 channels (21). In other experiments, after full activation of TRPM2 channels by ADPR, flufenamic acid (0.5 mm) was added to the extracellular medium to inhibit TRPM2 currents (22).
To estimate GCa/GNa, WT myocytes were voltage-clamped at −80 mV. Pipette solution was identical to that used above and contained ADPR. Extracellular solution contained 140 mm NaCl, 10 mm HEPES, and 15 mm glucose, pH 7.4. After break-in, steady-state inward Na+ currents were obtained at an Em of −80, −90, and −100 mV. Extracellular solution was then changed to one containing 110 mm CaCl2, 10 mm HEPES, and 15 mm glucose, pH 7.4. Steady-state inward Ca2+ currents were obtained at an Em of −80, −90, and −100 mV from the same myocyte. By Ohm's law, Em − Erev = I/G. Taking derivatives, ΔI/ΔEm = G. GCa/GNa is given by the ratio of the slopes of I versus Em plots with Ca2+ or Na+ as the permeant ion.
I/R Surgery in Mice
I/R surgery was performed as previously described (23, 24). Briefly, male WT and KO mice (8–10 weeks) were anesthetized with 2% isoflurane, and the heart was exposed through a left thoracotomy at the fifth intercostal space. The slipknot was tied around the left anterior descending coronary artery 2–3 mm from its origin, and the heart was immediately returned to the chest cavity followed by evacuation of pneumothorax and closure of muscle and skin layers. The slipknot was released after 30 min of ischemia to allow reperfusion. Sham-operated animals were subjected to the same surgical procedure except that the slipknot was not tied. Animals recovered from anesthesia within 5 min after the completion of surgery and received ibuprofen (10 mg/50 ml drinking water) for 48 h as post-surgery analgesia. Studies on survivors were performed on day 3 post-surgery.
Heart Proteomics Analysis
Label-free proteomics analysis was performed using GeLC-MS/MS technology. To enhance the dynamic range of the identified proteins in this discovery phase study, the pooled LV samples from WT-I/R (n = 4) and KO-I/R (n = 4) were fractionated into cytoplasmic, nuclear, and organelle fractions. Extracted proteins in radioimmunoprecipitation assay buffer were processed for GeLC-MS/MS analysis as previously described (25). Briefly, nanoelectrospray ionization tandem MS was performed using a Brukers HCT Ultra ion trap mass spectrometer. Nanoelectrospray ionization was delivered using a distal-coating spray Silica tip (internal diameter (ID) 20 μm, tip inner ID 10 μm, New Objective) at a spray voltage of −1300 V. Automatic switching between MS and MS/MS modes was used. MS/MS fragmentation was performed on the two most abundant ions on each spectrum using collision-induced dissociation with active exclusion (excluded after 2 spectra and released after 2 min). The complete system was fully controlled by HyStar 3.1 software.
Mass spectra processing was performed using Bruker Daltonics esquire 6.1 DataAnalysis (Version 3.4). The generated de-isotoped peak list was submitted to an in-house Mascot server 2.2.07 for searching against the Mus musculus Swiss-Prot database (Version 2013_01; 538,849 sequences, 191,337,357 residues). Mascot search parameters were set as follows: enzyme, trypsin with maximal 2 missed cleavages; fixed modification, cysteine carboxymethylation; variable modification, methionine oxidation; 0.45-Da mass tolerance for precursor peptide ions; 0.6 Da for MS/MS fragment ions. All peptides matches were filtered using an ion score cutoff of 30. In each MS/MS spectrum a total of at least 4 b- and y-ions were observed.
Label free quantitation was performed in Mascot Distiller using an average protein ratio, minimum 1 peptide with unique sequence, and 0.05 of significant threshold, and the results were analyzed with MS Data Miner (26). Label-free quantified proteins with higher than a 2-fold increase were selected and clustered by biological functions.
To identify the biological networks of differentially expressed proteins, we performed a standard network analysis using Ingenuity Pathways Analysis software as previously described (27). To build the network, the Ingenuity Pathways Analysis software queries the Ingenuity knowledge database for physical and functional interactions between the submitted proteins and all other proteins in the database. Ingenuity Pathways Analysis was optimized to include up to 35 proteins in a network. Differentially expressed proteins were input from an Excel file containing the protein accession numbers.
Immunoblotting
Pieces of mouse heart apices were homogenized (hand-held homogenizer) in lysis buffer containing 50 mm Tris, 150 mm NaCl, 1 mm EDTA, 10 mm NaF, and 1% Triton X-100, pH 7.4, and supplemented with Complete Protease Inhibitors (Roche Diagnostics) and Phosphatase Inhibitors (Sigma). Homogenates were centrifuged at 10,000 × g for 10 min, and the supernatants were subjected to 12% SDS-PAGE. Proteins were transferred to Hybond-C-Extra (Amersham Biosciences). Blots were blocked for 1 h with 5% milk and probed overnight at 4 °C with anti-NDUFA4L2 (1:1,000, Abcam), anti-BNIP3 (1:750, Abcam), anti-MTFP1 (1:200, Santa Cruz), or anti-calsequestrin (1:15,000, Fitzgerald). Blots were washed and probed with anti-rabbit horseradish peroxidase-conjugated antibody (1:2,000, Amersham Biosciences). Enhanced chemiluminescence was used for signal detection. Intensity of the bands was quantitated with densitometry and normalized to that of calsequestrin (loading control).
In Situ Measurement of ROS in Heart Slices
Hearts from male WT and KO mice were subjected to 30 min of ischemia followed by 30 min of reperfusion or underwent sham operation. LV cross-sections (2 mm) from freshly isolated mouse hearts were equilibrated in Krebs-Henseleit bicarbonate buffer (30 min; 37 °C), stained with DHE (30 μm), and incubated in the dark (30 min) with gentle rotation (28). DHE-stained LV sections were imaged with a Carl Zeiss 710 multiphoton confocal microscope (10× objective; 561-nm excitation). ZEN software was used to collect and analyze confocal images of each section and generate 2.5-dimensional heatmap plots of mean DHE intensity.
Measurement of Mitochondrial Membrane Potential (ΔΨm) and Mitochondrial Ca2+ Uptake
To simulate I/R in vitro, LV myocytes isolated from WT and KO hearts were exposed to either 21% O2, 5% CO2 (normoxia) or 1%O2, 5% CO2 (hypoxia) for 2 h followed by 30 min of reoxygenation (5). Myocytes were incubated in Krebs-Henseleit bicarbonate buffer containing 5 mm pyruvate as substrate (29). After gentle centrifugation, cardiac myocytes were transferred to an intracellular-like medium containing 120 mm KCl, 10 mm NaCl, 1 mm KH2PO4, 20 mm HEPES-Tris, 2 μg/ml thapsigargin, 80 μg/ml digitonin, pH 7.2, and protease inhibitors (EDTA-free complete tablets, Roche Applied Science). Permeabilized myocytes were supplemented with succinate (10 mm) and gently stirred. Fura-FF (0.5 μm) was added at 0 s, and JC-1 (800 nm; both Molecular Probes) was added at 20 s to measure extra-mitochondrial Ca2+ and Δψm, respectively. Fluorescence signals were monitored in a temperature-controlled (37 °C) multiwavelength-excitation and dual wavelength-emission spectrofluorometer (Delta RAM, Photon Technology Int.) using 490-nm excitation (ex)/535-nm emission (em) for the monomer, 570-nm ex/595-nm em for the J-aggregate of JC-1, and 340- and 380-nm ex/510-nm em for Fura-FF. The ratiometric dye Fura-FF was calibrated as previously described (30). At 450 s, 10 μm Ca2+ pulse was added, and Δψm and extra-mitochondrial Ca2+ were monitored simultaneously. Δψm was calculated as the ratio of the fluorescence of the JC-1 oligomeric to monomeric forms. Cytosolic Ca2+ clearance rate was taken to represent mitochondrial Ca2+ uptake.
Measurement of Mitochondrial O2 Consumption and ATP Levels
WT and KO myocytes were subjected to 2 h of hypoxia followed by 30 min of reoxygenation (H/R) or normoxia. Oxygen consumption rate in intact adult LV myocytes was measured at 37 °C in an XF96 extracellular flux analyzer (Seahorse Bioscience). Myocyte suspensions were sequentially exposed to oligomycin, carbonyl cyanide 4-(trifluoromethoxy)phenylhydrazone, and rotenone plus antimycin A using the XF Cell Mito Stress kit (Seahorse Bioscience) according to the manufacturer's instructions. Preliminary experiments were performed in untreated adult cardiac myocytes to select optimal seeding density (104 cells/well) and compound concentrations, according to manufacturer's instructions. To measure ATP levels, isolated myocytes from WT and KO mice were lysed, and ATP (luminescence) levels were measured using a CellTiter-Glo luminescent cell viability assay kit as described previously (31).
To assess the oxygen consumption rate (OCR) in hearts from WT and KO mice, heart slices were generated and suspended in XF media. OCR in heart slices were measured at 37 °C in an XF96 extracellular flux analyzer. The remaining heart slices were homogenized, and ATP levels were measured as described earlier (31).
Measurement of Mitochondrial Ca2+ Uniporter (MCU) Current (IMCU)
Mitoplast patch clamp recordings were conducted at 30 °C as previously described (32, 33). IMCU was recorded using a computer controlled Axon200B patch clamp amplifier with a Digidata 1320A acquisition board (pClamp 10.0 software; Axon Instruments). Mitoplasts were bathed in solution containing 5 mm CaCl2 ± 0.3 mm inorganic phosphate, 150 mm sodium gluconate, 5.4 mm KCl, 10 mm HEPES, pH 7.2. The pipette solution contained 150 mm sodium gluconate, 5 mm NaCl, 135 mm sucrose, 10 mm HEPES, and 1.5 mm EGTA, pH 7.2. After formation of gigaohm seals (pipette resistance 20–35 megaohms), mitoplasts were ruptured with a 200-400-mV pulse varying from 2 to 6 ms duration. Mitoplast capacitance was measured (2.2–3.8 picofarads). After capacitance compensation, mitoplasts were held at 0 mV, and IMCU was elicited with a voltage ramp (from −160 to +80 mV, 120 mV/s).
Confocal Mitochondrial ROS and ψm Measurement
Freshly isolated ventricular cardiomyocytes were loaded with the mitochondrial ψm indicator rhodamine 123 (Invitrogen; 13 μm) and mitochondrial superoxide-sensitive fluorophore MitoSOX Red (Invitrogen; 22 μm) in the extracellular media containing 2% BSA, 0.06% pluronic acid, and 20 μm sulfinpyrazone at 37 °C for 30 min. Cells were then washed, resuspended in the extracellular media containing 0.25% BSA, and imaged using a Carl Zeiss Meta 510 confocal microscope with a 40× oil objective with 1.7× digital zoom at 488 and 561 nm for Rhodamine 123 and MitoSOX Red, respectively (34, 35).
Statistics
All results are expressed as the means ± S.E. For analysis of TRPM2 current as a function of group and voltage, two-way analysis of variance was used. For analysis of protein expression levels, ROS levels, Δψm, mitochondrial Ca2+ uptake, and O2 consumption, one-way analysis of variance was used. A commercially available software package (JMP version 7; SAS Institute, Cary, NC) was used. In all analyses, p < 0.05 was taken to be statistically significant.
RESULTS
TRPM2 Currents in Cardiac Myocytes
In the absence of ADPR and under our experimental conditions, currents measured in myocytes isolated from either WT or KO hearts were negligible (Fig. 1). Intracellular ADPR elicited a large inward and outward current in WT but not in KO myocytes. ADPR-activated currents displayed the characteristic TRPM2 linear I-V relationship with Erev close to 0 mV (10, 36). Extracellular flufenamic acid (0.5 mm) (22) abolished the current elicited by ADPR in WT myocytes (n = 3; data not shown). These characteristics indicate that the ADPR-activated current was mediated by TRPM2.
FIGURE 1.
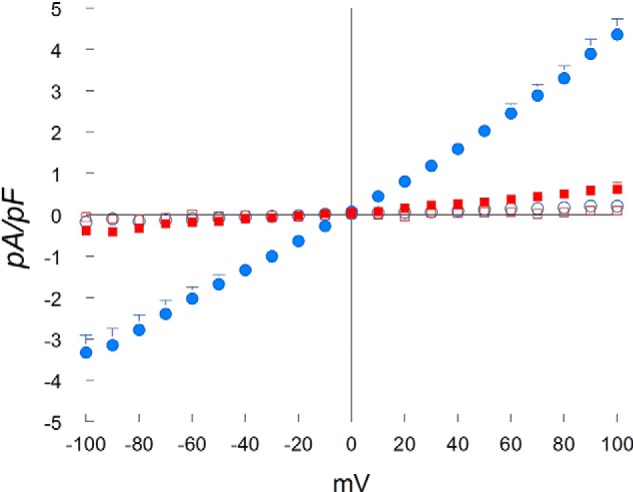
ADPR activates cationic currents in WT but not TRPM2 KO myocytes. LV myocytes were isolated from WT and KO hearts. The standard patch clamp whole cell configuration was used. Composition of pipette and external solutions and voltage-ramp protocols are given under “Experimental Procedures”. I-V relationships of cationic current (means ± S.E.) from WT + ADPR (300 μm) (●; n = 5), WT (○; n = 4), KO + ADPR (■; n = 7) and KO (□; n = 3) myocytes are shown. Error bars are not shown if they fell within the boundaries of the symbol. Two-way analysis of variance indicate p < 0.0001 for WT + ADPR versus WT or KO + ADPR or KO myocytes. pF, picofarads.
TRPM2 currents in WT cardiac myocytes did not inactivate (Fig. 2), consistent with the findings in HEK293 cells stably expressing WT TRPM2 (10, 36). Under our experimental conditions, GNa and GCa of TRPM2 channels in cardiac myocytes were 19.07 ± 0.53 (n = 4) and 10.51 ± 0.58 pA/mV (n = 5), respectively (Fig. 2). The ratio of GCa/GNa was 0.56 ± 0.02 in adult cardiac myocytes (n = 4), which compares favorably with PCa/PNa (Ca2+ permeability/Na+ permeability) of 0.80 ± 0.03 determined for WT TRPM2 channels expressed in HEK293 cells (37).
FIGURE 2.
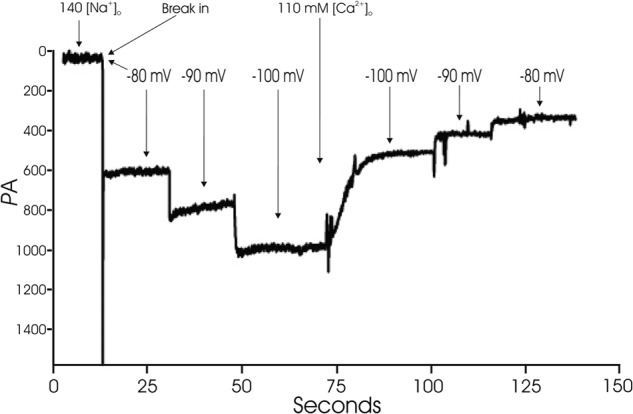
WT TRPM2 currents do not inactivate and estimation of GCa and GNa. WT myocytes were held at −80 mV. ADPR was included in the pipette solution to activate TRPM2 channels. With 140 mm [Na+]o, after break-in, a large inward current that did not inactivate was observed. The current showed a linear increase with increasing hyperpolarization. After media change to a medium containing 110 mm [Ca2+]o, current became smaller and demonstrated a linear decrease with depolarization from −100 to −80 mV. GCa and GNa were estimated from the slope of I-V relationship (“Experimental Procedures”).
Perturbation of Mitochondrial Respiratory Complexes Is More Prominent in TRPM2 KO Myocytes Post-I/R
To explore the cellular mechanisms responsible for the observation that myocardial function in KO hearts is more depressed than WT hearts after I/R (5), we performed global label-free proteomics analysis using GeLC-MS/MS technology. Comparing KO-I/R to WT-I/R hearts, the top 20 differentially expressed proteins are given in Table 1 (see also supplemental Table 1). The canonical pathways that exhibited the largest differences between KO-I/R and WT-I/R hearts are mitochondrial dysfunction and TCA cycle (Fig. 3). Complexes I, III, and IV were down-regulated, whereas Complexes II and V were up-regulated in KO-I/R compared with WT-I/R hearts (Fig. 4).
TABLE 1.
Differentially expressed proteins between KO-I/Rand WT-I/R Hearts
| ID | Symbol | -Fold change | Entrez gene name |
|---|---|---|---|
| Top 20 up-regulated proteins | |||
| P58771 | Tpm1 | 21.194 | Tropomyosin 1, α |
| O55126 | GBAS | 9.090 | Glioblastoma-amplified sequence |
| P54071 | IDH2 | 8.477 | Isocitrate dehydrogenase 2 (NADP+), mitochondrial |
| Q921I1 | TF | 6.783 | Transferrin |
| Q9D3D9 | ATP5D | 5.947 | ATP synthase, H+ transporting, mitochondrial F1 complex, δ subunit |
| Q8BH95 | ECHS1 | 5.919 | Enoyl CoA hydratase, short chain, 1, mitochondrial |
| Q8VEM8 | SLC25A3 | 5.740 | Solute carrier family 25 (mitochondrial carrier; phosphate carrier), member 3 |
| P07759 Serpina3K (includes others) | 5.443 | Serine (or cysteine) peptidase inhibitor, clade A, member 3K | |
| Q03265 | ATP5A1 | 5.279 | ATP synthase, H+ transporting, mitochondrial F1 complex, α subunit 1, cardiac muscle |
| P09542 | MYL3 | 5.162 | Myosin, light chain 3, alkali; ventricular, skeletal, slow |
| Q8R4N0 | CLYBL | 4.997 | Citrate lyase β-like |
| Q9CRB9 | CHCHD3 | 4.898 | Coiled−coil−helix−coiled−coil−helix domain containing 3 |
| Q8K2B3 | SDHA | 4.828 | Succinate dehydrogenase complex, subunit A, Flavoprotein (Fp) |
| Q03734 Serpina3K (includes others) | 4.753 | Serine (or cysteine) peptidase inhibitor, clade A, member 3K | |
| P17182 | ENO1 | 4.481 | Enolase 1, (α) |
| Q9EQ20 | ALDH6A1 | 4.468 | Aldehyde dehydrogenase 6 family, member A1 |
| Q8BH59 | SLC25A12 | 4.261 | Solute carrier family 25 (aspartate/glutamate carrier), member 12 |
| Q99PT1 | ARHGDIA | 4.246 | Rho GDP dissociation inhibitor (GDI) α |
| P52480 | Pkm | 4.160 | Pyruvate kinase, muscle |
| P07724 | ALB | 4.120 | Albumin |
| Top 20 down-regulated proteins | |||
| Q9CPU4 | MGST3 | −18.409 | Microsomal glutathione S-transferase 3 |
| P03911 | ND4 | −16.485 | NADH dehydrogenase, subunit 4 (complex I) |
| P10107 | ANXA1 | −12.534 | Annexin A1 |
| P08752 | GNAI2 | −11.634 | Guanine nucleotide-binding protein (G protein), α inhibiting activity polypeptide 2 |
| Q9D0M3 | CYC1 | −10.717 | Cytochrome c−1 |
| P19783 | COX4/1 | −7.542 | Cytochrome c oxidase subunit IV isoform 1 |
| Q924H7 | WAC | −7.256 | WW domain containing adaptor with coiled−coil |
| Q9CR62 | SLC25A11 | −6.208 | Solute carrier family 25 (mitochondrial carrier; oxoglutarate carrier), member 11 |
| P20029 | HSPA5 | −6.013 | Heat shock 70-kDa protein 5 (glucose−regulated protein, 78 kDa) |
| Q9CRB8 | MTFP1 | −5.801 | Mitochondrial fission process 1 |
| E9Q401 | RYR2 | −5.714 | Ryanodine receptor 2 (cardiac) |
| Q9WUB3 | PYGM | −5.499 | Phosphorylase, glycogen, muscle |
| P01027 | C3 | −5.051 | Complement component 3 |
| Q08857 | CD36 | −5.015 | CD36 molecule (thrombospondin receptor) |
| P07356 | ANXA2 | −4.982 | Annexin A2 |
| P04247 | MB | −4.304 | Myoglobin |
| A2ASS6 | TTN | −4.198 | Titin |
| Q9JI91 | ACTN2 | −3.957 | Actinin, α 2 |
| Q9CQ62 | DECR1 | −3.762 | 2,4−Dienoyl-CoA reductase 1, mitochondrial |
| P38647 | HSPA9 | −3.517 | Heat shock 70-kDa protein 9 (mortalin) |
FIGURE 3.

Top network functions generated using Ingenuity Pathways Analysis for KO-I/R versus WT-I/R hearts. Differentially expressed proteins between KO-I/R and WT-I/R hearts (n = 4 each) were determined using GeLC-MS/MS (“Experimental Procedures”). The graph represents cell functions with the highest score (y axis) based on the number of differentially regulated proteins. The orange squares and line in the graph show the ratio of the number of proteins altered identified from our dataset that are in the pathway relative to the total number of proteins in the pathway.
FIGURE 4.

Ingenuity Pathways Analysis of mitochondrial proteins that are differentially expressed between KO-I/R and WT-I/R hearts. Mitochondrial network was generated from the differentially expressed proteins according to the Ingenuity Pathway Knowledge Criteria. Pink, significantly up-regulated proteins; green, significantly down-regulated proteins; white, proteins known to be in the network but were not identified in our analysis.
To validate the key results of proteomics analysis, we performed Western blots and demonstrated that NDUFA4L2 (a subunit of Complex I), BNIP3 (a protein in mitochondrial outer membrane), and MTFP1 were significantly lower in KO-I/R compared with WT-I/R hearts (Fig. 5). These results are consistent with the proteomics data that Complex I and MTFP1 were down-regulated in KO-I/R as compared with WT-I/R hearts (Fig. 4 and Table 1).
FIGURE 5.

Expression of proteins associated with mitochondria. Homogenates of LV apices from WT-I/R and KO-I/R hearts were prepared and proteins subjected to Western blots (“Experimental Procedures”). Protein band intensities are quantified by densitometry, normalized to calsequestrin signals, and summarized in bar graphs at the right. *, p < 0.05.
Mitochondrial Membrane Potential (Δψm) and Mitochondrial Ca2+ Uptake Are Lower in TRPM2 KO Myocytes Post-H/R
Perturbation of mitochondrial complexes in KO-I/R compared with WT-I/R hearts would be expected to result in lower Δψm and decreased mitochondrial Ca2+ uptake. To simulate I/R, isolated myocytes were subjected to H/R before mitochondrial measurements. Compared with WT-normoxic myocytes, Δψm was basally reduced in KO-normoxic myocytes and further lowered in WT-H/R and KO-H/R myocytes (Fig. 6A). Interestingly, Δψm in WT-normoxic myocytes recovered after the addition of a Ca2+ pulse (10 μm). However, Δψm of KO-normoxic, WT-H/R, and KO-I/R myocytes failed to recover after 10 μm Ca2+ pulse (Fig. 6A). Additionally, Δψm measured after a 10 μm Ca2+ pulse and just before CCCP addition was significantly lower in KO-H/R than in WT-H/R myocytes (Fig. 6B).
FIGURE 6.

Mitochondrial membrane potential and mitochondrial Ca2+ uptake are lower in KO myocytes subjected to hypoxia/reoxygenation. LV myocytes isolated from WT and KO mice were subjected to normoxia or hypoxia for 2 h followed by 30 min of reoxygenation (“Experimental Procedures”). Myocytes were permeabilized with digitonin and supplemented with succinate. A, the ratiometric indicator JC-1 was added at 20s and used to monitor Δψm. Arrows indicate the addition of JC-1, Ca2+ (10 μm), and the mitochondrial uncoupler CCCP (2 μm). B, summary of Δψm after Ca2+ addition but before CCCP addition (n = 3 each). C, the ratiometric dye Fura-FF was added at 0 s and used to monitor extra-mitochondrial Ca2+. Repeated pulses of Ca2+ (10 μm) were added as indicated (arrows). The cytosolic Ca2+ clearance rate after the first Ca2+ pulse was measured. f.a.u., fluorescence arbitrary units. D, summary of cytosolic Ca2+ clearance (mitochondrial Ca2+ uptake) rates (n = 3 each). *, p < 0.05; **, p < 0.01; ***, p < 0.001.
Because Δψm was lower in KO myocytes, we next assessed mitochondrial Ca2+ uptake in permeabilized myocytes post-H/R (Fig. 6C). When challenged with repeated pulses of Ca2+, only WT-normoxic myocytes were able to repeatedly lower extra-mitochondrial Ca2+ (Fig. 6C). The rate of mitochondrial Ca2+ uptake was higher in WT-normoxic compared with KO-normoxic myocytes (Fig. 6D). Mitochondrial Ca2+ uptake was significantly lower in KO-H/R compared with WT-H/R myocytes (Fig. 6D).
Basal Mitochondrial Ca2+ Content Is Similar, but Mitochondrial Ca2+ Uniporter Activity Is Lower in KO Myocytes
To elucidate the mechanism of reduced mitochondrial Ca2+ uptake in KO myocytes (Fig. 6, C and D), we measured MCU activity using electrophysiology in which the driving force, ψm, was controlled. IMCU in mitoplasts isolated from KO myocytes was lower when compared with that isolated from WT myocytes (Fig. 7, A and B). This observation indicates that reduced mitochondrial Ca2+ uptake in KO myocytes was due to both reduction in the driving force ψm (Fig. 6, A and B) and intrinsic defects in the mitochondrial Ca2+ uniporter. Conversely, basal mitochondrial Ca2+ contents were similar in permeabilized WT and KO myocytes under unstimulated conditions, indicating that the existence of alternative mechanisms to maintain the mitochondrial Ca2+ homeostasis (Fig. 7, C and D).
FIGURE 7.

Mitochondrial Ca2+ uniporter activity (IMCU) is lower in KO myocytes, but basal mitochondrial Ca2+ levels are similar between WT and KO myocytes. A, currents from cardiac mitoplasts (IMCU) were recorded before and after application of 5 mm Ca2+ to the bath medium. IMCU were recorded during a voltage-ramp as indicated. Traces are representative single recordings of IMCU from WT (black) and KO (blue) myocytes. B, current-time integral indicating the amount of Ca2+ influx during voltage-ramp (fmol/picofarads) in WT (black) and KO (blue) mitoplasts; n = 3 each. pF, picofarads. C, freshly isolated myocytes from WT and KO mice were permeabilized with digitonin and supplemented with succinate. The ratiometric dye Fura-FF was used to monitor extra-mitochondrial Ca2+. After steady-state Fura-FF signals were obtained, CGP37157 (10 μm) was added to inhibit mitochondrial Ca2+ release via the mitochondrial Na+/Ca2+ exchanger. CCCP (2 μm) was then added to release endogenous mitochondrial Ca2+. D, quantitation of mitochondrial Ca2+ contents (n = 4 each). **, p < 0.01.
Mitochondrial O2 Consumption Is Lower in TRPM2 KO-H/R Myocytes
Having observed the dysregulation of mitochondrial complexes in KO I/R myocytes, we next asked whether mitochondrial complex activities were altered in cardiac myocytes. We measured OCR in intact adult LV cardiac myocytes subjected to normoxia or H/R. Under normoxic conditions, both basal and maximal OCR was reduced in KO compared with WT myocytes (Fig. 8, A–C). As expected, H/R reduced both basal and maximal respiration rates in WT myocytes. This was further exacerbated in KO-H/R myocytes (Fig. 8, A–C). Our results indicated that KO myocytes were more vulnerable to H/R injury due to impairment of mitochondrial bioenergetics.
FIGURE 8.

O2 consumption is markedly reduced in KO-H/R myocytes. LV myocytes isolated from WT and KO mice were subjected to normoxia or hypoxia for 2 h followed by 30 min of reoxygenation. O2 consumption rate was measured in intact myocytes (“Experimental Procedures”). A, after basal OCR was obtained, oligomycin (1 μm) was added to inhibit F0F1ATPase (Complex V). The uncoupler carbonyl cyanide 4-(trifluoromethoxy)phenylhydrazone (FCCP; 1 μm) was then added, and maximal OCR was measured. Finally, antimycin A + rotenone (1 μm each) were added to inhibit cytochrome bc1 complex (Complex III) and NADH dehydrogenase (Complex I), respectively. Each point in the traces represents the average of eight different wells. B and C, summary of basal (B) and maximal (C) OCR of 4 groups of myocytes (n = 3 each). ***, p < 0.001.
To confirm the aberrant mitochondrial function in intact KO hearts, we measured O2 consumption and ATP levels in WT and KO heart slices (Fig. 9). Under basal conditions, ATP levels were significantly lower in KO compared with WT hearts (Fig. 9A). Because cardiac myocytes are the major cell types in the heart, ATP levels were also measured in freshly isolated myocytes from WT and KO hearts. As expected, ATP levels were markedly lower in KO myocytes when compared with WT myocytes (Fig. 9B). O2 consumption rates were also significantly lower in KO when compared with WT hearts (Fig. 9C). These results demonstrate that loss of TRPM2-mediated Ca2+ entry impacts mitochondrial bioenergetics.
FIGURE 9.
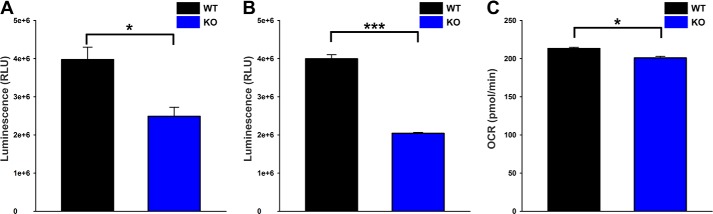
ATP levels and O2 consumption are lower in KO hearts. A, hearts from WT (black) and KO (blue) mice were homogenized, and ATP levels were measured by CellTiter-Glo assay. n = 3 each. B, similarly, freshly isolated myocytes from WT (black) and KO (blue) mice were used to measure the ATP levels. n = 6 each. C, heart slices generated from WT (black) and KO (blue) mice were subjected to OCR measurement, and the graph represents the basal OCR. n = 3 each. *, p < 0.05; ***, p < 0.001.
In Situ ROS Levels Are Higher in TRPM2 KO-I/R Hearts
Mitochondria are the major source of ROS in cardiac myocytes. Because mitochondrial dysfunction was prominent in KO-I/R hearts (Figs. 3 and 4), we measured ROS levels in WT and KO hearts after I/R. Strikingly, KO-I/R heart slices had higher levels of ROS than WT-I/R heart slices (Fig. 10). Interestingly, KO-sham hearts also had significantly higher ROS compared with WT-sham hearts, suggesting mitochondrial dysfunction may be present pre-I/R and subsequently prone to enhanced ROS levels.
FIGURE 10.

In situ ROS levels are prominent in KO-I/R heart slices. Hearts from WT and KO mice were subjected to sham operation or 30 min ischemia followed by 30 min reperfusion, after which ROS levels were measured in heart slices (“Experimental Procedures”). A, multi-photon confocal images of DHE-stained LV slices. B, 2.5-dimensional heatmap plots of mean DHE intensity are shown for WT-sham, KO-sham, WT-I/R, and KO-I/R heart slices. C, quantitation of DHE fluorescence in fluorescence arbitrary units (f.a.u.). DHE fluorescence from at least 3 slices from each heart are quantitated for WT-sham (2 mice), KO-sham (2 mice), WT-I/R (2 mice), and KO-I/R (5 mice) animals. *, p < 0.05; **, p < 0.01.
To confirm that the elevated ROS levels observed in KO heart slices were mitochondrial in origin, we measured mitochondrial ROS in isolated myocytes using MitoSOX Red, which detects mitochondrial superoxide anion. MitoSOX Red co-localized with mitochondrial membrane potential marker rhodamine 123 (Fig. 11A), confirming MitoSOX Red fluorescence was mitochondrial in origin. KO myocytes had lower rhodamine 123 fluorescence (Fig. 11B) but much higher MitoSOX Red fluorescence compared with WT myocytes (Fig. 11C), suggesting that enhanced mitochondrial superoxide production accounted for most of the elevated ROS levels detected by DHE in heart slices (Fig. 10).
FIGURE 11.

Mitochondrial membrane potential is lower and mitochondrial ROS level is higher in KO myocytes. A, myocytes isolated from WT and KO mice were loaded with the mitochondrial membrane potential indicator rhodamine 123 and mitochondrial superoxide indicator MitoSOX Red. Confocal images showed co-localization of MitoSOX Red and rhodamine 123 signals. B and C, quantitation of rhodamine 123 (ψm) and MitoSOX Red (mROS) signal intensities in fluorescence arbitrary units (f.a.u.) from WT (n = 21) and KO (n = 19) myocytes. **, p < 0.01.
DISCUSSION
TRP channels have been implicated in the pathogenesis of cardiovascular diseases (2, 6). For example, TRPC (TRP-canonical) channels have been proposed to be critical regulators of microdomain Ca2+ signaling in the heart to control pathological hypertrophy (38). Focusing on TRPM channels, although TRPM4 channels have been associated with conduction abnormalities, cardiac arrhythmias, and hypertension (8, 9), to date there is limited understanding of TRPM2 channels in the heart (5, 7, 39, 40). The present study provides evidence that TRPM2 channels were activated by ADPR (Fig. 1) and inhibited by flufenamic acid and that TRPM2 conductance to Ca2+ is ≅55% that of Na+ in adult ventricular myocytes (Fig. 2). Our recent report indicates that H2O2 induces a much larger [Ca2+]i increase in WT compared with KO myocytes and that the [Ca2+]i increase is inhibited by clotrimazole (5). These data provide evidence that TRPM2 is present and functional in adult ventricular myocytes. Additionally, TRPM2 offers protection against cardiac I/R injury (5).
To identify the molecular pathways involved in amelioration of cardiac I/R injury by TRPM2, we employed GeLC-MS/MS to assess TRPM2-induced differential expression of the whole proteome of post-I/R hearts (Table 1). The canonical pathway that stands out (highest log(p value)) is mitochondrial dysfunction (Fig. 3). Specifically, the mitochondrial electron transport chain was significantly dysregulated in KO-I/R compared with WT-I/R hearts (Fig. 4).
Because the proteome characterization and bioinformatics analysis revealed that mitochondrial dysfunction was the major pathway that was significantly altered in KO-I/R hearts, we sought to independently validate the proteomics results with protein expression and functional mitochondrial assays. In agreement with proteomics results (Fig. 4 and Table 1), Western blots demonstrated that NDUFA4L2 (a subunit of Complex I), BNIP3, and MTFP1 were significantly lower in KO-I/R hearts (Fig. 5). Using H/R to simulate I/R, we first established that H/R resulted in mitochondrial injury in WT myocytes as manifested by lower Δψm, decreased mitochondrial Ca2+ uptake (Fig. 6), and reduced oxygen consumption (Fig. 8) when compared with their normoxic controls. Consistent with the results of global proteomics analysis, Δψm, mitochondrial Ca2+ uptake (Fig. 6), and O2 consumption (Fig. 8) were consistently lower in KO-H/R compared with WT-H/R myocytes.
One interesting observation is that under normoxic conditions, KO myocytes already had significantly lower Δψm (Figs. 6 and 11), decreased mitochondrial Ca2+ uptake (Fig. 6), higher mitochondrial superoxide levels (Fig. 11), and reduced ATP (Fig. 9) and O2 consumption (Fig. 8) when compared with WT myocytes, suggesting the loss of TRPM2 was associated with mitochondrial impairment. Reduced mitochondrial Ca2+ uptake in KO myocytes (Fig. 6) was due to both reduction in driving force (ψm) (Figs. 6 and 11) and suboptimal mitochondrial Ca2+ uniporter activity (Fig. 7). Surprisingly, at equivalent membrane potential, IMCU was still lower in mitoplasts prepared from KO myocytes, suggesting the perturbation of MCU complex (30, 33, 41–46). Impaired mitochondrial function in KO myocytes was manifested as lower ATP levels and O2 consumption in both KO myocytes and intact KO hearts (Figs. 8 and 9).
Physiologically, ROS are produced during respiration by the mitochondrial electron transport chain and pathologically by increased electron leakage. This is supported by the observation that ROS levels were significantly higher in KO-sham compared with WT-sham heart slices (Fig. 10). Further characterization of ROS generation in KO myocytes revealed that elevated ROS are derived from mitochondria (Fig. 11), possibly due to aberrant mitochondrial bioenergetics.
Although TRPM2 ablation elicits mitochondrial bioenergetics impairment, the mechanism by which TRPM2, a cell surface ion channel, affects mitochondrial function warrants further studies. Based on our previous observations that WT-I/R hearts had higher levels of HIF-1α, FoxO3a, and SOD2 (5) and our current demonstration that BNIP3 and NDUFA4L2 were higher in WT-I/R myocytes (Fig. 5), we postulate the following mechanism linking TRPM2 activation to amelioration of mitochondrial dysfunction and reduced ROS production in WT-I/R as compared with KO-I/R hearts (Fig. 12). Ca2+ influx from activated TRPM2 channels enhances calcineurin activity, which in turn dephosphorylates RACK1 and blocks RACK1 dimerization (47). This results in increased HIF-1α levels by impeding its ubiquitination and degradation. HIF-1α is a transcription factor that enhances cell viability through regulation of a large number of target genes including those involved in angiogenesis, glycolysis, and energy and redox homeostasis. These include FoxO3a (48), MnSOD (49), and genes involved in electron transport chain (NDUFA4L2) (50) and mitochondrial autophagy (BNIP3) (51). NDUFA4L2 expression has been shown to reduce ROS production, although the exact mechanism is not known (50), and BNIP3 is necessary for mitochondrial autophagy, which also limits ROS production (51, 52). Another interesting speculation is that TRPM2 may participate in the recently identified essential role of constitutive, low level mitochondrial Ca2+ uptake in maintaining cellular bioenergetics (53). TRPM2 may provide the necessary Ca2+ for mitochondrial bioenergetics maintenance in the heart.
FIGURE 12.
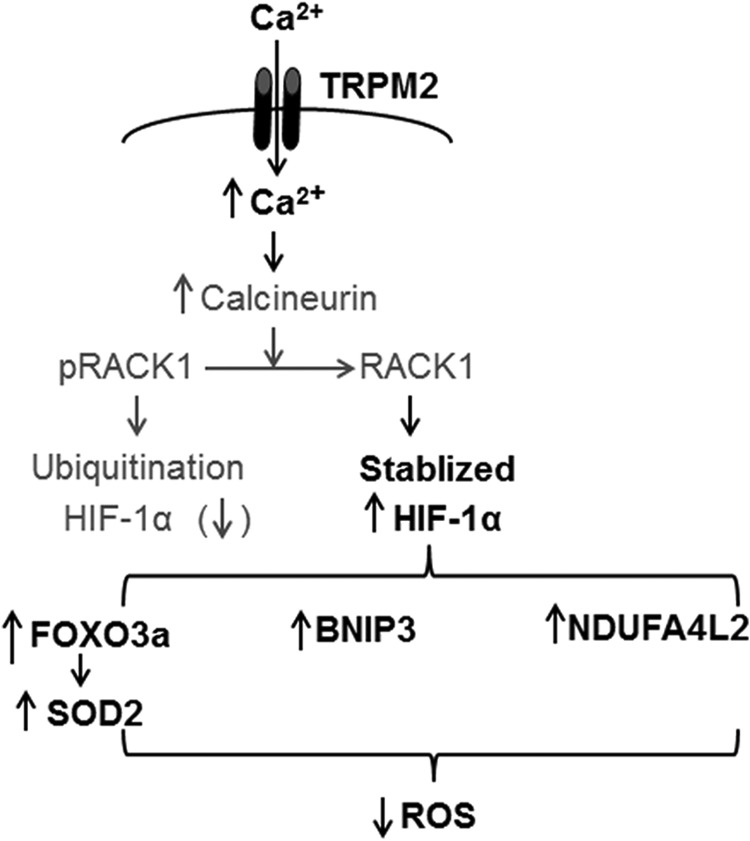
Hypothetical mechanism by which cardiac TRPM2 channels modulate mitochondrial function and ROS production. Ca2+ influx via activated TRPM2 channels increases cytosolic Ca2+ concentration, thereby activating calcineurin. Calcineurin dephosphorylates RACK1 and blocks RACK1 dimerization. The net result is increased HIF-1α levels by impeding its ubiquitination and degradation. HIF-1α enhances many target gene transcription including FoxO3a, which leads to increased SOD2 expression, and mitochondrial NDUFA4L2 (Complex I) and other mitochondrial gene (BNIP3) expression. Both SOD2 and physiological Complex I activity result in reduced mitochondrial ROS levels. Differences in protein levels between WT-I/R and KO-I/R hearts that have been authenticated by experimental results from the present (Fig. 5) or previous (5) studies are in bold fonts, whereas hypothetical signaling molecules are in regular fonts.
A recent study using an independent TRPM2 knock-out mouse (C57BL/6 background) reported very different results (40). Specifically, after 45 min of ischemia followed by 24 h of reperfusion in vivo, neutrophil infiltration was less, infarct size was smaller, and +dP/dt was higher in KO compared with WT hearts. In addition, pretreatment with econazole (10 μm) to inhibit TRPM2 channels in WT neutrophils followed by re-infusion of neutrophils in isolated perfused hearts reduced infarct size in KO hearts subjected to 60 min ischemia followed by 2 h of reperfusion. The authors speculated that increased neutrophil adhesion to endothelial cells mediated by TRPM2 channels caused increased damage post-I/R. We have previously (5) discussed some of the reasons accounting for the differences between our results and those of Hiroi et al. (40). In addition, alternative strategies like conditional, organ-specific knock-out approach could be employed to clarify the contribution of TRPM2 in I/R injury. In this context, we have generated a cardiac-specific, TRPM2KO mouse in which hematopoietic progenitors but not cardiac myocytes express TRPM2. After I/R, cardiac-specific TRPM2KO hearts exhibited significantly lower +dP/dt compared with WT hearts,4 similar to the findings in global TRPM2KO mice (5). Our preliminary observations suggest that the role played by TRPM2 channels in neutrophils on cardiac I/R injury is likely to be small.
The conventional wisdom regarding the role of TRPM2 channels in disease states is that activation of TRPM2 induces cell death by sustained increases in [Ca2+]i (13, 54) or mediates enhanced chemokine production in hematopoietic cells thereby triggering inflammatory response and tissue injury (55). TRPM2 also plays a role in susceptibility to oxidative stress (54, 56, 57). On the other hand, TRPM2 channels participate in cell proliferation and differentiation and, therefore, have become novel targets for cancer (58). The present findings that TRPM2 channels protected hearts from injury by alleviating oxidative stress have clinical relevance. When targeting TRPM2 for cancer therapy, it is important to assess potentially adverse effects on cardiac function and devise a rational approach to ameliorate cardiac side effects while preserving therapeutic efficacy.
In summary, genetic ablation of TRPM2 resulted in decreased cardiac mitochondrial function that was further compromised after hypoxia/reoxygenation. Mitochondrial electron transport chain impairment was coupled with elevated ROS levels in KO-I/R compared with WT-I/R hearts. Aberrant bioenergetics together with elevated ROS levels may account for poor cardiac performance despite similar infarct sizes in KO-I/R hearts (5). Collectively, our findings indicated that TRPM2 channels preserved mitochondrial bioenergetics and protected cardiac myocytes from ischemic injury.
This work was supported, in whole or in part, by National Institutes of Health Grants RO1-DK46778 (to B. A. M.), R21-CA165068 (to S. M.), RO1-HL56205, RO1-HL61690, RO1-HL85503, PO1-HL-75443, and PO1-HL-91799 (to W. J. K.), PO1-HL91799 (Project 2; to A. M. F.), RO1-HL86699 (to M. M.), and RO1-HL58672 and RO1-HL74854 (to J. Y. C.).

This article contains supplemental Table 1.
J. Y. Cheung, unpublished observations.
- TRP
- transient receptor potential
- TRPM
- TRP-melastatin
- ADPR
- adenosine diphosphate-ribose
- BNIP3
- Bcl2/adenovirus E1B 19 kDa-interacting protein 3
- [Ca2+]o
- extracellular Ca2+ concentration
- [Ca2+]i
- intracellular Ca2+ concentration
- CCCP
- carbonyl cyanide m-chlorophenylhydrazone
- Δψm
- mitochondrial membrane potential
- DHE
- dihydroethidium
- Em
- membrane potential
- Erev
- reversal potential
- FoxO3a
- forkhead box transcription factor 3a
- G
- ion conductance
- GCa
- Ca2+ conductance
- GNa
- Na+ conductance
- GeLC
- gel electrophoresis LC
- HIF-1α
- hypoxia-inducible factor 1α
- H/R
- hypoxia/reoxygenation
- I
- macroscopic current
- I/R
- ischemia/reperfusion
- I-V
- current-voltage
- LV
- left ventricular
- MCU
- mitochondrial Ca2+ uniporter
- MTFP1
- mitochondrial fission process 1
- NDUFA4L2
- NADH dehydrogenase (ubiquinone) 1α subcomplex 4-like 2
- OCR
- oxygen consumption rate
- RACK1
- receptor for activated C kinase1
- ROS
- reactive oxygen species
- SOD
- superoxide dismutase
- TCA
- tricarboxylic acid.
REFERENCES
- 1. Ramsey I. S., Delling M., Clapham D. E. (2006) An introduction to TRP channels. Annu. Rev. Physiol. 68, 619–647 [DOI] [PubMed] [Google Scholar]
- 2. Nilius B., Owsianik G., Voets T., Peters J. A. (2007) Transient receptor potential cation channels in disease. Physiol. Rev. 87, 165–217 [DOI] [PubMed] [Google Scholar]
- 3. Hofmann T., Schaefer M., Schultz G., Gudermann T. (2002) Subunit composition of mammalian transient receptor potential channels in living cells. Proc. Natl. Acad. Sci. U.S.A. 99, 7461–7466 [DOI] [PMC free article] [PubMed] [Google Scholar]
- 4. Li M., Jiang J., Yue L. (2006) Functional characterization of homo- and heteromeric channel kinases TRPM6 and TRPM7. J Gen. Physiol. 127, 525–537 [DOI] [PMC free article] [PubMed] [Google Scholar]
- 5. Miller B. A., Wang J., Hirschler-Laszkiewicz I., Gao E., Song J., Zhang X. Q., Koch W. J., Madesh M., Mallilankaraman K., Gu T., Chen S. J., Keefer K., Conrad K., Feldman A. M., Cheung J. Y. (2013) The second member of transient receptor potential-melastatin channel family protects hearts from ischemia-reperfusion injury. Am. J. Physiol. Heart Circ. Physiol. 304, H1010–H1022 [DOI] [PMC free article] [PubMed] [Google Scholar]
- 6. Watanabe H., Murakami M., Ohba T., Takahashi Y., Ito H. (2008) TRP channel and cardiovascular disease. Pharmacol. Ther. 118, 337–351 [DOI] [PubMed] [Google Scholar]
- 7. Zhang Z., Zhang W., Jung D. Y., Ko H. J., Lee Y., Friedline R. H., Lee E., Jun J., Ma Z., Kim F., Tsitsilianos N., Chapman K., Morrison A., Cooper M. P., Miller B. A., Kim J. K. (2012) TRPM2 Ca2+ channel regulates energy balance and glucose metabolism. Am. J. Physiol. Endocrinol. Metab. 302, E807–E816 [DOI] [PMC free article] [PubMed] [Google Scholar]
- 8. Simard C., Sallé L., Rouet R., Guinamard R. (2012) Transient receptor potential melastatin 4 inhibitor 9-phenanthrol abolishes arrhythmias induced by hypoxia and re-oxygenation in mouse ventricle. Br. J. Pharmacol. 165, 2354–2364 [DOI] [PMC free article] [PubMed] [Google Scholar]
- 9. Abriel H., Syam N., Sottas V., Amarouch M. Y., Rougier J. S. (2012) TRPM4 channels in the cardiovascular system. Physiology, pathophysiology, and pharmacology. Biochem. Pharmacol. 84, 873–881 [DOI] [PubMed] [Google Scholar]
- 10. Perraud A. L., Fleig A., Dunn C. A., Bagley L. A., Launay P., Schmitz C., Stokes A. J., Zhu Q., Bessman M. J., Penner R., Kinet J. P., Scharenberg A. M. (2001) ADP-ribose gating of the calcium-permeable LTRPC2 channel revealed by Nudix motif homology. Nature 411, 595–599 [DOI] [PubMed] [Google Scholar]
- 11. Nilius B., Prenen J., Janssens A., Owsianik G., Wang C., Zhu M. X., Voets T. (2005) The selectivity filter of the cation channel TRPM4. J. Biol. Chem. 280, 22899–22906 [DOI] [PubMed] [Google Scholar]
- 12. Mathar I., Vennekens R., Meissner M., Kees F., Van der Mieren G., Camacho Londoño J. E., Uhl S., Voets T., Hummel B., van den Bergh A., Herijgers P., Nilius B., Flockerzi V., Schweda F., Freichel M. (2010) Increased catecholamine secretion contributes to hypertension in TRPM4-deficient mice. J. Clin. Invest. 120, 3267–3279 [DOI] [PMC free article] [PubMed] [Google Scholar]
- 13. Sumoza-Toledo A., Penner R. (2011) TRPM2. A multifunctional ion channel for calcium signalling. J. Physiol. 589, 1515–1525 [DOI] [PMC free article] [PubMed] [Google Scholar]
- 14. Zhou Y. Y., Wang S. Q., Zhu W. Z., Chruscinski A., Kobilka B. K., Ziman B., Wang S., Lakatta E. G., Cheng H., Xiao R. P. (2000) Culture and adenoviral infection of adult mouse cardiac myocytes. Methods for cellular genetic physiology. Am. J. Physiol. Heart Circ. Physiol. 279, H429–H436 [DOI] [PubMed] [Google Scholar]
- 15. Song J., Zhang X. Q., Wang J., Cheskis E., Chan T. O., Feldman A. M., Tucker A. L., Cheung J. Y. (2008) Regulation of cardiac myocyte contractility by phospholemman: Na+/Ca2+ exchange vs. Na+-K+-ATPase. Am. J. Physiol. Heart Circ. Physiol. 295, H1615–H1625 [DOI] [PMC free article] [PubMed] [Google Scholar]
- 16. Song J., Gao E., Wang J., Zhang X. Q., Chan T. O., Koch W. J., Shang X., Joseph J. I., Peterson B. Z., Feldman A. M., Cheung J. Y. (2012) Constitutive overexpression of phospholemman S68E mutant results in arrhythmias, early mortality, and heart failure. Potenial involvement of Na+/Ca2+ exchanger. Am. J. Physiol. Heart Circ. Physiol. 302, H770–H781 [DOI] [PMC free article] [PubMed] [Google Scholar]
- 17. Wang J., Gao E., Rabinowitz J., Song J., Zhang X. Q., Koch W. J., Tucker A. L., Chan T. O., Feldman A. M., Cheung J. Y. (2011) Regulation of in vivo cardiac contractility by phospholemman. Role of Na+/Ca2+ exchange. Am. J. Physiol. Heart Circ. Physiol 300, H859–H868 [DOI] [PMC free article] [PubMed] [Google Scholar]
- 18. Wang J., Chan T. O., Zhang X. Q., Gao E., Song J., Koch W. J., Feldman A. M., Cheung J. Y. (2009) Induced overexpression of Na+/Ca2+ exchanger transgene. Altered myocyte contractility, [Ca2+]i transients, SR Ca2+ contents and action potential duration. Am. J. Physiol. Heart Circ. Physiol. 297, H590–H601 [DOI] [PMC free article] [PubMed] [Google Scholar]
- 19. Wang J., Gao E., Song J., Zhang X. Q., Li J., Koch W. J., Tucker A. L., Philipson K. D., Chan T. O., Feldman A. M., Cheung J. Y. (2010) Phospholemman and β-adrenergic stimulation in the heart. Am. J. Physiol. Heart Circ. Physiol. 298, H807–H815 [DOI] [PMC free article] [PubMed] [Google Scholar]
- 20. Tucker A. L., Song J., Zhang X. Q., Wang J., Ahlers B. A., Carl L. L., Mounsey J. P., Moorman J. R., Rothblum L. I., Cheung J. Y. (2006) Altered contractility and [Ca2+]i homeostasis in phospholemman-deficient murine myocytes. Role of Na+/Ca2+ exchange. Am. J. Physiol. Heart Circ. Physiol. 291, H2199–H2209 [DOI] [PMC free article] [PubMed] [Google Scholar]
- 21. Kolisek M., Beck A., Fleig A., Penner R. (2005) Cyclic ADP-ribose and hydrogen peroxide synergize with ADP-ribose in the activation of TRPM2 channels. Mol. Cell 18, 61–69 [DOI] [PubMed] [Google Scholar]
- 22. Hill K., Benham C. D., McNulty S., Randall A. D. (2004) Flufenamic acid is a pH-dependent antagonist of TRPM2 channels. Neuropharmacology 47, 450–460 [DOI] [PubMed] [Google Scholar]
- 23. Gao E., Lei Y. H., Shang X., Huang Z. M., Zuo L., Boucher M., Fan Q., Chuprun J. K., Ma X. L., Koch W. J. (2010) A novel and efficient model of coronary artery ligation and myocardial infarction in the mouse. Circ. Res. 107, 1445–1453 [DOI] [PMC free article] [PubMed] [Google Scholar]
- 24. Li X., Mikhalkova D., Gao E., Zhang J., Myers V., Zincarelli C., Lei Y., Song J., Koch W. J., Peppel K., Cheung J. Y., Feldman A. M., Chan T. O. (2011) Myocardial injury after ischemia-reperfusion in mice deficient in Akt2 is associated with increased cardiac macrophage density. Am. J. Physiol. Heart Circ. Physiol. 301, H1932–H1940 [DOI] [PMC free article] [PubMed] [Google Scholar]
- 25. Barrero C. A., Perez-Leal O., Aksoy M., Moncada C., Ji R., Lopez Y., Mallilankaraman K., Madesh M., Criner G. J., Kelsen S. G., Merali S. (2013) Histone 3.3 participates in a self-sustaining cascade of apoptosis that contributes to the progression of chronic obstructive pulmonary disease. Am. J. Respir. Crit. Care Med. 188, 673–683 [DOI] [PMC free article] [PubMed] [Google Scholar]
- 26. Dyrlund T. F., Poulsen E. T., Scavenius C., Sanggaard K. W., Enghild J. J. (2012) MS data miner. A web-based software tool to analyze, compare, and share mass spectrometry protein identifications. Proteomics 12, 2792–2796 [DOI] [PubMed] [Google Scholar]
- 27. Barrero C. A., Datta P. K., Sen S., Deshmane S., Amini S., Khalili K., Merali S. (2013) HIV-1 Vpr modulates macrophage metabolic pathways. A SILAC-based quantitative analysis. PloS ONE 8, e68376. [DOI] [PMC free article] [PubMed] [Google Scholar]
- 28. Cheng Z., Jiang X., Kruger W. D., Praticò D., Gupta S., Mallilankaraman K., Madesh M., Schafer A. I., Durante W., Yang X., Wang H. (2011) Hyperhomocysteinemia impairs endothelium-derived hyperpolarizing factor-mediated vasorelaxation in transgenic cystathionine β synthase-deficient mice. Blood 118, 1998–2006 [DOI] [PMC free article] [PubMed] [Google Scholar]
- 29. Cheung J. Y., Thompson I. G., Bonventre J. V. (1982) Effects of extracellular calcium removal and anoxia on isolated rat myocytes. Am. J. Physiol. Cell Physiol. 243, C184–C190 [DOI] [PubMed] [Google Scholar]
- 30. Mallilankaraman K., Doonan P., Cárdenas C., Chandramoorthy H. C., Müller M., Miller R., Hoffman N. E., Gandhirajan R. K., Molgó J., Birnbaum M. J., Rothberg B. S., Mak D. O., Foskett J. K., Madesh M. (2012) MICU1 is an essential gatekeeper for MCU-mediated mitochondrial Ca2+ uptake that regulates cell survival. Cell 151, 630–644 [DOI] [PMC free article] [PubMed] [Google Scholar]
- 31. Irrinki K. M., Mallilankaraman K., Thapa R. J., Chandramoorthy H. C., Smith F. J., Jog N. R., Gandhirajan R. K., Kelsen S. G., Houser S. R., May M. J., Balachandran S., Madesh M. (2011) Requirement of FADD, NEMO, and BAX/BAK for aberrant mitochondrial function in tumor necrosis factor α-induced necrosis. Mol. Cell. Biol. 31, 3745–3758 [DOI] [PMC free article] [PubMed] [Google Scholar]
- 32. Kirichok Y., Krapivinsky G., Clapham D. E. (2004) The mitochondrial calcium uniporter is a highly selective ion channel. Nature 427, 360–364 [DOI] [PubMed] [Google Scholar]
- 33. Hoffman N. E., Chandramoorthy H. C., Shamugapriya S., Zhang X., Rajan S., Mallilankaraman K., Gandhirajan R. K., Vagnozzi R. J., Ferrer L. M., Sreekrishnanilayam K., Natarajaseenivasan K., Vallem S., Force T., Choi E. T., Cheung J. Y., Madesh M. (2013) MICU1 motifs define mitochondrial calcium uniporter binding and activity. Cell Rep. 5, 1576–1588 [DOI] [PMC free article] [PubMed] [Google Scholar]
- 34. Mukhopadhyay P., Rajesh M., Haskó G., Hawkins B. J., Madesh M., Pacher P. (2007) Simultaneous detection of apoptosis and mitochondrial superoxide production in live cells by flow cytometry and confocal microscopy. Nat. Protoc. 2, 2295–2301 [DOI] [PMC free article] [PubMed] [Google Scholar]
- 35. Robinson K. M., Janes M. S., Pehar M., Monette J. S., Ross M. F., Hagen T. M., Murphy M. P., Beckman J. S. (2006) Selective fluorescent imaging of superoxide in vivo using ethidium-based probes. Proc. Natl. Acad. Sci. U.S.A. 103, 15038–15043 [DOI] [PMC free article] [PubMed] [Google Scholar]
- 36. Hermosura M. C., Cui A. M., Go R. C., Davenport B., Shetler C. M., Heizer J. W., Schmitz C., Mocz G., Garruto R. M., Perraud A. L. (2008) Altered functional properties of a TRPM2 variant in Guamanian ALS and PD. Proc. Natl. Acad. Sci. U.S.A. 105, 18029–18034 [DOI] [PMC free article] [PubMed] [Google Scholar]
- 37. Mederos y Schnitzler M., Wäring J., Gudermann T., Chubanov V. (2008) Evolutionary determinants of divergent calcium selectivity of TRPM channels. Faseb J 22, 1540–1551 [DOI] [PubMed] [Google Scholar]
- 38. Eder P., Molkentin J. D. (2011) TRPC channels as effectors of cardiac hypertrophy. Circ. Res. 108, 265–272 [DOI] [PubMed] [Google Scholar]
- 39. Yang K. T., Chang W. L., Yang P. C., Chien C. L., Lai M. S., Su M. J., Wu M. L. (2006) Activation of the transient receptor potential M2 channel and poly(ADP-ribose) polymerase is involved in oxidative stress-induced cardiomyocyte death. Cell Death Differ. 13, 1815–1826 [DOI] [PubMed] [Google Scholar]
- 40. Hiroi T., Wajima T., Negoro T., Ishii M., Nakano Y., Kiuchi Y., Mori Y., Shimizu S. (2013) Neutrophil TRPM2 channels are implicated in the exacerbation of myocardial ischemia/reperfusion injury. Cardiovasc. Res. 97, 271–281 [DOI] [PubMed] [Google Scholar]
- 41. Mallilankaraman K., Cárdenas C., Doonan P. J., Chandramoorthy H. C., Irrinki K. M., Golenár T., Csordás G., Madireddi P., Yang J., Müller M., Miller R., Kolesar J. E., Molgó J., Kaufman B., Hajnóczky G., Foskett J. K., Madesh M. (2012) MCUR1 is an essential component of mitochondrial Ca2+ uptake that regulates cellular metabolism. Nat. Cell Biol. 14, 1336–1343 [DOI] [PMC free article] [PubMed] [Google Scholar]
- 42. Baughman J. M., Perocchi F., Girgis H. S., Plovanich M., Belcher-Timme C. A., Sancak Y., Bao X. R., Strittmatter L., Goldberger O., Bogorad R. L., Koteliansky V., Mootha V. K. (2011) Integrative genomics identifies MCU as an essential component of the mitochondrial calcium uniporter. Nature 476, 341–345 [DOI] [PMC free article] [PubMed] [Google Scholar]
- 43. Perocchi F., Gohil V. M., Girgis H. S., Bao X. R., McCombs J. E., Palmer A. E., Mootha V. K. (2010) MICU1 encodes a mitochondrial EF hand protein required for Ca2+ uptake. Nature 467, 291–296 [DOI] [PMC free article] [PubMed] [Google Scholar]
- 44. Plovanich M., Bogorad R. L., Sancak Y., Kamer K. J., Strittmatter L., Li A. A., Girgis H. S., Kuchimanchi S., De Groot J., Speciner L., Taneja N., Oshea J., Koteliansky V., Mootha V. K. (2013) MICU2, a paralog of MICU1, resides within the mitochondrial uniporter complex to regulate calcium handling. PLoS ONE 8, e55785. [DOI] [PMC free article] [PubMed] [Google Scholar]
- 45. De Stefani D., Raffaello A., Teardo E., Szabò I., Rizzuto R. (2011) A forty-kilodalton protein of the inner membrane is the mitochondrial calcium uniporter. Nature 476, 336–340 [DOI] [PMC free article] [PubMed] [Google Scholar]
- 46. Sancak Y., Markhard A. L., Kitami T., Kovács-Bogdán E., Kamer K. J., Udeshi N. D., Carr S. A., Chaudhuri D., Clapham D. E., Li A. A., Calvo S. E., Goldberger O., Mootha V. K. (2013) EMRE is an essential component of the mitochondrial calcium uniporter complex. Science 342, 1379–1382 [DOI] [PMC free article] [PubMed] [Google Scholar]
- 47. Liu Y. V., Hubbi M. E., Pan F., McDonald K. R., Mansharamani M., Cole R. N., Liu J. O., Semenza G. L. (2007) Calcineurin promotes hypoxia-inducible factor 1α expression by dephosphorylating RACK1 and blocking RACK1 dimerization. J. Biol. Chem. 282, 37064–37073 [DOI] [PMC free article] [PubMed] [Google Scholar]
- 48. Bakker W. J., Harris I. S., Mak T. W. (2007) FOXO3a is activated in response to hypoxic stress and inhibits HIF1-induced apoptosis via regulation of CITED2. Mol. Cell 28, 941–953 [DOI] [PubMed] [Google Scholar]
- 49. Kops G. J., Dansen T. B., Polderman P. E., Saarloos I., Wirtz K. W., Coffer P. J., Huang T. T., Bos J. L., Medema R. H., Burgering B. M. (2002) Forkhead transcription factor FOXO3a protects quiescent cells from oxidative stress. Nature 419, 316–321 [DOI] [PubMed] [Google Scholar]
- 50. Tello D., Balsa E., Acosta-Iborra B., Fuertes-Yebra E., Elorza A., Ordóñez Á., Corral-Escariz M., Soro I., López-Bernardo E., Perales-Clemente E., Martínez-Ruiz A., Enríquez J. A., Aragonés J., Cadenas S., Landázuri M. O. (2011) Induction of the mitochondrial NDUFA4L2 protein by HIF-1α decreases oxygen consumption by inhibiting Complex I activity. Cell Metab. 14, 768–779 [DOI] [PubMed] [Google Scholar]
- 51. Zhang H., Bosch-Marce M., Shimoda L. A., Tan Y. S., Baek J. H., Wesley J. B., Gonzalez F. J., Semenza G. L. (2008) Mitochondrial autophagy is an HIF-1-dependent adaptive metabolic response to hypoxia. J. Biol. Chem. 283, 10892–10903 [DOI] [PMC free article] [PubMed] [Google Scholar] [Retracted]
- 52. Semenza G. L. (2011) Hypoxia-inducible factor 1. Regulator of mitochondrial metabolism and mediator of ischemic preconditioning. Biochim. Biophys. Acta 1813, 1263–1268 [DOI] [PMC free article] [PubMed] [Google Scholar]
- 53. Cárdenas C., Miller R. A., Smith I., Bui T., Molgó J., Müller M., Vais H., Cheung K. H., Yang J., Parker I., Thompson C. B., Birnbaum M. J., Hallows K. R., Foskett J. K. (2010) Essential regulation of cell bioenergetics by constitutive InsP3 receptor Ca2+ transfer to mitochondria. Cell 142, 270–283 [DOI] [PMC free article] [PubMed] [Google Scholar]
- 54. Hara Y., Wakamori M., Ishii M., Maeno E., Nishida M., Yoshida T., Yamada H., Shimizu S., Mori E., Kudoh J., Shimizu N., Kurose H., Okada Y., Imoto K., Mori Y. (2002) LTRPC2 Ca2+-permeable channel activated by changes in redox status confers susceptibility to cell death. Mol. Cell 9, 163–173 [DOI] [PubMed] [Google Scholar]
- 55. Takahashi N., Kozai D., Kobayashi R., Ebert M., Mori Y. (2011) Roles of TRPM2 in oxidative stress. Cell Calcium 50, 279–287 [DOI] [PubMed] [Google Scholar]
- 56. Sano Y., Inamura K., Miyake A., Mochizuki S., Yokoi H., Matsushime H., Furuichi K. (2001) Immunocyte Ca2+ influx system mediated by LTRPC2. Science 293, 1327–1330 [DOI] [PubMed] [Google Scholar]
- 57. Miller B. A., Zhang W. (2011) TRP channels as mediators of oxidative stress. Adv. Exp. Med. Biol. 704, 531–544 [DOI] [PubMed] [Google Scholar]
- 58. Miller B. A. (2012) TRPM2 function and potential as a drug target. In Methods in Pharmacology and Toxicology, Volume I, pp. 89–102, Springer-Verlag New York Inc., New York [Google Scholar]