Abstract
UDP-glucuronosyltransferase (UGT) 1A1-catalyzed glucuronidation is an important elimination pathway of flavonoids, and mutually inhibitory interactions may occur when two or more flavonoids are co-administered. Our recent research suggested that glucuronidation of flavonoids displayed distinct positional preferences, but whether this will lead to the mutually regioselective inhibition of UGT1A1-mediated glucuronidation of flavonoids is unknown. Therefore, we chose three monohydroxyflavone isomers 3-hydroxyflavone (3HF), 7-hydroxyflavone (7HF), 4′-hydroxyflavone (4′HF) and one trihydroxyflavone 3,7,4′-trihydroxyflavone (3,7,4′THF) as the model compounds to characterize the possible mutually regioselective inhibition of glucuronidation using expressed human UGT1A1. Apparent kinetic parameters [e.g., reaction velocity (V), Michaelis-Menten constant (Km), maximum rate of metabolism (Vmax), concentration at which inhibitor achieve 50% inhibition or IC50] and the Lineweaver-Burk plots were used to evaluate the apparent kinetic mechanisms of inhibition of glucuronidation. The results showed that UGT1A1-mediated glucuronidation of three monohydroxyflavones (i.e., 3HF, 7HF and 4′HF) and 3,7,4′THF was mutually inhibitory, and the mechanisms of inhibition appeared to be the mixed-typed inhibition. Specifically, the inhibitory effects displayed certain positional preference. Glucuronidation of 3HF was more easily inhibited by 3,7,4′THF than that of 7HF or 4′HF. Compared to 7-O-glucuronidation of 3,7,4′THF, 3-O-glucuronidation of 3,7,4′THF was more inhibited by 3HF and 4′HF, whereas glucuronidation at both 3-OH and 7-OH positions of 3,7,4′THF was more easily inhibited by 7HF than by 3HF and 4′HF. In conclusion, 3HF, 7HF, 4′HF and 3,7,4′THF were both substrates and inhibitors of UGT1A1, and they exhibited mutually regioselective inhibition of UGT1A1-mediated glucuronidation via a mixed-type inhibitory mechanism.
Keywords: flavonoids, glucuronidation, inhibition, regioselective, UGT1A1
INTRODUCTION
Flavonoids, a class of polyphenolic compounds widely distributed in a variety of plants and foods in nature, are known to have significant biological activities including: anti-cancer,1 antioxidant,2 anti-allergic, anti-inflammatory,3,4 anti-microbial,5 and anti-diarrheal.6 These biological activities make flavonoids attractive targets for further development into agents useful in the prevention and treatment of cancer, cardiovascular diseases and other age-related illnesses.7 However, rapid and extensive glucuronidation of flavonoids in intestine and liver means that much phase II conjugates (i.e., glucuronides) and little parent compound are present in the systemic circulation.8 As a consequence, flavonoids exhibit poor oral bioavailability in humans and animals, which limit their uses as drug development candidates.9,10
UDP-glucuronosyltransferases (UGTs) catalyzed-glucuronidation is a major metabolic pathway of many xenobiotics (e.g., flavonoids and drug) and endogenous substances (e.g., bilirubin and estradiol), and is thought to account for approximately 35% of phase II metabolism.11 Human UGTs are classified into four families: UGT1, UGT2, UGT3 and UGT8.12 UGT1A subfamily (except UGT1A4 and 1A6) is primarily responsible for glucuronidation of flavonoids and other polyphenols.13,14 Among the UGT1A subfamily, UGT1A1 also plays an important role in the glucuronidation of the endogenous substances and xenobiotics, and therefore is perhaps the most significant UGT isoform for maintaining human health. In addition to its ability to catalyze the glucuronidation of many xenobiotics including therapeutic drugs (e.g., acetaminophen, buprenorphine, carvedilol, mycophenolic acid, naltrexone, raltegravir and troglitazone),9 UGT1A1 also catalyzes the glucuronidation of certain endogenous substances (e.g., bilirubin).15 Inhibition of UGT1A1-mediated glucuronidation by the co-administration of some drugs is related to the drug-induced toxicities.16 Xenobiotics (e.g., atazanavir and indinavir) that inhibit UGT1A1 can reduce bilirubin glucuronidation capacity and increase bilirubin levels in the circulation, resulting in hepatic toxicities (e.g., jaundice and hyperbilirubinemia).17 For example, Zhang et al reported that a direct inhibition of UGT1A1-mediated glucuronidation of bilirubin is associated with co-administration of atazanavir and indinavir. 18
UGT1A1 also plays an important role in the glucuronidation of flavonoids. Many flavonoids, for example, 3,7-dihydroxyflavone (resogalangin), 5,7-dihydroxyflavone (chrysin), 5,4′-dihydroxyflavone, 7,4′-dihydroxyflavone, 3,5,4′-trihydroxyflavone, 3,5,7-trihydroxyflavone (galangin), 3,7,4′-trihydroxylflavone (resokaempferol), 5,7,4′-trihydroxyflavone (apigenin) and 3,5,7,4′-tetrahydroxyflavone (kaempferol) are predominantly metabolized by UGT1A1. Moreover, some of these flavonoids can also inhibit UGT1A1-mediated glucuronidation.19,20 As substrates and/or inhibitors of UGT1A1, co-administration of flavonoids could possibly results in the potential metabolic interactions based on the UGT1A1-mediated glucuronidation.
Flavonoids possessing one or multiple phenolic (-OH) groups undergo O-glucuronidation at various positions when they are metabolized by UGTs isoforms. Some of them displayed strong regioselectivity. Regioselectivity refers to the preference for the formation of one glucuronide isomer over another when a substrate of UGTs possesses more than one possible glucuronidation sites.21 Elucidation of regioselectivity would facilitate the understanding of UGTs-substrates interaction with respect to binding properties.22 Recent reports19,23 indicated that UGT1A isoforms displayed distinct positional preferences and can regioselectively glucuronidate the 3-O, 7-O and 4′-O positions in selected monohydroxyflavones and flavonols, but the 5-O position was not favored at either 2.5 μM or 10 μM concentration of the substrates. In dihydroxyflavones, UGT1A1 exhibited dominant positional preference for the 7-O position when 5,7-dihydroxyflavone was used and for the 4′-O position when 5,4′-dihydroxyflavone was used, either at 2.5 μM or 10 μM concentration.
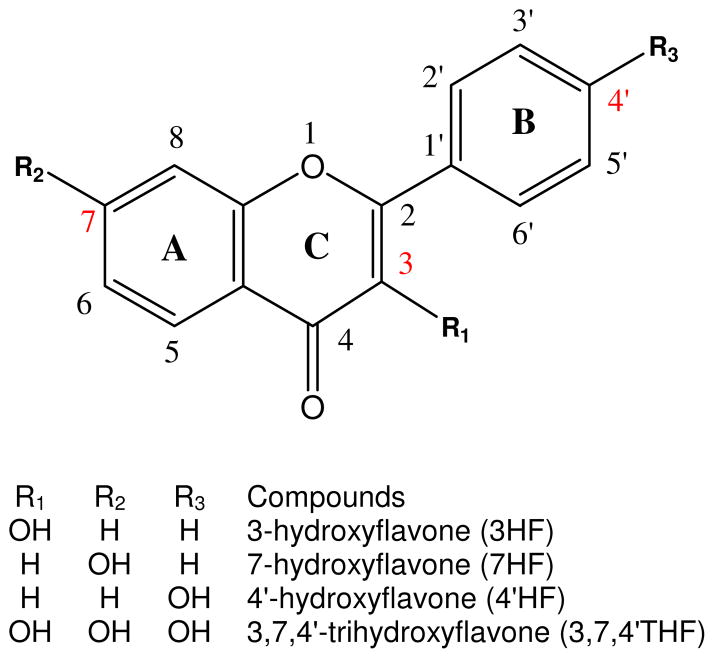
Zhang et al proposed that inhibitory interactions of glucuronidation can occur when glucuronidation is a predominant metabolic elimination pathway catalyzed by a single UGT isoform, and concentration of the inhibitor is close to inhibition constant (Ki) of the target UGT(s). 24 Since glucuronidation of many flavonoids display regioselectivity, we determined the potential for mutually regioselective inhibition during their glucuronidation process. In addition, we determined the kinetics and mechanisms of inhibition, when these flavonoids were co-incubated with selected UGT enzyme isoform (e.g., UGT1A1). Accordingly, we choose three monohydroxyflavone (MHF) isomers 3-hydroxyflavone (3HF), 7-hydroxyflavone (7HF), 4′-hydroxy-flavone (4′HF) and one trihydroxyflavone (THF) 3,7,4′-trihydroxyflavone (3,7,4′THF) as the model compounds (Figure 1) and investigate how co-incubation of these flavonoids affected the activities of human UGT1A1. Potential mutual regioselective inhibition of glucuronidation of these flavonoids were determined with respect to their molecular structure (i.e., site and number of hydroxyl group).19,23 Specifically, we investigated whether 3-OH site of 3HF, 7-OH site of 7HF and 4′-OH site of 4′HF can regioselectively inhibit glucuronidation of the corresponding 3-OH, 7-OH, 4′-OH site of 3,7,4′THF, respectively, and if so what the differences are with respect to apparent inhibitory kinetics and mechanisms. Although regioselective glucuronidation of flavonoids by UGTs isoforms had been reported,3,6,15,19,23 regioselective inhibition of glucuronidation of flavonoids was studied here for the first time. The study will provide important insights into the enzyme-substrate-inhibitor interactions, as well as to predict the in vitro UGT1A1-mediated metabolic interactions of flavonoids in tissue microsomes, both of which are important first step in the prediction of their in vivo drug metabolism via glucuronidation.
Figure 1.
Chemical structures of the model flavonoids. Shown in the scheme are structures of aglycone forms of hydroxyflavone analogues. Glucuronidated metabolites may be formed at the 3-OH, 7-OH, 4′-OH sites on the C, A and B ring, respectively.
MATERIALS AND METHODS
Materials
3-Hydroxyflavone (3HF), 7-hydroxyflavone (7HF), 4′-hydroxyflavone (4′HF) and 3,7,4′-trihydroxyflavone (3,7,4′THF) (structures in Fig. 1) were purchased from Indofine Chemicals (Somerville, NJ). Human UGT1A1 Supersomes™ was purchased from BD Biosciences (Woburn, MA). Uridine diphosphoglucuronic acid (UDPGA), alamethicin, D-saccharic-1,4-lactone monohydrate, and magnesium chloride were purchased from Sigma-Aldrich (St Louis, MO). Ammonium acetate was purchased from J.T. Baker (Phillipsburg, NT). All other materials (analytical grade or better) were used as received.
Glucuronidation Kinetics
Before the inhibition studies, kinetic parameters of glucuronidation of 3HF, 7HF, 4′HF and 3,7,4′THF by human UGT1A1:Michaelis-Menten constant (Km), maximum rate of metabolism (Vmax), and relevant parameters (e.g., substrate inhibition constant, Ksi), were determined by measuring the initial glucuronidation rates of a model flavonoid at a series of seven concentrations. The experimental procedures were essentially the same as our previous publications.19,23,25 Briefly, the incubation procedures were as follows: (1) expressed human UGT1A1 Supersomes™ (final concentration in range of 26.5~53.0 μg of protein/mL as optimum for the reaction), magnesium chloride (0.88 mM), saccharolactone (4.4 mM), alamethicin (0.022 mg/mL), 3,7,4′THF (final concentrations 0, 0.156, 0.313, 0.625, 1.25, 2.5, 5, 10 μM) or one of the three MHFs (3HF, 7HF, or 4′HF) (final concentrations 0, 0.625, 1.25, 2.5, 5, 10, 20, 40 μM) in a 50 mM potassium phosphate buffer (pH 7.4), and UDPGA (3.5 mM, added last) were mixed; (2) The mixture (final volume 200 μL) was incubated at 37°C for a predetermined period of time (15~120 min); (3) The reaction was terminated by the addition of 50 μL of 94% acetonitrile/6% glacial acetic acid. Glucuronidation rates were calculated as nanomoles of glucuronide(s) formed per mg Supersomes™ protein amount per reaction time (or nmol/mg protein/min). All experiments were performed in triplicates.
Mutual Glucuronidation Inhibition
Based on the determined Km values of glucuronidation of 3HF, 7HF, 4′HF and 3,7,4′THF, mutual inhibition of UGT1A1-mediated glucuronidation of the four flavonoids was examined at a series of concentrations of the substrates and inhibitors surrounding the Km values. The experimental procedure was the same as the above mentioned “Glucuronidation Kinetics”, except that the substrate and inhibitor were added into the reaction mixture at the same time. The control incubations were carried out by using only one flavonoid. The combination of mutual inhibition experiments were detailed in Table 1.
Table 1.
Test Conditions for Mutual Inhibition Experiments with Respect to the Glucuronidation of 3HF, 7HF, 4′HF and 3,7,4′THF
| Substrate | Inhibitor | UGT1A1 (μg/ml) | Reaction time (min) | ||
|---|---|---|---|---|---|
|
| |||||
| Name | Concentration(μM) | Name | Concentration (μM) | ||
| 3HF | |||||
| 7HF | 0.625, 2.5, 5, 10 | 3,7,4′THF | 0, 0.313, 0.625, 1.25, 5 | 26.54 | 30~120 |
| 4′HF | |||||
| 3HF | |||||
| 3,7,4′THF | 0.313, 0.625,1.25,5 | 7HF | 0, 0.625, 2.5, 5, 10 | 6.62~26.54 | 15~60 |
| 4′HF | |||||
UPLC Analysis of Flavonoids and Their Glucuronides
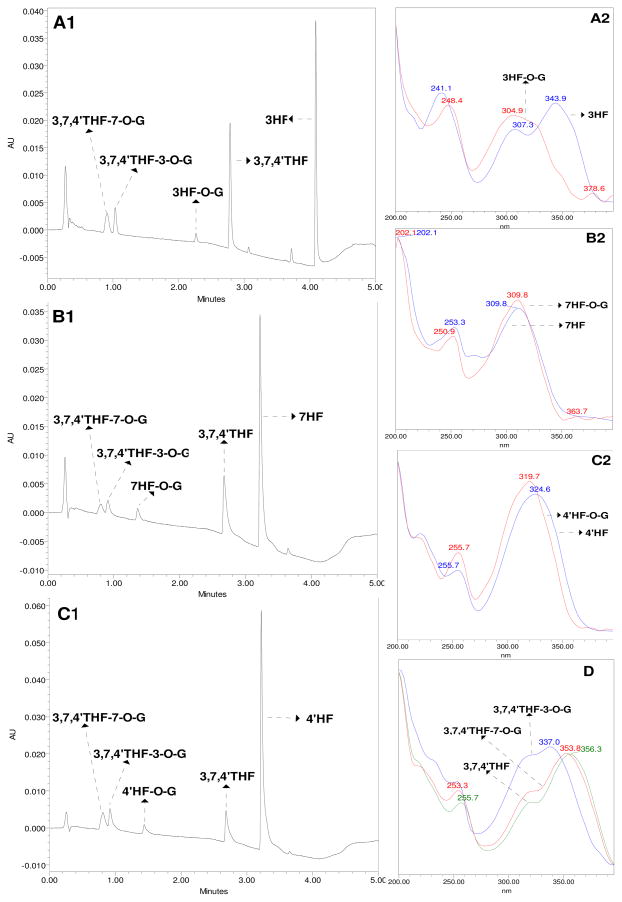
Waters ACQUITY™ UPLC system (UPLC with photodiode array detector and Empower software) was used to analyze the four flavonoids and their glucuronide(s). The UPLC method was essentially the same as our previous publication19,25 with slight modifications. Briefly, the flavonoids and their glucuronides were separated on a Waters ACQUITY®BEH C18 column (2.1 mm×50 mm, 1.7 μm) with a Van Guard ™ Pre-columns (1.7 μm, Waters). Mobile phase A was 2.5 mM ammonium acetate (pH 6.5) in purified water, and mobile B was 100% acetonitrile. The run time was 5 min, at a flow rate of 0.45 ml/min with the predetermined gradient (0~2 min, 10–20% B; 2~3 min, 20–40% B; 3 ~3.5 min 40–50% B; 3.5~4 min, 50%–90% B; 4~4.5 min, 90% B; 4.5~5 min, 90%–10% B). The column temperature was 45°C. The injection volume was 10 μL. Quantitation of the glucuronides was based on the standard curve of the parent compounds and further calibrated using the conversion factor as described earlier.19,20 Representative chromatograms and their UV spectra were shown in Figure 2.
Figure 2.
Representative UPLC chromatograms (left) and UV spectra (right) of 3HF, 7HF, 4′HF, 3,7,4′THF and their glucuronides. A1, B1, C1 panels represent UPLC chromatograms of 3HF and 3,7,4′THF (λ=307 nm), 7HF and 3,7,4′THF (λ=310 nm), 4′HF and 3,7,4′THF (λ=324 nm), as well as their glucuronides from reaction media containing both flavaonoids, respectively. Correspond to the A1, B1 and C1, the A2, B2, C2 panels represent UV spectra of 3HF, 7HF, 4′HF and their glucuronides, respectively. D panel represents UV spectra of 3,7,4′THF and its glucuronides. A1, B1, C1 samples were from enzyme assays in which 3HF (10 μM), 7HF (5 μM), or 4′HF (5 μM) were incubated with UGT1A1 (26.54 μg/ml) in the presence of 3,7,4′THF (5 μM) for 60, 60, 120 min, respectively.
Kinetics Analysis
Apparent kinetic parameters [e.g., V (reaction velocity), Km, Vmax, Ksi and Ki] of glucuronidation of the four flavonoids were obtained by fitting the substrate concentrations and initial reaction rates to the enzyme kinetics equations (e.g., Michaelis-Menten, substrate inhibition or Hill equations) with a weighting of 1/y. According to the changes of apparent Km and Vmax for glucuronidation of the substrate in the absence or presence of an inhibitor, apparent mechanisms of inhibition (e.g., competitive or noncompetitive) of UGT1A1-mediated glucuronidation was determined using Lineweaver-Burk plots. Furthermore, types of inhibition were also determined by fitting kinetic data (substrate concentrations, inhibitor concentrations and initial rates) to four reversible inhibition models (i.e., competitive, noncompetitive, uncompetitive, mixed-type inhibition models) using nonlinear regression analysis, respectively.26,27 Goodness of the fitting was evaluated by comparing R2 (square of correlation coefficient) and AIC (Akaike information criterion) values.28,29 As a useful graphical tool, the Lineweaver-Burk (double-reciprocals) plots (1/V versus 1/[S]) were used to determine the type and mechanism of enzyme inhibition in the study. Kinetics of the mixed-type inhibition was described by the following equation (1)
| (1) |
In the current analysis, a decrease in the formation of the substrate glucuronide(s) was used to calculate IC50 (i.e., half maximal inhibitory concentration) values in the UGT1A1 inhibition assay. Concentration of the inhibitor that is required to produce 50% inhibition of the enzymatic activity was determined from the curves plotting enzymatic activity versus inhibitor concentrations. The apparent Ki was determined from the x-intercept of a replot of the mean slopes of the Lineweaver-Burk plots versus concentrations of the inhibitor.29 Finally, mechanism of the mutual inhibition of glucuronidation of flavonoids were systematically evaluated on the basis of the multiple kinetic parameters (V, Km, Vmax, Ksi, Ki and IC50) and the Lineweaver-Burk plots. Data analysis were performed by GraphPad Prism V5 for Windows (GraphPad Software, San Diego, CA).
Statistical Analysis
Statistical analyses were performed by two-way ANONA or one-way ANONA using GraphPad Prism V5 software for Windows (GraphPad Software, San Diego, CA). Differences were considered significant when p values were less than 0.05 (p < 0.05).
RESULTS
Confirmation of Structures of Flavonoid Glucuronides
Flavonoid glucuronides were confirmed using three independent methods in a sequential process as summarized in our earlier publication.19,20 First, glucuronides isolated from reaction mixture were confirmed by its complete hydrolysis to the aglycones when β-D-glucuronidase was used. Second, the glucuronides were identified as monoglucuronides which showed a mass of (aglycone’s mass + 176 Da) using UPLC-MS/MS. 176 Da is the mass of a glucuronic acid. The sites of glucuronidation were confirmed by λmax shifts in their characteristic UV absorption spectra. As shown in Figure 2, 3HF, 7HF and 4′HF were metabolized to 3HF-O-glucuronidation (3HF-O-G), 7HF-O-glucuronidation (7HF-O-G) and 4′HF-O-glucuronidation (4′HF-O-G) by human UGT1A1, respectively. 3,7,4′THF was only simultaneously metabolized to 3,7,4′THF-3-O-glucuronidation (3,7,4′THF-3-O-G) and 3,7,4′THF-7-O-glucuronidation 3,7,4′THF-7-O-G) by human UGT1A1. Glucuronidation at 3-OH group of 3HF resulted in the disappearance of UV λmax (343.9 nm) in band I (300–380 nm) and a 7.3 nm bathochromic shift (a longer wavelength shift from 241.1 nm to 248.4 nm) in band II (240–280 nm). Glucuronidation of 7-OH group of 7HF had no effect on the band I λmax (309.8 nm) and caused a 2.4 nm hypsochromic shift (a shorter wavelength shift from 253.3 nm to 250.9 nm) in band II λmax. Glucuronidation of 4′-OH group of 4′HF resulted in a 4.9 nm hypsochromic shift (a shorter wavelength shift from 324.6 nm to 319.7 nm) in band I λmax and had no effect on the band II λmax (255.7 nm). Glucuronidation at 3-OH or 7-OH group of 3,7,4′THF resulted in two hypsochromic shifts (a shorter wavelength shift from 356.3 nm to 337 nm for 3,7,4′THF-3-O-G, and from 356.3 nm to 353.8 nm for 3,7,4′THF-7-O-G) in band I λmax, respectively. Essentially, the retention time, relative peak position and UV spectra of 3,7,4′THF, 3,7,4′THF-3-O-G, and 3,7,4′THF-7-O-G in Figure 2 were the same as those in the published papers. 19,20 In addition, 3,7,4′THF-4′-O-G was not detected in the reaction mixtures, so it was not chosen as a marker of 3,7,4′THF glucuronidation activities in this study.
Glucuronidation Kinetics of 3HF, 7HF 4′HF and 3,7,4′THF
Inhibition of UGT1A1-mediated glucuronidation of flavonoids is often characterized using IC50 values. IC50 values depend on the conditions under which they are measured. For example, concentrations of the substrate and enzyme will have an effect. Besides the appropriate concentration of enzyme, it is very important that concentrations of the substrates are equal to or near to Km values. In order to reliably determine inhibitory effect of glucuronidation and accurately calculate IC50 values, it was necessary to calculate their Km values before the inhibition kinetics test. Assay of glucuronidation of the four flavonoids are described under the Glucuronidation Kinetics. The apparent enzyme kinetic parameters and profiles of glucuronidation of four flavonoids were shown in Table 2 and Figure S1, respectively. The Km values of 3HF-O-G, 7HF-O-G, 4′ HF-O-G, 3,7,4′THF-3-O-G and 3,7,4′THF-7-O-G formation were 1.46±0.24 μM, 1.89± 0.13 μM, 2.24±0.11 μM, 1.09±0.32 μM, 1.30±0.56 μM, respectively.
Table 2.
Apparent Enzyme Kinetic Parameters of Glucuronidation of 3HF, 7HF, 4′HF and 3,7,4′ THF (Average ± SD, n=3). Seven different concentrations of flavonoids were used to derive the kinetic parameters.
| 3HF-O-G | 7HF-O-G | 4′HF-O-G | 3,7,4′THF-3-O-G | 3,7,4′THF-7-O-G | |
|---|---|---|---|---|---|
| Km (μM) | 1.46±0.24 | 1.89±0.13 | 2.24±0.11 | 1.09±0.32 | 1.30±0.56 |
| Vmax (nmol/mg/min) | 1.74±0.03 | 1.34±0.02 | 0.85±0.01 | 3.87±0.84 | 3.55±1.11 |
| Ksi (μM) | -- | -- | -- | 0.86±0.25 | 1.26±0.54 |
For inhibition studies conducted below, we chose four substrate/inhibitor concentrations (i.e., 0.625, 2.5, 5, 10 μM for 3HF, 7HF, 4′ HF; 0.313, 0.625, 1.25, 5 μM for 3,7,4′THF).
These four substrate/inhibitor concentrations encompass the above Km values of glucuronidation of four flavonoids (i.e., some concentrations were lower than whereas others were higher than the Km values).
Rates of Glucuronidation of 3HF, 7HF and 4′HF in the Absence or Presence of 3,7,4′THF
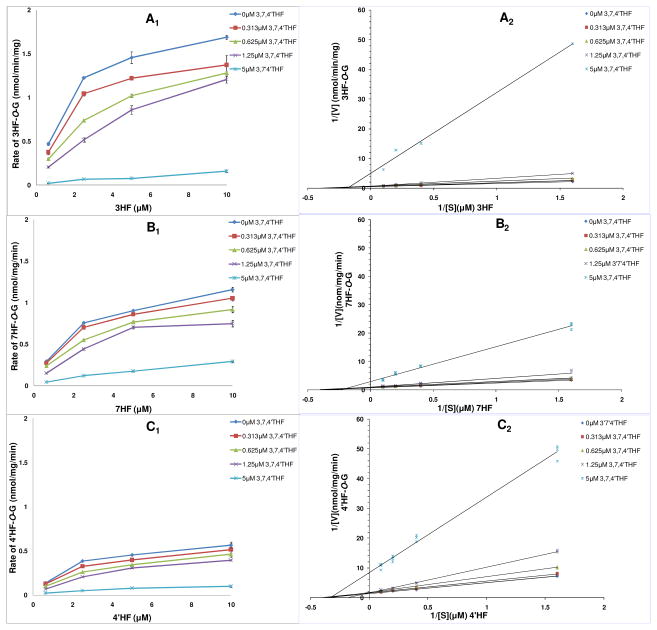
As shown in Figure 3, rank order of average glucuronidation rates of three MHFs was: 3HF > 7HF > 4′HF (p < 0.05) in the absence of 3,7,4′THF. Glucuronidation rates of the 3-OH site was the fastest, whereas glucuronidation rates of the 4′-OH site was the slowest at the tested concentrations. Compared to the control group (in the absence of 3,7,4′THF), glucuronidation rates of 3HF, 7HF and 4′HF decreased in the presence of 3,7,4′THF. Moreover, their average glucuronidation rates further decreased with an increasing concentration of 3,7,4′THF. Average glucuronidation rates of 3HF, 7HF and 4′HF showed a rank order of 3HF > 7HF > 4′HF (p < 0.05) in the presence of 0.313, 0.625, 1.25 μM 3,7,4′THF, but a rank order of 7HF > 3HF > 4′HF (p < 0.05) in the presence of 5 μM 3,7,4′THF. The extents of glucuronidation inhibition (i.e., % inhibition) of 3HF, 7HF and 4′HF showed a rank order of 3HF > 4′HF > 7HF (p < 0.05) in the presence of 0.313~5 μM 3,7,4′THF. Compared to glucuronidation rates of the control group (in the absence of 3,7,4′THF), rates of glucuronidation of 3HF, 7HF and 4′HF were inhibited 93.9±2.2%, 81.1±4.5% and 84.4±2.0% in the presence of 5 μM 3,7,4′THF, respectively.
Figure 3.
Kinetics profiles (left) and Lineweaver-Burk (double-reciprocal) plots (1/V versus 1/[S]) (right) of UGT1A1-mediated glucuronidation of 3HF (A, 3HF-O-G), 7HF (B, 7HF-O-G) and 4′HF (C, 4′HF-O-G) in the presence of different concentrations of 3,7,4′THF, respectively. Concentrations of the substrate 3HF, 7HF, 4′HF were 0.625, 2.5, 5 and 10 μM. Concentrations of the inhibitor 3,7,4′THF were 0, 0.313, 0.625, 1.25 and 5 μM. Each data point represents the average of three determinations. The corresponding ampliative Lineweaver-Burk plots at lower 3,7,4′THF concentrations (0, 0.313, 0.625, 1.25 μM) see Figure S2 (SI). Each plot represents the mean of duplicate measurements.
Inhibition of Glucuronidation of 3HF, 7HF and 4′HF by 3,7,4′THF
Apparent kinetic parameters (Km and Vmax) of glucuronidation of 3HF, 7HF and 4′HF in the presence of 0~5 μM 3,7,4′THF were shown in Table 3. According to the criteria of R2 (near 1.0) and AIC (minimum), glucuronidation of 3HF, 7HF and 4′HF was best fit to the Michaelis-Menten kinetics in the absence of 3,7,4′THF. Compared to the control group (in the absence of 3,7,4′THF), apparent Km values increased up to 11.5, 5.2, 1.8 times and apparent Vmax values decreased down to 4.6, 2.4, 5.0 times for glucuronidation of 3HF, 7HF and 4′HF in the presence of increasing concentrations of 3,7,4′THF (for up to 5 μM), respectively. Furthermore, in the presence of 0~5 μM 3,7,4′THF, average apparent Km values of glucuronidation of 3HF, 7HF and 4′HF showed no significant difference (p > 0.05), but average apparent Vmax values exhibited significant differences 3HF ≈ 7HF > 4′HF (p < 0.05).
Table 3.
Estimated Apparent Enzyme Kinetic Parameters of Glucuronidation of 3HF,7HF and 4′HF in the Absence or the Presence of 3,7,4′THF (n=3, x̄ ± SD)
| Glucuronides
|
3,7,4′THF (μM) | 0 | 0.313 | 0.625 | 1.25 | 5 |
|---|---|---|---|---|---|---|
| 3HF-O-G | Km (μM) | 1.59±0.16 | 1.69±0.25 | 3.11±0.13 | 7.04±0.82 | 18.3±3.7 |
| Vmax (nmol/mg/min) | 2.00±0.05 | 1.63±0.07 | 1.67±0.03 | 2.05±0.13 | 0.44±0.16 | |
| 7HF-O-G | Km (μM) | 2.05±0.22 | 2.19±0.14 | 2.62±0.17 | 2.73±0.51 | 10.7±2.0 |
| Vmax (nmol/mg/min) | 1.40±0.05 | 1.27±0.03 | 1.16±0.03 | 0.99±0.07 | 0.59±0.07 | |
| 4′HF-O-G | Km (μM) | 2.19±0.24 | 2.59±0.24 | 3.51±0.27 | 4.53±0.22 | 3.95±0.64 |
| Vmax (nmol/mg/min) | 0.68±0.02 | 0.63±0.02 | 0.61±0.02 | 0.58±0.01 | 0.14±0.01 |
Kinetics analysis were performed using the classical Michaelis-Menten equation. Four different concentrations of each flavonoid were used for the determination of estimated kinetic parameters. Notice, in the absence of inhibitors, the kinetic parameters presented in this table was different from those presented in Table, but the difference never exceeded 20%.
Types of Inhibition of UGT1A1-Mediated Glucuronidation of 3HF, 7HF and 4′HF by 3,7,4′THF
According to the criteria of R2 (near 1.0) and AIC (minimum) of selecting the best fit kinetic parameters, inhibition of UGT1A1-mediated glucuronidation of 3HF, 7HF and 4′HF in the presence of 0.313~5 μM 3,7,4′THF was best fit to the mixed-type inhibition (Table S1, SI). These results were consistent with the use of the Lineweaver-Burk (double reciprocal) plots, used to determine the apparent mechanism or type of UGT1A1 inhibition in the study (Figure 3), where both the slopes and the y-intercepts increased with increasing concentrations of 3,7,4′THF (for up to 5 μM), consistent with characteristics of the mixed-type inhibition.26 Ki values of 3,7,4′THF were found to be 0.51±0.15 μM (for 3HF), 1.29±0.33 μM (for 7HF) and 0.87±0.21 μM (for 4′HF), respectively. These relatively small Ki values means that 3,7,4′THF exhibited a potent inhibitory effect on UGT1A1-mediated glucuronidation of 3HF, 7HF and 4′HF.
IC50 Values of 3,7,4′THF as the Inhibitor of Glucuronidation of 3HF,7HF and 4′HF
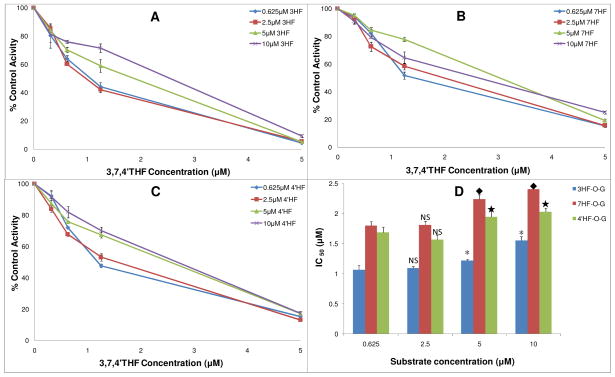
IC50 values of 3,7,4′THF on UGT1A1-mediated glucuronidation of 3HF,7HF and 4′HF were determined using the rates versus concentration plots (Figure 4) and found to be in the range 1.1–2.4 μM (Table S3, SI). Average IC50 values of 3,7,4′THF on glucuronidation of 3HF, 7HF and 4′HF with respect to different concentrations of the substrate demonstrated a significant difference between three MHFs with the highest IC50 values (or lowest inhibition) against 7HF (IC50 7HF > 4′HF > 3HF, p < 0.05).
Figure 4.
Concentration-dependent inhibitory effects (IC50) of 3,7,4′THF on UGT1A1- mediated glucuronidation of 3HF, 7HF and 4′HF. A, B, C were inhibition (IC50) profiles of 3,7,4′THF on 3HF-O-G, 7HF-O-G and 4′HF-O-G formation at different concentrations of the substrates 3HF, 7HF and 4′HF, respectively. The IC50 values are expressed as percentages relative to the control, which was determined in the absence of 3,7,4′THF. D was the corresponding column plot summarizing the resulting IC50 values. *, ◆, ★, Significantly different (p < 0.05) from IC50 values at 0.625 μM concentration of the substrates 3HF, 7HF and 4′HF, when compared to those at 2.5, 5, or 10 μM substrate concentrations, respectively. IC50 values showed no significant difference between 0.625 μM to 2.5 μM of the substrate concentrations. Concentrations of the substrate 3HF, 7HF and 4′HF were 0.625, 2.5, 5 and 10 μM, respectively. Concentrations of the inhibitor 3,7,4′THF were 0, 0.313, 0.625, 1.25, 5 μM. Each data point represents the average of three determinations.
Glucuronidation Rates of 3,7,4′THF in the Absence or the Presence of 3HF,7HF and 4′HF
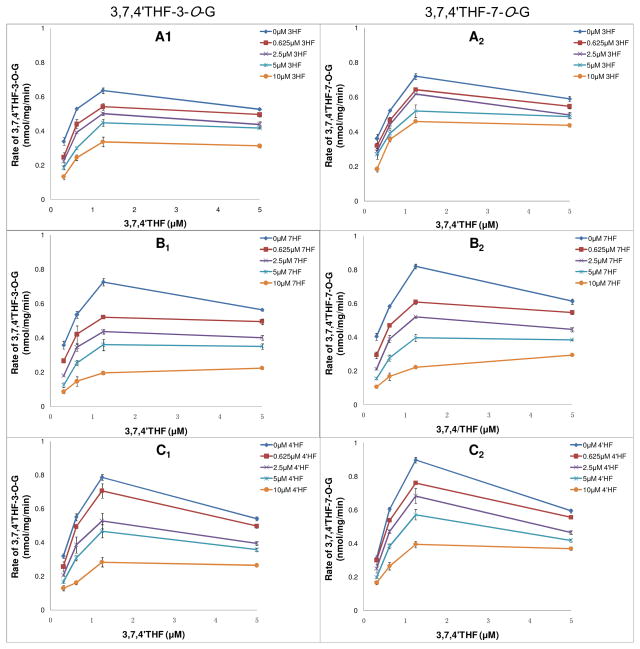
As shown in Figure 5, average formation rate of 3,7,4′THF-7-O-G was faster than 3,7,4′THF-3-O-G (p < 0.05), displaying certain regional selectivity with respect to the rates of glucuronidation, regardless if 3HF, 7HF or 4′HF was present. However, formation rates of 3,7,4′THF-3-O-G and 3,7,4′THF-7-O-G decreased in the presence of 0.625~10 μM 3HF, 4′HF and 7HF. In addition, formation rates of 3,7,4′THF-3-O-G and 3,7,4′THF-7-O-G displayed substrate inhibition kinetics, and reaction at higher concentration was dually inhibited by the MHFs (i.e., 3HF, 7HF or 4′HF) and substrate itself.
Figure 5.
Kinetics profiles of UGT1A1-mediated glucuronidation of 3,7,4′THF in the presence of different concentrations of 3HF, 7HF and 4′HF, respectively. A1, B1, C1 were the kinetics profiles of 3,7,4′THF-3-O-G formation in the presence of different concentrations of 3HF, 7HF and 4′HF, respectively. A2, B2, C2 were the kinetics profiles of 3,7,4′THF-7-O-G formation in the presence of different concentrations of 3HF, 7HF and 4′HF, respectively. Concentrations of the substrate 3,7,4′THF were 0.313, 0.625, 1.25, 5 μM. Concentrations of the inhibitor 3HF, 7HF and 4′HF were 0, 0.625, 2.5, 5, 10 μM, respectively. Each data point represents the average of three determinations.
Influence of 3HF, 7HF and 4′HF on glucuronide formation rates of 3-O and 7-O sites of 3,7,4′THF showed the same trend. Moreover, average glucuronide formation rates of 3-O and 7-O sites of 3,7,4′THF were both the slowest in the presence of 0.625~10 μM 7HF than that of 3HF and 4′HF at the same concentration.
Inhibition of Glucuronidation of 3,7,4′THF in the Presence of 3HF, 7HF and 4′HF
According to the criteria of R2 (near 1.0) and AIC (minimum), glucuronidation rates of 3,7,4′THF (3,7,4′THF-3-O-G and 3,7,4′THF-7-O-G) was best fitted to the substrate inhibition kinetics in the absence of 3HF,7HF and 4′HF, which was characterized by small Ksi values (0.86±0.25 μM for 3,7,4′THF-3-O-G and 1.26±0.54 μM for 3,7,4′THF-7-O-G) of 3,7,4′THF, respectively. Generally speaking, apparent kinetic parameters (Km, Vmax and Ksi) of glucuronidation of 3,7,4′THF demonstrated no obvious trend in the presence of increasing concentrations of relevant inhibitors 3HF,7HF or 4′HF (data not shown).
Types of Inhibition of UGT1A1-Mediated Glucuronidation of 3,7,4′THF by 3HF, 7HF and 4′HF
According to the criteria of R2 (near 1.0) and AIC (minimum), kinetics of inhibition of UGT1A1-mediated glucuronidation of 3,7,4′THF (3,7,4′THF-3-O-G and 3,7,4′THF-7-O-G) in the presence of 3HF, 7HF and 4′HF was best fit to the mixed-type inhibition (Table S2, SI). Ki values of 3HF-, 7HF-, 4′HF-mediated inhibition of 3,7,4′THF-3-O-G and 3,7,4′THF-7-O-G formation were 4.14±1.24 μM, 1.77±0.72 μM, 3.66±0.77μM and 9.04±2.72 μM, 4.33±1.60 μM, 6.22±1.74 μM, respectively. Most of these Ki values were much larger than Ki values displayed by 3,7,4′THF on its inhibition of glucuronidation of 3HF, 7HF or 4′HF.
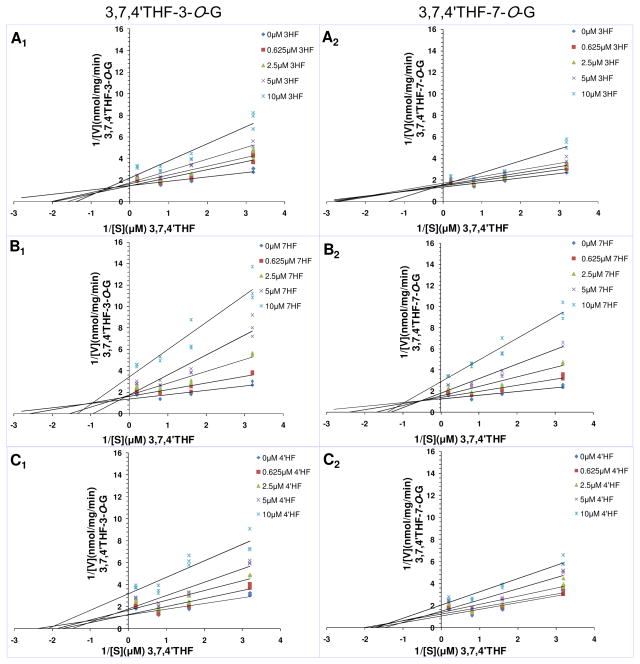
Consistent with fitting analyses, the Lineweaver-Burk plots shown in Figure 6 also showed that the slopes and the y-intercepts increased along with increasing concentrations of the inhibitor 3HF,7HF and 4′HF in the lines, which was consistent with characteristics of the mixed-type inhibition. 26 Thus, it can be speculated that inhibition kinetics of UGT1A1-mediated glucuronidation of 3,7,4′THF by 3HF, 7HF and 4′HF obeyed the mixed-type inhibition, and hence 3HF, 7HF and 4′HF were mixed-type inhibitors of UGT1A1.
Figure 6.
The Lineweaver-Burk (double-reciprocal) plots (1/V versus 1/[S]) of glucuronidation of 3,7,4′THF in the presence of different concentrations of 3HF, 7HF and 4′HF, respectively. A1, B1, C1 and A2, B2, C2 were the Lineweaver-Burk plots of 3,7,4′THF-3-O-G and 3,7,4′THF-7-O-G formation in the presence of different concentrations of 3HF, 7HF and 4′HF, respectively. Concentrations of the substrate 3,7,4′THF were 0.313, 0.625, 1.25, 5 μM, respectively. Concentrations of the inhibitor 3HF, 7HF and 4′HF were 0, 0.625, 2.5, 5, 10 μM. Each plot represents the mean of duplicate measurements.
IC50 Values of MHF-mediated Inhibition of Glucuronidation of 3,7,4′THF
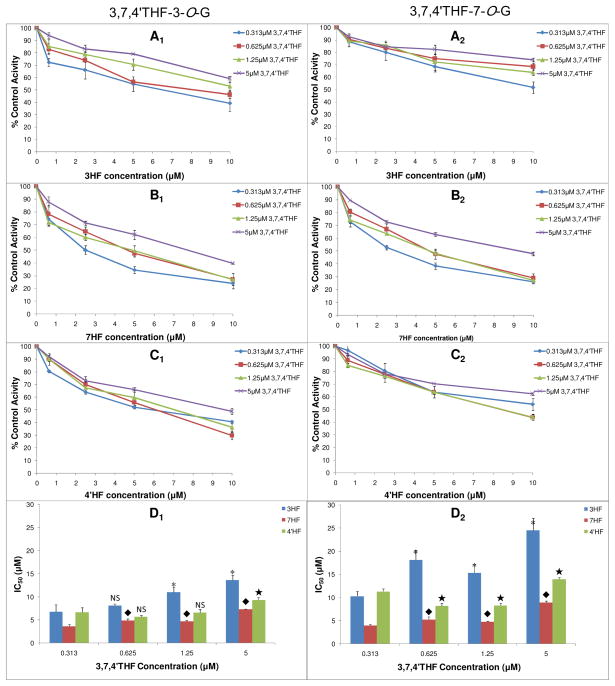
IC50 values of 3HF, 7HF and 4′HF on UGT1A1-mediated glucuronidation of 3,7,4′THF ranged from 3.61±0.41 μM to 24.5±2.7 μM at different concentrations of the substrate (Figure 7, and Table S4 in SI). Average IC50 values of 3HF, 7HF and 4′HF demonstrated a significant difference (p < 0.05) with respect to different concentrations of the substrate. Average IC50 values showed a rank order 3HF > 4′HF > 7HF (p < 0.05), regardless of position of glucuronidation. This means that 7HF exhibited stronger inhibitory effect on glucuronidation of 3,7,4′THF than that of 3HF and 4′HF, whereas 3HF exhibited the weakest inhibitory effect among the three inhibitors. Although inhibitory effect of 7HF on glucuronidation of 3,7,4′THF was strong, it did not display any positional difference (p > 0.05). Inhibitory effect of 3HF and 4′HF on 3-O site glucuronidation of 3,7,4′THF was stronger than on 7-O site of 3,7,4′THF. In another word, compared to the 7-O site of 3,7,4′THF, glucuronidation at 3-O site of 3,7,4′THF was more easily inhibited by 3HF and 4′HF.
Figure 7.
Concentration-dependent inhibitory effects (IC50) of 3HF, 7HF and 4′HF on UGT1A1-mediated glucuronidation of 3,7,4′THF. A1, B1, C1 were the inhibition (IC50) profile of 3HF, 7HF and 4′HF on 3,7,4′THF-3-O-G formation at different substrate concentrations, respectively. A2, B2, C2 were the inhibition (IC50) profile of 3HF, 7HF and 4′HF on 3,7,4′THF-7-O-G formation at different substrate concentrations, respectively. The values are expressed as percentages relative to the control, which was determined in the absence of 3HF, 7HF and 4′HF. D1 and D2 were the corresponding column plots summarizing the resultant IC50 values. *, ◆, ★, Significant difference (p < 0.05) from IC50 value at 0.313 μM 3,7,4′THF concentration, when compared to those at 0.625, 1.25, or 5 μM substrate concentrations, respectively. IC50 values of 3HF showed no significant difference between 0.313 μM and 0.625 μM substrate concentration (formation of 3,7,4′THF-3-O-G). IC50 values of 4′HF showed no significant difference between 0.313 μM and 1.25 μM substrate concentration (formation of 3,7,4′THF-3-O-G). Concentrations of the substrate 3,7,4′THF were 0.313, 0.625, 1.25, 5 μM. Concentrations of the inhibitor 3HF,7HF and 4′HF were 0, 0.625, 2.5, 5, 10 μM, respectively. Each data point represents the average of three determinations.
DISCUSSION
We have shown, for the first time, that flavonoids are mixed-type inhibitors of human UGT1A1 and that position of the phenolic group had a significant impact on the IC50 values of mutually inhibitory interactions. Specifically, 7HF appears to have a strong affinity for UGT1A1 and acted as the strongest inhibitor of 3,7,4′THF glucuronidation, regardless if the position of the glucuronidation is 3-O or 7-O glucuronidation. In contrast, 3HF, which has strong affinity to UGT1A9, 22 appears to have the weakest affinity to UGT1A1, in that it was the weakest inhibitor of 3,7,4′THF glucuronidation regardless of the position of the glucuronidation. Interestingly, 3,7,4′THF had the lowest IC50 against 3HF glucuronidation, and highest against 7HF glucuronidation, consistent with what was discussed above. In addition, 3,7,4′THF was a better inhibitor of UGT1A1 since it displayed much lower IC50 values (< 2.5 μM) against the glucuronidation of 3 MHFs than these three MHFs against 3,7,4′THF (IC50 values >5 μM most of the time). The latter is consistent with substrate inhibition pattern displayed by 3,7,4′THF in the absence of three MHFs, with Ki values of approximately 1 μM. This is a rather novel finding since previous reports have seldom investigated the impact of flavonoids on the metabolism of other UGT substrates,30,31 and none has determine the mechanisms of inhibition.
Similar to what we have observed previously, this study also showed that structure (e.g., position and number of hydroxyl) of flavonoids significantly affect their rates of glucuronidation. Glucuronidation rates of three MHFs demonstrated the following rank order in glucuronidation: 3-OH > 7-OH > 4′-OH, but this did not translate straight into the glucuronidation of 3,7,4′THF, which showed no significant difference (p > 0.05) between 3-OH and 7-OH sites, but no glucuronidation at the 4′ site. It is consistent with the report that 4′-OH group is typically inactive for UGT1A-mediated glucuronidation when 3-OH or 7-OH group is also presented in the structure.25
Taken together, these results indicated that a flavonoid with higher affinity (i.e., lower Km value) to UGT1A1 is not necessarily a better inhibitor of UGT1A1, consistent with the notion that UGT1A1 has a large binding pocket that may accommodate more than one mode of binding interaction.32
The presence of more than one binding mode is consistent with the fact that flavonoids all displayed mixed-type inhibition patterns when the data were plotted using the Lineweaver-Burk plots. Lineweaver-Burk plots give a quick, visual impression of type and mechanism of enzyme inhibition and are often used to distinguish the competitive, non-competitive, uncompetitive and mixed-type inhibition. Plots of competitive inhibition have the same y-intercept (Vmax is unchanged), but different slopes and x-intercepts. Plots of noncompetitive inhibition have the same x-intercept (Km is unchanged), but different slopes and y-intercepts. Plots of uncompetitive inhibition causes different intercepts on both the y- and x-axes, but the same slope.26,33,34 As shown in Figure 3 and Figure 6, a series of lines in the Lineweaver-Burk plots exhibited different y-intercepts (don’t intersect on the y-axis), x-intercepts (don’t intersect on the x-axis) and slopes (unparallel). Especially, the slopes and y-intercepts increased with an increasing concentration of the inhibitor, it can be speculated that type of inhibition belongs to the mixed-type inhibition within the whole range of inhibitor concentrations tested, although at lower tested concentration, competitive inhibition pattern could be apparent. Accordingly, we determined that 3HF, 7HF, 4′HF and 3,7,4′THF were the mixed-type inhibitors of UGT1A1, and their mutual inhibitory kinetics obeyed the mixed-type inhibition.
It must be pointed out that the mixed-type inhibition could be a “mixture” of competitive inhibition and uncompetitive inhibition conceptually. It actually includes the competitive inhibition mode itself. As shown in the Table 3, the apparent Vmax values of 3HF and 4′HF remains largely unchanged at lower inhibitor concentration (0, 0.313, 0.625, 1.25 μM) while the Km values increased proportionally to the concentrations of inhibitor, which suggests that inhibition by 3,7,4′THF obeyed a competitive inhibitory mechanism at lower concentration. However, at higher inhibitor concentration, the Vmax values changed significantly. In addition, the Lineweaver-Burk plots (Figure 3 and Figure S2) suggested that the inhibition obeyed a mixed-type inhibition. Hence, the competitive inhibition is dominant in the mixed-type inhibition mode at the lower inhibitor concentrations [18]. It can be speculated that the observed inhibitory type and mechanism depend on the reaction conditions; for example, the range of substrates and inhibitors concentration selected.
Mutual inhibition of glucuronidation between 3 MHFs (3HF, 7HF, 4′HF) and 3,7,4′THF can be described qualitatively in terms of the inhibitor’s binding to UGT1A1 and UGT1A1-substrate complex, as well as its effects on the kinetic constants of UGT1A1. The kinetic scheme of the mixed-type inhibition was shown in Figure 8.35 In the case of the mixed-type inhibition, UGT1A1 enzyme (E) binds to its substrate (S, e.g., 3HF) to form the enzyme-substrate complex (ES, e.g., UGT1A1-3HF complex). At the same time, the mixed-type inhibitor (I, e.g., 3,7,4′THF) bind to both E and ES, and form enzyme-inhibitor complex (EI, e.g., UGT1A1-3,7,4′THF complex) and enzyme- substrate-inhibitor complex (ESI, e.g., UGT1A1-3HF-3,7,4′THF complex), respectively, but their enzyme’s binding affinities for the two forms are different (A≠1). The mixed-type inhibitor is capable of interfering with substrate binding and preventing UGT1A1 catalysis regardless if the substrate is already bound to UGT1A1, which results in a decrease in the apparent affinity of UGT1A1 for the substrate ( ), and a decrease in the apparent maximum enzyme reaction velocity ( ). Therefore, the changes in apparent Km and Vmax in the presence of flavonoid inhibitors are consistent with the hypothesis that inhibition of glucuronidation of four tested flavonoids obeyed the mixed-type inhibition. In addition, an increase in the apparent Km value and a decrease in the apparent Vmax value in the presence of increasing concentration of flavonoid inhibitor suggest that ESI complex is non productive. Moreover, the inhibition constant (of 3,7,4′THF) for binding to the free UGT1A1 (Ki) is smaller than that for binding to UGT1A1-substrate complex (Ki < AKi, A > 1) (substrate =3HF,7HF or 4′HF), which means the inhibitor 3,7,4′THF favors binding to free UGT1A1 not the UGT1A1-substrate complex (Table 3 and Table S1). 33
Figure 8.
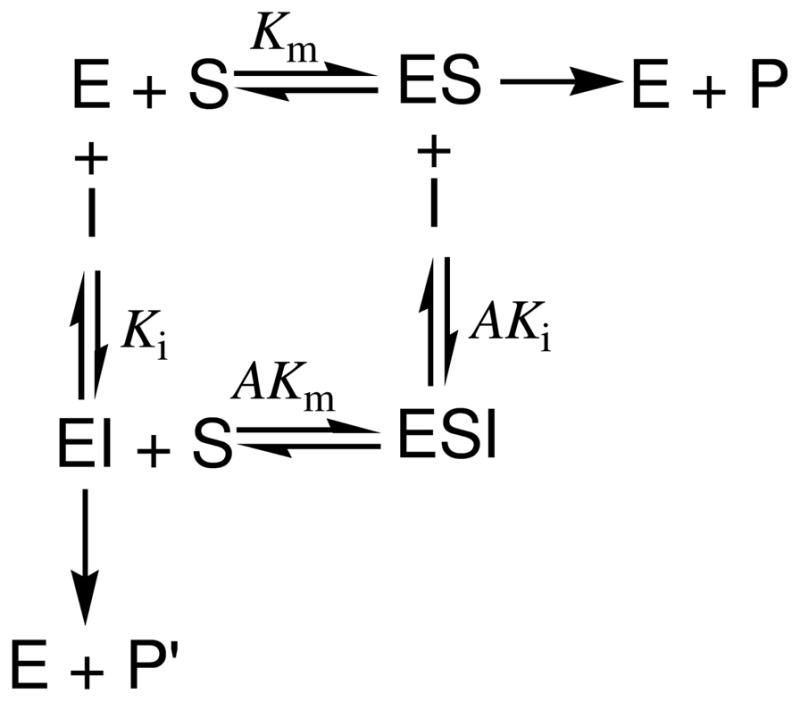
Kinetic scheme of the enzyme inhibition. E, enzyme (i.e. UGT1A1); S, substrate (i.e. 3HF, 7HF, 4′HF, or 3,7,4′THF); I, inhibitor (i.e. 3,7,4′THF, or 3HF, 7HF, 4′HF); ES, enzyme-substrate complex; EI, enzyme-inhibitor complex; ESI, enzyme-substrate-inhibitor complex; P or P′, product (i.e. 3HF-O-G, 7HF-O-G, 4′HF-O-G, 3,7,4′THF-3-O-G or 3,7,4′THF-7-O-G); A, modifying factor; Ki, dissociation constant for binding to the free enzyme (i.e. inhibition constants); AKi, dissociation constant for binding to the enzyme-substrate complex ; Km, Michaelis-Menten constant; AKm, dissociation constant for binding to the enzyme-inhibitor complex.
In the mixed-type inhibition, the inhibitor (e.g., 3,7,4′THF) can bind to UGT1A1 whether or not UGT1A1 was already bound to the substrate (e.g., 3HF, 7HF and 4′HF). However, the binding of the inhibitor affects the binding of the substrate, and vice versa. Although it is possible for the mixed-type inhibitor to bind to the active site, this type of inhibition generally results from an allosteric effect where the inhibitor binds to a different site on the UGT1A1. Inhibitor binding to this allosteric site changes the conformation (i.e., tertiary structure or three-dimensional shape) of UGT1A1 so that the affinity of the substrate for the active site is reduced, which is consistent with the observation that glucuronidation of 3,7,4′THF followed substrate inhibition pattern (Figure 5). This type of inhibition was reduced, but not overcome by increasing concentrations of the substrates. 26,33,36 This was confirmed by IC50 values of inhibition of glucuronidation of 3HF, 7HF, 4′HF and 3,7,4′THF at different concentrations of substrates (Figure 4 and Figure 7).
In summary, taking all these findings into consideration, we concluded that 3HF, 7HF, 4′HF and 3,7,4′THF were substrates and mixed-type inhibitors of UGT1A1. When used together, these flavonoids exhibited mutual regioselective inhibition of UGT1A1-mediated glucuronidation. Hence, this study will provide an important reference for appreciating the UGT-substrate-inhibitor interactions and structure-metabolism relationship. These interactions and relationships will be highly valuable to understand the potential interactions as the result of UGT1A1-mediated glucuronidation of various endobiotics and xenobiotics (e.g., flavonoids and drugs).
Supplementary Material
Acknowledgments
The author would like to thank Dr. Wen Jiang and Mr. Sumit Basu of Department of Pharmacological and Pharmaceutical Sciences, College of Pharmacy, University of Houston for their help in sample analysis, and thank Dr. Qinfeng Xu of Department of Statistics, School of Management, Fudan University for his help in statistical analyses.
This work was supported by grants from the National Institutes of Health (GM070737) to M.H. Guo Ma was supported by a training grant from the China Scholarship Council (CSC2010610).
Abbreviations Used
- 3HF
3-hydroxyflavone
- 7HF
7-hydroxyflavone
- 4′HF
4′-hydroxyflavone
- 3,7,4′THF
3,7,4′-trihydroxyflavone
- MHF(s)
monohydroxyflavone(s)
- THF
trihydroxyflavone
- -OH
hydroxyl
- O-G
O-glucuronide or O-glucuronidation
- 3HF-O-G
3HF-O-glucuronide
- 7HF-O-G
7HF-O-glucuronide
- 4′HF-O-G
4′HF-O-glucuronide
- 3,7,4′THF-3-O-G
3,7,4′THF-3-O-glucuronide
- 3,7,4′THF-7-O-G
3,7,4′THF-7-O-glucuronide
- 3,7,4′THF- 4′-O-G
3,7,4′THF-4′-O-glucuronide
- UGT(s)
UDP-glucuronosyltransferase(s)
- UGT1A1
UDP-glucuronosyltransferases1A1
- Conc
Concentration(s)
- UDPGA
Uridine diphosphoglucuronic acid
- UPLC
ultra performance liquid chromatography
- V
reaction velocity
- Km
Michaelis-Menten constant
apparent Michaelis-Menten constant
- Vmax
maximum reaction velocity
apparent maximum reaction velocity
- Ki
inhibition constant
- Ksi
substrate inhibition constant
- IC50
half maximal inhibitory concentration
- AIC
Akaike information criterion
- E
enzyme
- S
substrate
- I
inhibitor
- ES
enzyme-substrate complex
- EI
enzyme-inhibitor complex
- ESI
enzyme-substrate-inhibitor complex
- P or P′
product
Footnotes
Authorship Contributions:
Participated in research design: Guo Ma, Baojian Wu and Ming Hu
Conducted experiments: Guo Ma, Baojian Wu, Song Gao, Zhen Yang and Yong Ma
Contributed new reagents or analytic tools: Guo Ma, Baojian Wu and Song Gao
Performed data analysis: Guo Ma, Baojian Wu
Wrote or contributed to the writing of the manuscript: Ming Hu, Guo Ma and Baojian Wu
Other: Ming Hu acquired funding for the research.
References
- 1.de Sousa RR, Queiroz KC, Souza AC, Gurgueira SA, Augusto AC, Miranda MA, Peppelenbosch MP, Ferreira CV, Aoyama H. Phosphoprotein levels, MAPK activities and NFkappaB expression are affected by fisetin. J Enzyme Inhib Med Chem. 2007;22:439–44. doi: 10.1080/14756360601162063. [DOI] [PubMed] [Google Scholar]
- 2.Terao J. Dietary Flavonoids as Antioxidants. Forum Nutr. 2009;61:87–94. doi: 10.1159/000212741. [DOI] [PubMed] [Google Scholar]
- 3.Boersma MG, van der Woude H, Bogaards J, Boeren S, Vervoort J, Cnubben NH, van Iersel ML, van Bladeren PJ, Rietjens IM. Regioselectivity of phase II metabolism of luteolin and quercetin by UDP-glucuronosyl transferases. Chem Res Toxicol. 2002;15:662–70. doi: 10.1021/tx0101705. [DOI] [PubMed] [Google Scholar]
- 4.Chen J, Lin H, Hu M. Metabolism of flavonoids via enteric recycling: role of intestinal disposition. J Pharmacol Exp Ther. 2003;304:1228–35. doi: 10.1124/jpet.102.046409. [DOI] [PubMed] [Google Scholar]
- 5.Cushnie TP, Lamb AJ. Recent advances in understanding the antibacterial properties of flavonoids. Int J Antimicrob Agents. 2011;38:99–107. doi: 10.1016/j.ijantimicag.2011.02.014. [DOI] [PubMed] [Google Scholar]
- 6.Davis BD, Brodbelt JS. Regioselectivity of human UDP-glucuronosyl-transferase 1A1 in the synthesis of flavonoid glucuronides determined by metal complexation and tandem mass spectrometry. J Am Soc Mass Spectrom. 2008;19:246–56. doi: 10.1016/j.jasms.2007.11.004. [DOI] [PMC free article] [PubMed] [Google Scholar]
- 7.Graf BA, Milbury PE, Blumberg JB. Flavonols, flavones, flavanones, and human health: epidemiological evidence. J Med Food. 2005;8:281–90. doi: 10.1089/jmf.2005.8.281. [DOI] [PubMed] [Google Scholar]
- 8.Hu M. Commentary: bioavailability of flavonoids and polyphenols: call to arms. Mol Pharm. 2007;4:803–6. doi: 10.1021/mp7001363. [DOI] [PMC free article] [PubMed] [Google Scholar]
- 9.Kiang TK, Ensom MH, Chang TK. UDP-glucuronosyltransferases and clinical drug-drug interactions. Pharmacol Ther. 2005;106:97–132. doi: 10.1016/j.pharmthera.2004.10.013. [DOI] [PubMed] [Google Scholar]
- 10.Küpeli E, Sahin FP, Yeşilada E, Caliş I, Ezer N. In vivo anti-inflammatory and Antinociceptive activity evaluation of phenolic compounds from Sideritis stricta. Z Naturforsch C. 2007;62:519–25. doi: 10.1515/znc-2007-7-810. [DOI] [PubMed] [Google Scholar]
- 11.Evans WE, Relling MV. Pharmacogenomics: translating functional genomics into rational therapeutics. Science. 1999;286:487–91. doi: 10.1126/science.286.5439.487. [DOI] [PubMed] [Google Scholar]
- 12.Mackenzie PI, Bock KW, Burchell B, Guillemette C, Ikushiro S, Iyanagi T, Miners JO, Owens IS, Nebert DW. Nomenclature update for the mammalian UDP glycosyltransferase (UGT) gene superfamily. Pharmacogenet Genomics. 2005;15:677–85. doi: 10.1097/01.fpc.0000173483.13689.56. [DOI] [PubMed] [Google Scholar]
- 13.Maruo Y, Sato H. UDP-glucuronosyltransferase. Nihon Eiseigaku Zasshi. 2002;56:629–33. [PubMed] [Google Scholar]
- 14.Miners JO, Smith PA, Sorich MJ, McKinnon RA, Mackenzie PI. Predicting human drug glucuronidation parameters: application of in vitro and in silico modeling approaches. Annu Rev Pharmacol Toxicol. 2004;44:1–25. doi: 10.1146/annurev.pharmtox.44.101802.121546. [DOI] [PubMed] [Google Scholar]
- 15.Robotham SA, Brodbelt JS. Regioselectivity of human UDP-glucuronosyltransferase isozymes in flavonoid biotransformation by metal complexation and tandem mass spectrometry. Biochem Pharmacol. 2011;82:1764–70. doi: 10.1016/j.bcp.2011.08.015. [DOI] [PMC free article] [PubMed] [Google Scholar]
- 16.Rotger M, Taffe P, Bleiber G, Gunthard HF, Furrer H, Vernazza P, Drechsler H, Bernasconi E, Rickenbach M, Telenti A. Gilbert syndrome and the development of antiretroviral therapy-associated hyperbilirubinemia. J Infect Dis. 2005;192:1381–6. doi: 10.1086/466531. [DOI] [PubMed] [Google Scholar]
- 17.Schuier M, Sies H, Illek B, Fischer H. Cocoa-related flavonoids inhibit CFTR-mediated chloride transport across T84 human colon epithelia. J Nutr. 2005;135:2320–25. doi: 10.1093/jn/135.10.2320. [DOI] [PubMed] [Google Scholar]
- 18.Zhang D, Chando TJ, Everett DW, Patten CJ, Dehal SS, Humphreys WG. In vitro inhibition of UDP glucuronosyltransferases by atazanavir and other HIV protease inhibitors and the relationship of this property to in vivo bilirubin glucuronidation. Drug Metab Dispos. 2005;33:1729–39. doi: 10.1124/dmd.105.005447. [DOI] [PubMed] [Google Scholar]
- 19.Wu B, Xu B, Hu M. Regioselective glucuronidation of flavonols by six human UGT1A isoforms. Pharm Res. 2011;28:1905–18. doi: 10.1007/s11095-011-0418-5. [DOI] [PMC free article] [PubMed] [Google Scholar]
- 20.Singh R, Wu B, Tang L, Liu Z, Hu M. Identification of the position of mono-O-glucuronide of flavones and flavonols by analyzing shift in online UV spectrum (lambdamax) generated from an online diode array detector. J Agric Food Chem. 2010;58:9384–95. doi: 10.1021/jf904561e. [DOI] [PMC free article] [PubMed] [Google Scholar]
- 21.Wu B, Zhang S, Hu M. Evaluation of 3,3′,4′-Trihydroxyflavone and 3,6,4′-Trihydroxyflavone (4′-O-Glucuronidation) as the in Vitro Functional Markers for Hepatic UGT1A1. Mol Pharm. 2011;8:2379–89. doi: 10.1021/mp200300w. [DOI] [PMC free article] [PubMed] [Google Scholar]
- 22.Wu B, Morrow JK, Singh R, Zhang S, Hu M. Three-dimensional quantitative structure-activity relationship studies on UGT1A9-mediated 3-O-glucuronidation of natural flavonols using a pharmacophore-based comparative molecular field analysis model. J Pharmacol Exp Ther. 2011;336:403–13. doi: 10.1124/jpet.110.175356. [DOI] [PMC free article] [PubMed] [Google Scholar]
- 23.Singh R, Wu B, Tang L, Hu M. Uridine diphosphate glucuronosyltransferase isoform-dependent regiospecificity of glucuronidation of flavonoids. J Agric Food Chem. 2011;59:7452–64. doi: 10.1021/jf1041454. [DOI] [PMC free article] [PubMed] [Google Scholar]
- 24.Zhang D, Zhu M, Humphreys WG. Conjugative Metabolism of Drugs. In: Remmel R, Nagar S, Argikar U, editors. Drug Metabolism in Drug Design and Development: Basic Concepts and Practice. John Wiley & Sons, Inc; Hoboken: 2007. pp. 37–88. [Google Scholar]
- 25.Tang L, Ye L, Singh R, Wu B, Lv C, Zhao J, Liu Z, Hu M. Use of Glucuronidation Fingerprinting To Describe and Predict Mono- and Dihydroxyflavone Metabolism by Recombinant UGT Isoforms and Human Intestinal and Liver Microsomes. Mol Pharm. 2010;7:664–79. doi: 10.1021/mp900223c. [DOI] [PMC free article] [PubMed] [Google Scholar]
- 26.Segel IH. Enzyme kinetics: behavior and analysis of rapid equilibrium and steady state enzyme systems. Wiley-Interscience; New York: 1993. pp. 100–78. New. [Google Scholar]
- 27.Wu B, Ako R, Hu M. A Useful Microsoft Excel Add-in Program for Modeling Steady-state Enzyme Kinetics. Pharm Anal Acta. 2011:S11,003. doi: 10.4172/2153-2435.S11-003. [DOI] [Google Scholar]
- 28.Christopoulos A, Lew MJ. Beyond eyeballing: Fitting models to experimental data. Crit Rev Biochem Mol Biol. 2000;35:359–91. doi: 10.1080/10409230091169212. [DOI] [PubMed] [Google Scholar]
- 29.Takeda S, Kitajima Y, Ishii Y, Nishimura Y, Mackenzie PI, Oguri K, Yamada H. Inhibition of UDP-glucuronosyltransferase 2B7-catalyzed morphine glucuronidation by ketoconazole: dual mechanisms involving a novel noncompetitive mode. Drug Metab Dispos. 2006;34:1277–82. doi: 10.1124/dmd.106.009738. [DOI] [PubMed] [Google Scholar]
- 30.Jenkinson C, Petroczi A, Naughton DP. Red wine and component flavonoids inhibit UGT2B17 in vitro. Nutr J. 2012 doi: 10.1186/1475-2891-11-67. [DOI] [PMC free article] [PubMed] [Google Scholar]
- 31.Fong YK, Li CR, Wo SK, Wang S, Zhou L, Zhang L, Lin G, Zuo Z. In vitro and in situ evaluation of herb-drug interactions during intestinal metabolism and absorption of baicalein. J Ethnopharmacol. 2012;141:742–53. doi: 10.1016/j.jep.2011.08.042. [DOI] [PubMed] [Google Scholar]
- 32.Wu B, Basu S, Meng S, Wang X, Hu M. Regioselective sulfation and glucuronidation of phenolics: insights into the structural basis. Curr Drug Metab. 2011;12:900–16. doi: 10.2174/138920011797470100. [DOI] [PMC free article] [PubMed] [Google Scholar]
- 33.Plaxton WC. Principles of Metabolic Control. In: Storey KB, editor. Functional Metabolism: Regulation and Adaptation. Wiley-Liss; New York: 2004. p. 12. [Google Scholar]
- 34.Yin SJ, Si YX, Qian GY. Inhibitory Effect of Phthalic Acid on Tyrosinase: The Mixed-Type Inhibition and Docking Simulations. Enzyme Res. 2011 doi: 10.4061/2011/294724. [DOI] [PMC free article] [PubMed] [Google Scholar]
- 35.Chan William WC. Combination plots as graphical tools in the study of enzyme inhibition. Biochem J. 1995;311:981–5. doi: 10.1042/bj3110981. [DOI] [PMC free article] [PubMed] [Google Scholar]
- 36.Berg JM, Tymoczko JL, Stryer L. Biochemistry. 6. W.H. Freeman and Company; New York: 2006. Enzymes: Basic Concepts and Kinetics; pp. 205–36. [Google Scholar]
Associated Data
This section collects any data citations, data availability statements, or supplementary materials included in this article.


