

Abstract
While physiological studies suggested convergence of chorda tympani and glossopharyngeal afferent axons onto single neurons of the rostral nucleus of the solitary tract (rNTS), anatomical evidence has been elusive. The current study uses high-magnification confocal microscopy to identify putative synaptic contacts from afferent fibers of the two nerves onto individual projection neurons. Imaged tissue is re-visualized with electron microscopy, confirming that overlapping fluorescent signals in confocal z-stacks accurately identify appositions between labeled terminal and dendrite pairs. Monte Carlo modeling reveals that the probability of overlapping fluorophores is stochastically unrelated to the density of afferent label suggesting that convergent innervation in the rNTS is selective rather than opportunistic. Putative synaptic contacts from each nerve are often compartmentalized onto dendrite segments of convergently innervated neurons. These results have important implications for orosensory processing in the rNTS, and the techniques presented here have applications in investigations of neural microcircuitry with an emphasis on innervation patterning.
Keywords: Gustation, Primary Afferent Innervation, Convergence, Brainstem
Introduction
Afferent nerve convergence is a common feature of spinal cord dorsal horn and cranial brain stem nuclei, and is implicated in a number of facets of sensory processing (Moore, 1991; Piovesan et al., 2003; Todd, 2010)). Multiple cranial nerves innervate the orosensory region of rostral nucleus of solitary tract (rNTS) posing the problem of whether such afferent convergence may serve a unique function in the processing of such sensory information. Examination of the spatial distribution and target selectivity of synaptic convergence from distinct inputs in sensory system circuitry will help reveal unique properties of the functional organization in these chemosensory pathways.
Orosensory information from the tongue (including taste) is relayed to the rNTS via multiple nerves, each innervating a specific subpopulation of taste buds at partially overlapping topographic locations on the tongue. The chorda tympani nerve (CT) innervates fungiform papillae on the anterior tongue and a small number of foliate papillae on the posterior tongue (Whiteside, 1927; Yamamoto and Kawamura, 1975), while the glossopharyngeal nerve (IX) innervates the foliate and circumvallate papillae on the posterior tongue. Both nerves are multimodal, responding to gustatory, mechanosensory (Biedenbach and Chan, 1971; Matsuo et al., 1995; Smith et al., 2004), and thermosensory stimuli (Yamada, 1965; Yamashita and Sato, 1965; Yamada, 1966; Ogawa et al., 1968; Breza et al., 2006; Breza et al., 2010). Thus, a monosynaptic convergence between these two nerves would be an indicator for integration of topographic and/or modality-specific information at the first central relay. Past physiological investigations contradictorily suggested both a widespread convergence of anterior and posterior solitary tract (presumably CT and IX respectively) innervation of rNTS neurons (Grabauskas and Bradley, 1996), and a minor and restricted convergence of anterior and posterior tongue (also presumably CT and IX respectively) activation of rNTS neurons (Travers et al., 1986; Travers and Norgren, 1995). Whether this activation results from convergent monosynaptic innervation, conveys distinct modalities or topographies, or is specific for individual phenotypes of neurons remains unknown. As the orosensory rNTS sends efferents along two anatomically and functionally distinct pathways (the ascending pathway projecting to the parabrachial nucleus of the pons and the descending pathway projecting to intramedullary structures), this last point is especially crucial for the interpretation of any convergent innervation (Woods, 1964; Grill and Norgren, 1978; Travers, 1988; Halsell et al., 1996). Utilizing high-resolution imaging techniques, we undertook the task of obtaining anatomical evidence for monosynaptic convergence between CT and IX nerves onto a specific neuronal population: orosensory relay cells of the rNTS projecting to the parabrachial nucleus of the pons.
The methods currently available to visualize the distribution of inputs along dendritic arborizations leave room for ambiguity. While having the capacity to visualize multiple elements of the circuitry, epifluorescence and brightfield microscopy have limitations due to physical resolution, resulting in the inability to confirm the presence of synaptic contacts or even appositions (Cabirol-Pol et al., 2000; da Costa and Martin, 2009). Recent advances have been made in the conversion of fluorescently imaged material to be suitable for synaptic analysis on the electron microscope (De Paola et al., 2006; Knott et al., 2006; Knott et al., 2009; Zito et al., 2009; Li et al., 2011), but these investigations have used either cultured slices or in vivo imaging techniques not suitable for the study of deep brain structures such as rNTS. Further, these studies have used single fluorophore imaging which is unable to resolve anatomical connections between two populations of afferent neurons and a target neuron. However, previous researchers have used high-resolution confocal microscopy to identify putative synaptic sites between axons and dendrites labeled with differing fluorophores, successfully identifying such sites as an overlapping of two separate fluorophores (Wouterlood, 2005; Wouterlood et al., 2008a; Wouterlood et al., 2008b). The current study builds off of these previously described approaches by developing a technique for the high resolution fluorescent investigation of convergent innervation, combined with electron microscopy for validation of the apposition criterion applied to a larger dataset that can only be obtained using confocal microscopy, and utilizes this technique to investigate convergent innervation in the orosensory rNTS.
Materials and Methods
Animals
Six adult Sprague-Dawley rats were used for the analyses outlined in this study (three for high magnification confocal triple fluorescence microscopy, two for electrophysiological confirmation of coordinates for rNTS recipient PBN regions, and one for combined confocal and electron microscopy analysis.). Nine other rats that received PBN and afferent nerve injections were excluded from analysis due to failure of one at least one of the anterograde or retrograde tracers. All animals were kept on a 12:12 light:dark cycle and fed standard rat chow. All experiments were carried out under the guidelines of the Animal Care and Use Committee of the University of Virginia.
Parabrachial injections
Animals were anesthetized with medetomidine hydrochloride (0.2 mg/kg; i.m.) and ketamine (40 mg/kg; i.m.) and placed in a stereotaxic apparatus with body temperature maintained at 36°C on a water circulating heating pad. Following the alignment of lambda and bregma in the horizontal plane, a 2×2 mm hole was drilled in the skull approximately 11.4 mm caudal to bregma and 1.7 mm lateral to the midline. A Hamilton syringe was lowered 5.5 mm at a 20° caudal-rostral angle from the cerebellar surface and approximately 200 nl of biotinylated dextran amine (BDA; Invitrogen) in 0.1 M phosphate buffer (PB; pH 7.4) were injected into the PBN. Bonewax was then applied to the hole in the skull, the animal’s scalp sutured, and the animal revived with atipamezole (1 mg/kg; i.m.).
Confirmation of PBN coordinates
In order to confirm the coordinates used for the tracer injection were indeed placed in the gustatory responsive region of the parabrachial nucleus, multiunit extracellular responses were recorded in 2 animals prior to the tracer injection.
A low impedance tungsten electrode (0.3–0.5 MΩ; FHC) was lowered through the cerebellum to the desired depth from the cerebellar surface mentioned above. The anterior tongue was then stimulated with a taste mixture containing 0.3 M NaCl, 1.0 M sucrose, 0.03 M HCl, 0.01 M quinine HCl, and 10 μM cyclohexamide in artificial saliva (composed of [in mM]: 2 NaCl, 5 KCl, 3 NaHCO3, 3 KHCO3, 2.5 CaCl2, 2.5 MgCl2, 1.2 K2HPO4, 1.2 KH2PO4, 18 HCl). Responses were recorded using a Neuro Lab preamplifier connected to a Power Lab and Lab Chart data acquisition system (AD Instruments). Following the recording, the electrode was removed and the retrograde tracer injection proceeded as described above. These animals did not receive gustatory nerve label.
Following a survival time of 48 hours for tracer transport, rNTS sections from both animals were prepared as described below for fluorescent visualization of retrogradely labeled rNTS projection neurons. Imaging and cell morphology reconstructions were performed as described below.
Orosensory nerve label
Twenty-four hours following parabrachial nucleus injection, the chorda tympani nerve (CT) was labeled with tetramethylrhodamine dextran amine and the glossopharyngeal nerve (IX) was labeled with Cascade Blue dextran amine using previously described techniques (May and Hill, 2006; Corson et al., 2012). Animals were anesthetized with intramuscular injections of medetomidine hydrochloride (0.2 mg/kg; i.m.) and ketamine (40 mg/kg; i.m.), and placed in a non-traumatic head holder (Erickson, 1966) with body temperature maintained at 36° C on a water circulating heating pad. An incision was then made along the ventral midline of the neck and musculature retracted to expose the tympanic bulla. The bulla was opened and CT was cut peripheral to the geniculate ganglion. Lyophilized crystals of 3 kD tetramethylrhodamine dextran (Invitrogen) were placed on the central stump of the CT, and the opening to the bulla was covered in parafilm. IX was located medial to the tympanic bulla as it progressed through connective tissue dorsal to the hypoglossal nerve. The connective tissue covering the nerve was parted using sharp forceps and the nerve isolated. IX was then cut peripheral to the petrosal ganglia and the central stump of the nerve placed onto the parafilm covering the hole made in the bulla. Lyophilized crystals of 3 kD Cascade Blue dextran (Invitrogen) were applied to the nerve stump and then covered in parafilm. The incision was then sutured and the animal revived with atipamezole (1 mg/kg; i.m.). Following a two-day survival, the animal was deeply anesthetized with Nembutal and intra-aortically perfused with Tyrode’s solution and fixed with 4% paraformaldehyde in 0.1 M PB (pH 7.4). Brains were then post-fixed overnight in 4% paraformaldehyde in 0.1 M PB (pH 7.4). The rNTS was sectioned horizontally at 100 μm thickness on a vibrating microtome. Sections were reacted with streptavidin conjugated to Alexa488 (Invitrogen Catalog #: S11223; 1:500) in 0.01 M phosphate buffer saline (PBS; pH 7.4) with 0.1% Triton for two hours followed by 5×5 min rinses in PBS. Sections were then reacted with an anti-cascade blue antibody made in rabbit (Invitrogen Catalog #: A-5760; 1:500) in PBS, followed by anti-rabbit conjugated to Cy5 (Jackson Catalog #: 111-175-003; 1:500) separated by 5×5min rinses resulting in fluorescently triple-labeled tissue. Antisera specificity was determined by the lack of colocalization of any of the three fluorophores.
Confocal imaging and data analysis
The reacted tissue was mounted onto slides with Prolong Gold Anti-Fade (Invitrogen) to prevent photo bleaching, and coverslipped. The tissue was imaged on an Olympus IX70 microscope equipped with a Fluoview 5.0 confocal laser scanning system. For the animals that only received BDA injections into the parabrachial nucleus following multiunit electrophysiology, sections were imaged at 20x with a 1μm z-step size. Image stacks encompassing an entire horizontal rNTS section were aligned in the x, y, and z planes in Neurolucida (MBF Biosciences) and neuron morphology reconstructed. For triple label high-resolution imaging, we used a 60x oil-immersion objective (N.A. = 1.4) with an additional 1.5x optical zoom to give a final magnification of 90x. This yielded a voxel size of 0.15 μm3. The alignment of the three lasers was confirmed using micro-beads (Invitrogen) containing fluorophores of the three wavelengths imaged in this study. These images were deconvolved using a theoretical point spread-function algorithm (Autoquant, MediaCy) and visualized with Volocity (Improvision). The theoretical point spread function algorithm used in Autoquant was derived from the emitted wavelength of the fluorophore, the refractive index of the immersion medium (i.e. oil) and the magnification and numerical aperture of the objective. Multiple z-stacks containing an individual cell were aligned in the x, y, and z planes and the dendritic architecture drawn in Neurolucida (MBF Biosciences). Neurons were classified as either multipolar or elongate using previously established morphological criteria (Davis, 1988; Davis and Jang, 1988; Whitehead, 1988; 1990). Neurons with 3–5 primary dendrites were classified as multipolar and neurons with 2 primary dendrites emanating from opposite ends of an elongated cell body were classified as elongate. The contacts from each nerve onto the imaged cell were identified in Volocity, and their locations were transferred onto cell reconstructions in Neurolucida. The criterion for identifying an apposition was the presence of a 2–3 voxel wide overlap between two fluorophore-filled objects. If labeled voxels were simply apposed, but not overlapping, this indicated the presence of an actual space of at least 0.15 μm (voxel size) between the terminal and the dendrite (see Results for confirmation of this criterion). All values are reported as mean ± standard error unless otherwise noted.
In order to obtain high resolution confocal images with minimal noise and fluorescent spread, all images were deconvolved using Autoquant’s theoretical point spread function. Deconvolution eliminated much of the fluorescent spread, especially in the z-axis, as well as depixelated the signal. However, even with deconvolution, a slight lateral and axial spread of the fluorescent signal from labeled processes was inevitable. Rather than disregarding the fluorescent spread, we used it to increase resolving power, as the resolution of the confocal microscope is insufficient to resolve synaptic clefts. We reasoned, as have others, that putative contacts between afferent nerve boutons and projection neuron dendrites could only be visualized as an overlap in fluorophores caused by this spread of fluorescence (Wouterlood et al., 2008b). As the three fluorophores labeled discrete, membrane-encased processes in the neuropil, physical co-localization of the fluorophores was impossible. Any overlap in fluorescence was only possible if both processes were extremely close to each other.
Image processing was performed in Photoshop (Adobe), and it was limited to the Levels adjustment of the image histogram.
Confocal-Electron microscopy conversion
In order to confirm that the apposition criteria used to identify putative synaptic zones on confocal images was valid for detecting true membranous appositions, we developed a process to visualize the same fluorescent tissue on the electron microscope. The surgery mentioned above was performed with the following exceptions: 1) Only a single nerve was labeled; 2) Tissue was sectioned at 30 μm rather than 100 μm to allow a more complete labeling of the fluorophores with DAB; and 3) 0.06% Triton was used rather than 0.1%, to aid in ultrastructural preservation. These modifications allowed us to visualize dendrites and axons with fluorescent probes, and also perform subsequent immunocytochemistry on the same section using routine electron microscopy preparation procedures (Erisir et al., 1997; Erisir et al., 2001; Nahmani and Erisir, 2005; May et al., 2007; Corson et al., 2009). After confocal imaging, the tissue was removed from the slides, and Prolong was rinsed out via a 30 minute incubation in 35° C PBS. No further tissue fixation was implemented, because, due to the duration of confocal imaging, EM processing of the slices could not be started until approximately 1 week after perfusion. The sections were then incubated in primary antibodies directed against both the Alexa488 and tetramethylrhodamine fluorophores made in rabbit (1:200 in PBS; Invitrogen). The sections were then rinsed 5×5 min. in PBS, incubated in biotinylated anti-rabbit secondary antibodies (1:100 in PBS; Vector) followed by avidin-biotin complex (1:100 in PBS; Vector), and subsequently reacted with 0.1% diaminobenzidine with 0.001% H202 in PBS to visualize the tracers. Sections were then processed and embedded in resin using standard techniques (Nahmani and Erisir, 2005; Corson et al., 2009). The tissue was then serially sectioned on a Leica UC7 ultramicrotome at 2 μm and collected onto subbed slides similar to a previous study utilizing confocal and electron microscopy (Campbell et al., 2009). These sections were photographed using a Leica DC100 digital camera mounted onto a Leica light microscope (Model 888011). This allowed for the isolation of dendritic segments in 2 μm rather than 30 μm sections, aiding in the correlation of electron- and confocal-microscopically viewed structures. These 2 μm sections were then reembedded in EPON, further sectioned to 70 nm, and collected on copper grids. These ultrathin sections were visualized on a Jeol 1010 transmission electron microscope and contacts previously identified on confocal images were observed at the ultrastructural level and synaptic interaction assessed. Composites of 800x images were reconstructed in Adobe Photoshop and analyzed to create a single high-resolution electron photomicrograph of the entire area imaged on the confocal microscope.
Statistical modeling
In order to determine the stochastic probability of a labeled voxel overlapping a dendrite, a theoretical cylindrical dendrite (radius = 1 μm, length = 20 μm) was created inside of a three-dimensional matrix (10 μm × 10 μm × 20 μm) with a resolution of 0.15 μm3 (equivalent to the voxel size in our confocal images) with Matlab (Mathworks, Natick, Massachusetts). Randomly scattered points were selected surrounding this dendrite, inclusive of 2 voxels within the dendrite’s surface, and the number of points selected within the dendrite recorded. This processes was repeated by selecting 0.01% to 2.00% (in increments of 0.01%) of all possible points, with 100 iterations at each percentage.
Results
rNTS-PBN neuron morphology
Injections of BDA centered on the waist region of the PBN produced robust, Golgi-like retrograde cell filling in the rNTS. Multiunit responses to gustatory stimulation could be recorded in the PBN with the same stereotaxic coordinates, confirming that this region is indeed taste-responsive (Figure 1). Retrograde cellular label in the rNTS was only achieved with injections directly into the waist region of the PBN (Figure 2A), confirming that the cells labeled are indeed rNTS-PBN projection neurons. At the dorsal-ventral plane containing chorda tympani and glossopharyngeal terminal fields (see below), both multipolar and elongate neurons were filled (75% multipolar, n = 33 out of 44), and the vast majority of these retrogradely filled neurons were located in the rostrocentral subdivision (Figure 2B–E) in agreement with previous studies (Whitehead, 1990; Halsell et al., 1996). A few retrogradely filled cells were also present in the rostrolateral and ventral subdivisions. Within the horizontal plane, the majority of dendrites radiated parallel to the solitary tract through the rostrocaudal axis of the rNTS (Figure 2F). Although many of the medio-laterally radiating dendritic branches did not terminate with natural endpoints (i.e. dendrites were cut during tissue sectioning), the ones that did were considerably shorter that the rostro-caudally extending dendrites, confirming that the dendrites of these ascending relay neurons preferentially extend in the rostro-caudal plane.
Figure 1.
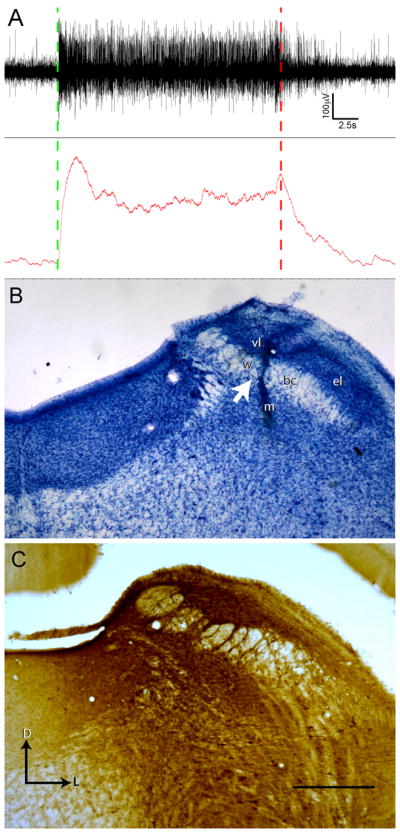
Parabrachial nucleus injection site is in gustatory responsive waist region. (A) The coordinates of gustatory responsive PBN region were determined in initial in vivo recording experiments. Both multiunit (top trace) and integrated activity (bottom trace) display a sustained increase in neural activity throughout the duration of tastant application to the oral cavity (Stimulation start at green dashed line, rinse at red dashed line). (B) Nissl staining of the parabrachial nucleus in one case that received triple injections reveals distinct and local damage to the PBN waist region after BDA injection via Hamilton syringe. Injection not centered on the waist region failed to produce retrograde cellular filling in the rNTS despite diffusion of tracer away from the injection location into the waist region. Arrow marks the location of the Hamilton syringe tract passing through the waist region of the PBN. (C) An ABC-DAB labeled section from another case with triple injections illustrates the dense tracer labeling centered at waist region. D = dorsal, L = lateral. PBN subregions: w = waist region, bc = brachium conjunctivum, el = external lateral, m = medial, vl = ventral lateral. Scale in B = 600 μm.
Figure 2.

Injection of biotinylated dextran amine (BDA) into the gustatory responsive waist region of the parabrachial nucleus labels ascending projection neurons in the rostrocentral nucleus of the solitary tract (rNTS). (A) BDA injection using the same coordinates as the recording site in Figure 1 produces Golgi-like retrograde cellular filling in the rNTS (BDA reacted with stretavidin-Alexa488). Such an injection labels both multipolar and elongate neurons as viewed in both the (B) low power tracing of each neuron and (C) high power collapsed confocal z-stack (e = elongate neuron, m = multipolar neuron) and (D) corresponding wire-diagrams. (E) In the coronal plane, BDA visualized with an ABC-DAB reaction, retrogradely filled neurons are most concentrated in the rostrocentral subdivision (borders drawn from adjacent Nissl- and myelin-stained sections). (F) The majority of labeled neurons extend dendrites in the horizontal plane, parallel to the orientation of the solitary tract (red line). This polar histogram is composed of the dendritic lengths of all dendrites from 44 reconstructed neurons. Scale in A and B = 250 μm. Scale in C = 100 μm. Scale in E = 200 μm. D = Dorsal, L = Lateral, R = Rostral. RC = Rostrocentral subdivision, RL = Rostrolateral subdivision, V = Ventral subdivision.
Triple labeling of rNTS-PBN projection neurons and CT and IX afferent terminal fields appeared in two 100 μm horizontal sections, with the dorsal-most 100 μm section containing the densest combination of the three. Although most of the neurons labeled by PBN injections were located in the CT terminal field (Figure 3), many dendrites extended caudally into a region dominated by IX afferent label. Multiple high-resolution z-stacks containing the dendritic processes were stitched together in the x, y, and z planes (Figure 4) and individual dendritic branches followed and traced throughout the 100 μm section (551 ± 100 μm dendritic length per cell; Figure 4C). Note that this does not constitute a complete reconstruction of the cell’s dendritic tree as some branches were cut due to sectioning and could not be followed in adjacent sections. No subjective differences in the location or cellular morphology of the retrogradely filled cells were apparent between animals.
Figure 3.

Triple Fluorescent Imaging. Triple fluorescence labeling was achieved with a combination of BDA and streptavidin Alexa488 for the projection neurons (green), tetramethylrhodamine for the chorda tympani nerve (CT; red; A), and cascade blue reacted with Cy5 for the glossopharyngeal nerve (IX; blue; B). Both the dorsal CT terminal field and the glossopharyngeal terminal field are visible in one or two (depending on the exact plane of section) 100 μm sections along with projection neurons in both fields. C. Three scans are merged to reveal overlap of retrograde and anterograde labels. Asterisk (*) in each panel marks the same landmark blood vessel. Arrow in C points to the cell illustrated in detail in Figure 4. Tentative NTS border (solid line) is drawn based on brightfield landmarks. Scale = 380 μm in all panels. R = Rostral, L = Lateral, st=solitary tract.
Figure 4.

PBN projecting neurons were mapped onto a prototypical template and reconstructed in three dimensions through multiple z-stacks. (A) The location of the cell of interest from Figure 3 is marked with a red asterisk on the horizontal coordinate based subdivision map from Corson et al. 2012. Cells with dendrites extending through both terminal fields were imaged at high magnification (60x plus 1.5x optical zoom; N.A. 1.4; z-step = 0.15 μm) and z-stacks containing the neuron in question were aligned and reconstructed in the x, y, and z planes. This example is a composite of four individual z-stacks that have been reconstructed to visualize the entire dendritic tree contained within a single 100 μm physical section. (C) The cell morphology is then traced and the cell type identified, in this case a multipolar neuron. Scale in A = 25 μm. R = Rostral, L = Lateral, IL = Intermediate Lateral subdivision, 4V = fourth ventricle, st = solitary tract, DCN = dorsal cochlear nucleus. Arrowhead marks the caudal border of the rNTS, operationally defined as where the NTS separates from the wall of the 4th ventricle. Caudal NTS subdivision abbreviations: pc = parvicellular, ce = central, com = commissural, I = intermediate, VL = ventrolateral.
Putative synaptic site identification
Patches where the fluorophores overlapped were identified in the three orthogonal planes of section, as well as in a three-dimensional rendering of the confocal z-stack. These appeared as a yellow fluorescence (the combination of green and red) for CT contacts (Figure 5) and a teal fluorescence (the combination of blue and green) for IX contacts (Figure 6). For both CT and IX contacts, the size of apposition site overlapped the dendrite by at least 3 × 3 × 2 voxels (0.45 μm × 0.45 μm × 0.30 μm; X × Y × Z), forming a three dimensional plaque along the dendrite surface.
Figure 5.

Putative Chorda Tympani Nerve Synaptic Sites. Contacts between the chorda tympani (CT) nerve (red in panel A and magenta panels B–F) and an rNTS-PBN projection neuron dendrite (green) can be visualized with high-magnification confocal microscopy (same neuron as in Figure 4). (A) Lower magnification reveals the location of the apposition on the dendritic tree (dashed box represents the area of interest for the other panels). This contact occurs after the first branch point on the proximal dendritic tree. (B) The dendritic segment and surrounding afferent label are visualized in a 3-dimensional rendering and rotated to reveal the overlapping fluorophores. The overlapping region of the two fluorophores can be seen as a yellow band at the contact zone. Note that there is also a contact visible between a chorda tympani and glossopharyngeal axon (blue). Interestingly, axo-axonal innervation has been noted for both nerves in past EM studies, but the post-synaptic identity has remained undetermined (Whitehead, 1986; May et al., 2007). (C–F) Other examples of 3-D renderings of CT putative synaptic sites (white arrows) onto ascending projection neuron dendrites display the same characteristic yellow contact band. Touching processes without displaying fluorophore overlap (black arrows) were not considered to be putative synaptic sites, as due to fluorescent spread the processes were likely separated by at least 150 nm (the resolution of the images). Note that in C–F, IX processes were removed to aid in visualization of CT putative synaptic sites. In panels B–F red channels were pseudocolored magenta to aid in visualization. Scale in A = 10 μm, Scale in B–F = 3 μm. R = Rostral, L = Lateral.
Figure 6.

Putative Glossopharyngeal Nerve Synaptic Site. A contact between the glossopharyngeal (IX) nerve (blue) and the same rNTS-PBN projection neuron dendrite (green; as in Figure 4) can be visualized with high-magnification confocal microscopy. (A) Lower magnification reveals the location of the apposition on the dendritic tree (dashed box represent the area of interest for the other panels). This contact occurs on the further distal portions of the dendritic tree. (B) This segment of the dendrite and surrounding afferent label are then visualized in a 3-dimensional rendering. The overlapping region of the two fluorophores can be seen as a teal band at the contact zone. (C–F) Other examples of 3-D renderings of IX putative synaptic sites (white arrows) onto ascending projection neuron dendrites display the same characteristic yellow contact band. Touching processes without displaying fluorophore overlap (black arrows) were not considered to be putative synaptic sites, as due to fluorescent spread the processes were likely separated by at least 150 nm (the resolution of the images). Note that in C–F, CT processes were removed to aid in visualization of IX putative synaptic sites. Scale in A = 10 μm, Scale in B–F = 3 μm.
There are a number of caveats often discussed when undertaking an innervation topography analysis with confocal microscopy that will be addressed in the following sections. These include controls for the reliability of criteria used for confocal identification of appositions and the contribution of stochastic colocalization related to fluorescence density.
Electron microscopic confirmation of putative synaptic contacts
The size of individual voxels imaged using fluorescent probes is invariably larger than the size of the object it represents, due to the diffusion of fluorescence beyond label-containing compartments. Furthermore, the optical limits of the microscope lenses impose a further theoretical limit (D= 0.61λ/NA; using 1.4 NA objective at λ=400–600 nm) on the actual two-point discrimination power of the confocal images. This is relevant to our material in two ways: First, two voxels that are adjacent to each other do not represent two physically adjacent objects. Thus, two truly apposing objects (e.g. an axon bouton and a dendrite) would be manifested by a strip of overlapped voxels of two fluorescence probes, along the apposition. Second, the size and the shape of the apposition overlap can only be reliably detected if the voxel size is smaller than the size of the fluorescence diffusion factor. Therefore, in order to confirm the validity of using high-magnification confocal microscopy for the identification of putative synaptic contacts, it must be first confirmed that the confocally identified appositions are indeed physically apposing processes. To this aim, we compared the distances between two profiles observed using both confocal and electron microscopy. Ascending projection neuron dendrites and chorda tympani nerve fibers were identified in comparable z-planes taken from confocal stacks of the original 30μm thick sections (Figure 7A–B). Although tissue preservation was not optimal for reconstructions of confocally identified profiles at the electron microscope (due to the prolonged high-magnification confocal imaging, the lack of gluteradehyde in the perfusate, and extensive tissue processing), the distances between labeled profiles could be accurately measured (Figure 7C–D). The distances between labeled profile pairs were measured both on electron photomicrographs and single confocal z-plane photomicrographs (n= 30 pairs). Electron microscopically- and confocally-measured distances were linearly correlated (r = 0.88), indicating that the same profiles were accurately identified between the two images. Furthermore, confocal measurements were −0.35 μm offset relative to electron microscopic measurements, indicating that confocal images have a measurement error factor (presumably stemming from a combination of fluorescence diffusion, optical resolution limitations of the microscope and voxel size) of 0.35 μm. While this error factor puts our measurements in line with the theoretical limits of resolution for the confocal microscope, thus underlining the unreliability of measurements taken from confocal images, it clearly determines the confidence limits for the amount of fluorescent overlap that is expected, given the resolution limits imposed by the optics, fluorescent spread and imaging parameters. When two objects (e.g. membrane bound compartments, containing only one fluorophore) are apposed to each other, confocal images should yield an overlap of at least 0.35 μm, which was captured across at least 2–3 voxels. Thus, confocal-ultrastructural distance discrepancy was larger than confocal voxel size (0.15 μm), and at least a two-voxel overlap in the confocal signals was necessary for two profiles to be accurately identified as apposing each other (Figure 7E).
Figure 7.

Putative Synaptic Site Ultrastructural Confirmation. The confirmation of appositions was performed using high-magnification confocal microscopy combined with electron microscopy. (A) 30 μm thick sections labeled for the projection neuron cell bodies and dendrites (green) and the chorda tympani nerve (magenta) were imaged at high magnification on the confocal microscope. (B) Following antibody processing and re-sectioning as described, a 70 nm ultrathin section was visualized on the electron microscope. The cell body location and dendrite orientation provide useful landmarks for matching not only the location in the lateral plane, but also the tissue depth. Note that * and # mark corresponding cell somata in panels A and B. (C) A higher magnification view of a single optical section reveals a dendrite (d) that has overlapping pixels with two CT axon segments (a1 and a2). Nearby, there is another axonal segment (a3), which does not show apposition with the same dendrite. The examination of deconvoluted 3D stacks of this dendrite had displayed appositions at boutons that corresponded to a1 and a2, but not to a3. (D) The analogous optical plane (note that it is impossible to claim identical planes, due to indeterminable degrees of probable tilt between confocal scans and ultrathin sectioning) was located on ultrathin sections on the electron microscope. The dendrite and axon borders are marked with green and red, respectively to display degree of similarity between the confocal scan and EM sectioning planes. Although the tissue has obviously deteriorated following the intense confocal imaging and subsequent processing, a gap between a3 and d is evident. Adjacent EM sections also displayed similar gaps. (F & G) High magnification examination of ultrathin EM section illustrated in D (F) and the adjacent ones (G) revealed synapse structure (parallel arrangement of pre and postsynaptic membranes; black arrows) at the CT axon segments a1 and a2. A corresponding fluorescent overlap was also present in deeper optical planes of the confocal z-stack, confirming not only an adequate x–y resolution, but also adequate z-resolution for the identification of appositions. (E) A comparison of the distances between adjacent, near adjacent, or overlapping confocally-visualized processes with the subsequent electron microscopically measured distance reveals a strong correlation between the two (r = 0.88), confirming that the same profiles were accurately identified between the two images. The linear fit intercepts the y-axis (distances in confocal images) at −0.35 μm. This is the fluorescence diffusion factor of the confocal measurements, indicating that when there is no gap between dendritic and axonal membranes, confocal images display an overlap of 0.35 μm. Red channels were pseudocolored magenta to aid in visualization. Scale in A and B = 10 μm. Scale in C and D = 1.5 μm. Scale in F and G = 160 nm.
Apposition verses coincidental fluorescence overlap
Any confocally imaged signal is associated with an undetermined amount of noise, leading to an error in fluorophore colocalization. The magnitude of this error is reduced when colocalization is based on objects of a defined size or shape rather than single voxels. In addition to apposition overlap identified based on our criterion (2–3 voxel overlap between an identified axon bouton and a dendrite), other overlapping voxels were present in our images. These overlapping voxels attributed to noise did not fit our criterion for apposition and putative synaptic interaction: there was no labeled axon bouton emanating from the overlap site and the size of the overlapping plaque was too small. In order to quantify the differences between these subjectively identified appositions and the random scattering of label voxels surrounding the dendritic tree, we quantified the volume of contiguous voxels overlapping a given segment of dendrite. When an apposition met our subjective criteria for a putative synapse (an apposition), the volume of the actual overlap was on average 10 times larger than the size of subjectively random occurring overlapping voxels (61.70 ± 22.73 [appositions] vs. 6.68 ± 0.67 [random] voxels; p < 0.001; t-test). This finding confirmed that the chance of false positive putative synapse identification due to fluorescence noise was negligible. Further, this result is in agreement with ultrastructural three-dimensional neuropil reconstructions from other labs demonstrating that the presence of a synapse is heavily dependent on the size of the ultrastructurally identified apposition (Mishchenko et al., 2010).
Selectivity of appositions and Monte Carlo modeling
If a dendrite segment is located in a field populated by dense afferent projections, could this lead to increased instances of appositions? In other words, are instances of appositions determined by biological selectivity or by stochastic opportunity? In order to compare the density of subjectively identified contacts (using the criteria described above) to the relative density of labeled voxels for CT and IX (respectively), confocal stacks containing all three fluorophores were analyzed. Individual segments of dendritic trees (approximately 10 – 20 μm in length) for 3 cells were selected and the following computations made: The density of subjective appositions by CT or IX (number of appositions per 100 μm2 dendritic surface area), the densities of CT- and IX-labeled voxels (separately) overlapping the dendrite (number of voxels per 100 μm2 dendritic surface area), and the percent of the total number of voxels labeled for CT or for IX (separately) within approximately 5 μm surrounding the dendritic surface (number of labeled voxels × 100/total voxels).
The density of subjectively identified appositions on each segment was weakly correlated with the percent of labeled voxels in the neuropil (CT: r = 0.19; IX: r = 0.33; Figures 8A–B) suggesting that instances of appositions reflect biological selectivity, rather than stochastic opportunity of axons present in the vicinity of the dendrite. Using Monte Carlo statistical modeling, we determined the stochastic relationship between the density of label surrounding and the density of label overlapping a theoretical dendrite. Random voxels were selected surrounding a 3-dimensional cylinder with the number selected increasing from 0.01% to 2% in 0.01% increments and this random selection was performed 100 times for each percentage (Figure 8C). The density of labeled voxels within the theoretical dendrite relative to the percent of voxels that were selected was then plotted and a linear equation fitted (ŷ = 56x + 0.0076) along with the 95% confidence intervals for this model (r = 0.96; Figure 8D).
Figure 8.

Non-stochastic Distribution of Putative Synaptic Sites. Monte Carlo statistical analyses reveals that appositions are not the result of stochastic chance overlap related to labeling density. The initial comparison of the subjective identification of contacts along a dendritic segment revealed a low correlation between contact density and the amount of label within a 5μm distance surrounding the dendrite (A) CT: r = 0.19. (B) IX: r = 0.33 indicating that the presence of a subjectively identified putative synaptic site was not simply due to the density of afferent label surround a given dendrite. However, as the presence of a synapse does depend on at least some amount of label being present, a Monte Carlo simulation was performed to determine the stochastic relationship between label density and contact density. (C) A theoretical dendritic cylinder was constructed in Matlab with the three-dimensional voxelated space surrounding it (inclusive of the inner perimeter of the cylinder) corresponding to the dimensions and resolution of the neuropil surrounding our actual dendritic segments (average length and diameter of those segments from A and B). A random assortment of voxels was then selected corresponding to 0.01 to 2% of the total space and the number of voxels falling within the cylinder’s perimeter was counted. The example here contained 0.1% of the voxels randomly selected. (D) The density of voxels overlapping the dendritic cylinder was plotted as a function of the percent of voxels selected and a linear equation fitted along with the 95% confidence interval (shaded region). (E & F) This linear equation (solid grey line) and its 95% confidence interval (dashed black lines and shaded region) were then compared with the observed data from the dendritic segments. Here the density of voxels overlapping the dendrite (rather than subjective contacts) was calculated (see Results for rationale). Both the chorda tympani (E) and glossopharyngeal (F) data displayed significant variance outside of the 95% confidence interval for the simulated model indicating that the voxel overlap was not stochastically determined by the density of label surrounding the dendrite.
This linear model was then compared to the data obtained from imaged dendritic segments revealing that the density of CT and IX voxels overlapping the dendritic segment relative to the density of label in the surrounding neuropil displayed a much larger variance than our theoretical linear model, suggesting that our overlap is not simply due to stochastic chance (Figure 8E–F). Likewise, the correlation between the overlap densities and the density of label in the neuropil was much lower for both CT and IX when compared to the theoretical model (Theoretical: r = 0.96 vs. CT: r = 0.523; IX: r = 0.213). Normalization of CT and IX populations to the linear equation from the stochastic model [y − (56x + 0.0076); where x is the observed percentage of labeled voxels, and y is the observed areal density of voxels overlapping the dendrite] resulted in a reduction in the correlation (CT: r = 0.213; IX: r = −0.208), indicating that the observed data represents a targeting that cannot be stochastically predicted by labeling density. Finally, there was no correlation between dendritic surface area and the density of voxels overlapping that dendrite (CT: r = 0.020; IX: r = 0.065), negating the necessity to perform the simulation at varying dendritic diameters or dendritic lengths.
CT and IX convergence
From the three animals that had triple labeling, 11 rNST to PBN projection neurons were imaged at a high magnification and high resolution, reconstructed, and CT and IX appositions mapped onto the dendritic trees (Figure 9). All of the neurons were located within the rostrocentral subdivision of the rNTS, and most (10 of 11) had cell bodies located within 600 μm of the rostral border of the rNTS at this horizontal level. Note that this does not correspond to the actual rostral tip of the rNTS due to the ventral-lateral incline of the nucleus. When compared to previous anatomical atlases based on coronal sections (Corson et al., 2012), these 10 neurons were located within 1000 μm of the rNTS rostral pole. A single neuron located approximately 300 μm caudal to the others was reconstructed, and although the cell body was also located in the rostrocentral subdivision, a single dendrite projected laterally into a region corresponding to the intermediate lateral subdivision. Only one other neuron spanned the presumed rostrocentral-rostrolateral subdivision border. Of these 11 neurons, 2 did not receive a contact from either CT or IX, 0 were contacted by only the CT nerve, 1 was contacted by only the IX nerve, and the remaining 8 were contacted by both nerves, indicating putative convergent innervation. There were no relationships between neuronal morphology (5 multipolar cells and 3 elongate cells) and the presence of convergence innervation. The density of contacts from either CT or IX was 4.22 ± 0.30 per 100 μm of dendrite, and did not differ between elongate and multipolar neurons (4.21 ± 0.56 vs. 4.24 ± 0.32, elongate vs. multipolar).
Figure 9.

Distribution of Convergently Innervated Ascending rNTS Projection Neurons in Functionally Distinct Regions of the Rostrocentral Subdivision. Each reconstructed neuron along with its innervation topography was placed into a subdivisional template of the rostral rNTS adapted from Corson et al. 2012 (viewed here in the horizontal plane). (A) A myelin-stained horizontal rNTS section reveals the histologically identified subdivision borders as well as the dorsal-ventral level of the convergently innervated neurons (dashed box represents region in B). (B) The cell body of each convergently innervated neuron was located in the rostrocentral subdivision. Even neurons that had cell bodies located near the rostrocentral-rostrolateral border sent the majority of their dendrites medially into the rostrocentral subdivision. As very few neurons were labeled in the rostrolateral subdivision (see Figure 1) and the majority of the terminal field overlap at this dorsal-ventral plane is in the rostrocentral subdivision, no neurons were reconstructed from the rostrolateral subdivision. (C) Multipolar and (D) elongate neurons from B) are depicted individually, demonstrating a range of innervation patterns. Criteria for multipolar and elongate neuron morphology were emergence of more than 2 dendrites from soma (multipolar) and ovoid soma morphology (elongate). Small roman numerals correspond to those in (B) to aid in cell identification. Note that cell xi* is located caudal to the field of view in (B). 4V = Fourth ventricle. DCN = Dorsal cochlear nucleus. M = Medial rNTS subdivision, RC = Rostrocentral rNTS subdivision, RL = Rostrolateral rNTS subdivision. Scale in A = 750 μm. A–P measurements are anterior to area postrema and M–L measurements are lateral to the midline.
Compartmentalization of inputs was observed on segments of the dendritic tree for select multipolar neurons (3 out of 5 convergently innervated multipolar neurons and 0 out of 3 convergently innervated elongate neurons). For example, Figure 10A–D represents a multipolar neuron with convergent input onto a single dendritic tree. Here, CT input targeted the proximal and far distal portions of the dendrite while IX input targeted the intermediate dendrite portions. The distributions of inputs in relation to their distance from the cell soma were statistically different (Mann-Whitney U; p < 0.005). The far distal CT inputs were encompassed in a dense portion of the IX terminal field and only innervated the neuron after 3 to 5 branch points from the proximal CT input. Thus, it is likely that these are two distinct populations of CT afferents, and may convey different aspects of the orosensory information. IX afferents contact the dendritic tree intermediate to the two populations of CT input, and will thus likely have a greater influence on the cell’s firing than the distal CT fibers, but less of an influence than the proximal CT fibers (see Discussion). This neuron also displayed a compartmentalization of inputs on the convergently innervated dendritic tree. Both nerves only contacted 2 of the 10 dendritic segments (dendritic expanse between branch points) on this tree. The remaining 8 segments were only contacted by one of the nerves. A nearest neighbor analysis revealed that inputs are more likely to have a nearest neighbor input from the same afferent nerve (single sample t-test, p < 0.0001). A comparison of the ratio of CT:IX inputs on each branch segment revealed that each branch was more likely to be dominated by a single afferent nerve, than equally distribute inputs (single sample t-test, p < 0.001). The cell in Figure 10E–H is a multipolar neuron with a different pattern of convergent innervation. Here many of the dendritic trees received input from both nerves, but rather than a segregation along the electrotonic distance from the soma (Mann-Whitney U, p > 0.01), this cell has inputs segregated to individual segments of the dendritic tree. A nearest neighbor analysis revealed that inputs are more likely to have a nearest neighbor input from the same afferent nerve (single sample t-test, p < 0.0001). A comparison of the ratio of CT:IX inputs on each branch segment revealed that each branch was more likely to be dominated by a single afferent nerve, than equally distribute inputs (single sample t-test, p < 0.00001). This may create an isolation of the various inputs allowing for localized signal strengthening (see Discussion). The cell in Figure 10I–L is an elongate neuron with convergent input, but does not display such a compartmentalization. Contacts from both nerves were scattered throughout the dendritic tree with no preference for electrotonic distance from the soma (Mann-Whitney U, p > 0.01) or individual dendritic segments (nearest neighbor and CT:IX ratio single sample t-tests, p>0.01). Half of the innervated branch segments were contacts by both afferent nerves. These three neurons had dendritic orientations parallel to the solitary tract. While the low sample size precludes rigorous statistical comparisons between cell types, it is of note that while the abovementioned compartmentalization of inputs was observed only on multipolar neurons, not all multipolar neurons displayed such compartmentalization.
Figure 10.

Convergent Innervation Compartmentalization. Examples of innervation patterning onto two multipolar cells (A–D and E–H) and one elongate cell (I–L) receiving convergent innervation from the chorda tympani (CT; red circles) and glossopharyngeal (IX; blue triangles). These cells are also depicted in Figure 9. (B, F, J) A polar histogram of the dendritic orientation shows that the dendrites of all three cells traverse the rNTS roughly parallel to the solitary tract (red line). (C, G, K) For the cell in A, contacts from CT and IX are differentially distributed along the electrotonic dendritic distance from the cell body with CT contacts along the proximal and far distal portions, and IX contacts along the intermediate portions. The other two cells did not display such compartmentalization. (D, H, L) For the cells in A and B, contacts from CT and IX are largely isolated to individual branch segments. The cell in C did not display such a compartmentalization. Note that both types of compartmentalization were only present in multipolar cells although the unavoidably low sample size precludes statistical comparisons between cell types.
Discussion
The present study provides the first anatomical evidence of afferent nerve convergence onto individual neurons in the rNTS. It also substantiates a technique suitable for the investigation of putative synaptic innervation patterns in neural circuits. Using electron microscopy and Monte Carlo statistical modeling, we confirm that the distance between confocally-identified processes can be accurately determined as long as overlapping signals in the fluorophores can be resolved, and that confocally-identified appositions are not simply an outcome of stochastic interactions with surrounding label density. We also show that chorda tympani and glossopharyngeal fibers converge onto ascending projection neurons in the rostrocentral subdivision (Figure 8), and that while this convergence does not display specificity for cell morphology, inputs onto multipolar neurons are often clustered and compartmentalized onto differing portions of the dendritic tree.
Methodological considerations
The presence of a synapse between neuronal elements cannot be ascertained without utilizing electron microscopic resolution. However, when identifying specific synaptic inputs onto a given neuron, the use of electron microscopy is not feasible. The area of tissue that can be examined with electron microscopy is limited (1×2 mm for single section analysis and 0.8×0.05−0.02 mm for serial section analysis) and immunostaining penetration into tissue is limited (5–10 μm for DAB, and less for metal conjugated chromagens). Confocal microscopy is an invaluable tool for visualizing multiple tract-tracings and neuronal morphology. With the capacity to examine large (unlimited) and thick (up to 100 μm) tissue sections, confocal microscopy is ideal for examining the connectivity of inputs onto individual cells, with the proviso that observed appositions can only be presumed to be synapses. Thus, it is very important to ascertain that the confocal imaging parameters do not introduce factors that increase the uncertainty level of ‘presumed synapse’ identification. It should be noted that the use of electron microscopy in this study was not intended to confirm that each apposition identified at the confocal level was actually a synapse, a feat unfeasible technically and unreasonable experimentally. Undertaking such a monumental task of ultrastructural 3D reconstruction of triple-immunostained tissue preempts the need for confocal imaging in the first place. Rather, we used this technique to confirm the validity of our criterion to identify appositions in confocal images. Nevertheless, our electron microscopic analysis of confocally-scanned tissue has allowed us to confirm several instances of confocal appositions that are indeed synaptic. We also confirmed that every instance of fluorophore-labeled profiles identified as non-apposed were indeed separated by other neuropil. Furthermore, by correlating the distances between two labeled elements measured both on confocal and EM material, we demonstrated that confocal image resolution had a −0.35 μm discrepancy (confocal images overestimated distances by 0.35 μm, in comparison to EM), a distance that is equivalent to the lower limit of our apposition criterion.
The use of synaptic markers (e.g. synaptophysin and PSD-95) to confirm the presence or absence of synapses at the confocal level has proven useful in studies attempting to identify functional connections at the light microscopic level (Melone et al., 2005; Colonnese and Constantine-Paton, 2006). However, this approach is limited in its ability to perform the level of analysis undertaken in this study. First, use of presynaptic markers, such as synaptophysin or synapsin, is not ideal. The presence of docked synaptic vesicles only confirms that the bouton is presynaptic, not where on the bouton a synapse is located. Further, the immunoreactivity is limited to the surface 10 μm of tissue and decreases rapidly after the first 2 μm (Melone et al., 2005). As our contacts of interest were located throughout the entire depth of our tissue, limiting our sample of putative synapses to the surface of the tissue would be inefficient at best. Also, as we are already using triple immunofluorescence for our multiple tract tracings, adding in another fluorophore to mark synaptic proteins would be unfeasible with the equipment utilized in this study. Further, with markers for proteins clustered in small areas, such as postsynaptic density proteins, the differentiation between background labeling and actual signal can be problematic, limiting most studies to examine relative rather than absolute levels of protein expression. As such, we chose to use electron microscopic ultrastructural confirmation rather than immunofluorescence, despite the increased technical difficulty inherent to large-scale ultrastructural reconstructions combined with correlated structure identification at light and electron microscopic levels.
The confirmation of confocal apposition criterion could only be performed in x-y planes. Even with deconvolution, fluorescent spread remains in the axial (z) plane and thus, the overlap in fluorophores would have to be greater for the two processes to be considered putatively synaptically connected. However, we are unable to ultrastructurally confirm these distances in the axial plane, which would require a transverse ultrathin sectioning of the 30 μm section. Also, we were only able to perform the analysis on tetramethylrhodamine labeled afferents, rather than Cascade Blue immuno-converted to Cy5. While it is likely that the two fluorophores have a different fluorescent spread due to differences in emitted wavelength, this was minimized as much as possible with Autoquant’s theoretical point spread function, which accounts for the fluorophore’s wavelength. Thus, while the difference in fluorescent spread likely persists, we consider its impact on the current analysis to be minimal.
Application of methodology
One of the major strengths of this undertaking is the applicability of these techniques to be used in other systems. While other studies have made efforts to accurately identify innervation patterning at the light microscopic level, there have been a number of shortcomings leading to the conclusion that the methodology is unreliable to address these questions (Cabirol-Pol et al., 2000; da Costa and Martin, 2009). These shortcomings have ranged from using a sub-optimal resolution at the confocal microscopy level, to using brightfield microscopy rather than fluorescence to identify apposing processes, both cases likely resulting in the false-positive identification of apposing processes. For example, in a carefully executed study, approximately half of the non-synaptic light microscopically identified appositions were actually separated by unidentified profiles (da Costa and Martin, 2009). Thus, being able to accurately resolve apposing processes would allow for higher confidence in identifying actual innervation patterning. Here, we used the fluorescent spread of high-resolution confocal microscopic z-stacks to reveal putative synaptic contacts, with the assumption being that fluorescent spread and the relatively lower resolution of light microscopy would necessitate that two objects not be merely touching, but partially superimposed on each other. Our comparison of object distances measured on the confocal and electron microscopes revealed just that: In order to be confident in the apposition of two processes, at least a two-voxel overlap was necessary at the confocal resolution. The confirmation of apposition criterion that is used in this study should be valid for other studies using similar confocal objective magnification and scanning resolution (60x oil immersion objective [N.A. 1.4 with a 1.5x optical zoom] and 0.15 μm scanning resolution, yielding a 0.15 μm3 voxel size).
Convergence in the Orosensory rNTS
In addition to the extensive technique development, this study represents the first anatomical demonstration of convergence of the chorda tympani and glossopharyngeal nerves onto projection neurons in the rostral nucleus of the solitary tract. Many neurons in the rNTS are primed to receive inputs from multiple afferent terminal fields as their dendrites are often oriented parallel to the solitary tract in the horizontal plane, extending through multiple terminal fields (Davis and Jang, 1988; King and Bradley, 1994). Attempts to correlate cellular morphology with physiological and biophysical properties have been relatively inconclusive (King and Bradley, 1994; Renehan et al., 1996), indicating that subpopulations of neurons exist within each morphological class. This investigation into the convergent innervation of these neurons provides further insights allowing for an innervation-based sub-classification of cellular morphology, elucidating specificity. Not every multipolar cell encountered received convergent innervation and convergently innervated neurons often displayed varying forms of input compartmentalization. Likewise, elongate neurons, although receiving convergent innervation, did not display such compartmentalization, though a low sample size certainly cannot rule out such input clustering for all subpopulations. Interestingly, recent advances in whole cell physiology and calcium imaging have revealed that dendrites have active processes that can enhance distal input signals through nonlinear summation of clustered inputs (Takahashi et al., 2012). This can occur via dendritic spikes through voltage-gated calcium and sodium channels, and can even result in local dendritic plasticity (Larkum and Nevian, 2008). Given the degree of clustering present on many convergently innervated rNTS-PBN neurons, such non-linear summative mechanisms are likely. Future studies combining whole cell recordings of neurons in the rNTS with high resolution anatomical circuit reconstruction (as shown here) will reveal further complexities in the dendritic encoding of convergent innervation in the rNTS. This will allow for a circuit-based classification of neurons in addition to morphological and biophysical properties, providing a greater understanding of the functional organization of the gustatory nucleus of the solitary tract.
The identification of chorda tympani and glossopharyngeal nerve convergence onto individual rNTS neurons opens a wide range of possible implications for sensory processing. For instance, do converging afferent fibers from different nerves convey similar stimulus tuning properties? Or rather do these nerves decrease the tuning specificity of individual rNST neurons by allowing the converged upon neuron to integrate multiple gustatory qualities? Indeed, other labs have demonstrated that the tuning specificity of individual rNTS neurons is variable, indicative of a functionally heterogeneous population (Renehan et al., 1996; Geran and Travers, 2006). When compared to other rNTS neuron populations, ascending projection neurons respond with a broader tuning breadth across multiple tastants (Monroe and Di Lorenzo, 1995). This response profile may be attributed to broadly tuned afferent fibers. However, in light of the current study, it is possible that the convergence between afferent nerves onto individual ascending projection neurons may also increase tuning breadth. This lack of specificity for ascending projection neurons underlies the importance of a temporal, across-fiber pattern for encoding stimulus qualities (Di Lorenzo et al., 2009; Chen et al., 2011; Rosen and Di Lorenzo, 2012).
This temporal pattern may be modulated by the location of the responsive taste buds within the oral cavity as well. The morphology of fungiform papillae on the anterior tongue and foliate and circumvallate papillae on the posterior tongue likely results in temporal variability of innervating fiber responses. Taste buds on the posterior tongue are contained in trenches that make stimulus delivery and removal more difficult than the fungiform contained taste buds of the anterior tongue (Frank, 1991; Halsell et al., 1993). As such, activation of these receptors likely occurs through tongue movement and compression during mastication. Neurons receiving innervation from both oral cavity regions through convergent input of the chorda tympani and glossopharyngeal nerves thus would receive differential activation patterning during natural behaving. Chorda tympani afferents would be activated during exploratory sampling while glossopharyngeal afferents would be activate during mastication and ingestion (Spector and Glendinning, 2009). Thus, the complexities of converging information streams from these nerves are further compounded by temporal variations due to taste papillae morphologies. Future investigations into sensory encoding through the convergence of chorda tympani and glossopharyngeal nerves will undoubtedly reveal response dynamic subtleties that will lead us closer to understanding information processing in the rostral nucleus of the solitary tract.
Acknowledgments
We would like to thank Dr. David Hill for sharing expertise on afferent nerve surgeries and for critical reading of this manuscript. Funding Source - NIH-NIDCD R01DC10183
ROLE OF AUTHORS: Both authors had full access to all the data in the study, and they both take responsibility for the integrity of the data and the accuracy of the data analysis. Study concept and design: AE, JC. Tracer injections, tissue preparation and acquisition of data: JC. Analysis and interpretation of data: JC, AE. Drafting of the manuscript: JC, AE. Obtained funding: AE. Study supervision: AE.
Footnotes
CONFLICT OF INTEREST: Authors declare no conflict of interest.
References
- Biedenbach MA, Chan KY. Tongue mechanoreceptors: comparison of afferent fibers in the lingual nerve and chorda tympani. Brain Res. 1971;35(2):584–588. doi: 10.1016/0006-8993(71)90507-5. [DOI] [PubMed] [Google Scholar]
- Breza JM, Curtis KS, Contreras RJ. Temperature modulates taste responsiveness and stimulates gustatory neurons in the rat geniculate ganglion. J Neurophysiol. 2006;95(2):674–685. doi: 10.1152/jn.00793.2005. [DOI] [PubMed] [Google Scholar]
- Breza JM, Nikonov AA, Contreras RJ. Response latency to lingual taste stimulation distinguishes neuron types within the geniculate ganglion. J Neurophysiol. 2010;103(4):1771–1784. doi: 10.1152/jn.00785.2009. [DOI] [PMC free article] [PubMed] [Google Scholar]
- Cabirol-Pol MJ, Mizrahi A, Simmers J, Meyrand P. Combining laser scanning confocal microscopy and electron microscopy to determine sites of synaptic contact between two identified neurons. J Neurosci Methods. 2000;97(2):175–181. doi: 10.1016/s0165-0270(00)00184-9. [DOI] [PubMed] [Google Scholar]
- Campbell RE, Gaidamaka G, Han SK, Herbison AE. Dendro-dendritic bundling and shared synapses between gonadotropin-releasing hormone neurons. Proc Natl Acad Sci U S A. 2009;106(26):10835–10840. doi: 10.1073/pnas.0903463106. [DOI] [PMC free article] [PubMed] [Google Scholar]
- Chen JY, Victor JD, Di Lorenzo PM. Temporal Coding of Intensity of NaCl and HCl in the Nucleus of the Solitary Tract of the Rat. J Neurophysiol. 2011;105(2):697–711. doi: 10.1152/jn.00539.2010. [DOI] [PMC free article] [PubMed] [Google Scholar]
- Colonnese MT, Constantine-Paton M. Developmental period for N-methyl-D-aspartate (NMDA) receptor-dependent synapse elimination correlated with visuotopic map refinement. J Comp Neurol. 2006;494(5):738–751. doi: 10.1002/cne.20841. [DOI] [PMC free article] [PubMed] [Google Scholar]
- Corson J, Aldridge A, Wilmoth K, Erisir A. A survey of oral cavity afferents to the rat nucleus tractus solitarii. J Comp Neurol. 2012;520(3):495–527. doi: 10.1002/cne.22715. [DOI] [PMC free article] [PubMed] [Google Scholar]
- Corson J, Nahmani M, Lubarsky K, Badr N, Wright C, Erisir A. Sensory activity differentially modulates N-methyl-D-aspartate receptor subunits 2A and 2B in cortical layers. Neuroscience. 2009;163(3):920–932. doi: 10.1016/j.neuroscience.2009.07.016. [DOI] [PMC free article] [PubMed] [Google Scholar]
- da Costa NM, Martin KA. Selective targeting of the dendrites of corticothalamic cells by thalamic afferents in area 17 of the cat. J Neurosci. 2009;29(44):13919–13928. doi: 10.1523/JNEUROSCI.2785-09.2009. [DOI] [PMC free article] [PubMed] [Google Scholar]
- Davis BJ. Computer-generated rotation analyses reveal a key three-dimensional feature of the nucleus of the solitary tract. Brain Res Bull. 1988;20(5):545–548. doi: 10.1016/0361-9230(88)90213-4. [DOI] [PubMed] [Google Scholar]
- Davis BJ, Jang T. A Golgi analysis of the gustatory zone of the nucleus of the solitary tract in the adult hamster. J Comp Neurol. 1988;278(3):388–396. doi: 10.1002/cne.902780308. [DOI] [PubMed] [Google Scholar]
- De Paola V, Holtmaat A, Knott G, Song S, Wilbrecht L, Caroni P, Svoboda K. Cell typespecific structural plasticity of axonal branches and boutons in the adult neocortex. Neuron. 2006;49(6):861–875. doi: 10.1016/j.neuron.2006.02.017. [DOI] [PubMed] [Google Scholar]
- Di Lorenzo PM, Chen JY, Victor JD. Quality time: representation of a multidimensional sensory domain through temporal coding. J Neurosci. 2009;29(29):9227–9238. doi: 10.1523/JNEUROSCI.5995-08.2009. [DOI] [PMC free article] [PubMed] [Google Scholar]
- Erickson R. Nontraumatic headholders for Mammals. Physiol Behav. 1966;1(1):97–98. [Google Scholar]
- Erisir A, Levey AI, Aoki C. Muscarinic receptor M(2) in cat visual cortex: laminar distribution, relationship to gamma-aminobutyric acidergic neurons, and effect of cingulate lesions. J Comp Neurol. 2001;441(2):168–185. doi: 10.1002/cne.1405. [DOI] [PubMed] [Google Scholar]
- Erisir A, Van Horn SC, Bickford ME, Sherman SM. Immunocytochemistry and distribution of parabrachial terminals in the lateral geniculate nucleus of the cat: a comparison with corticogeniculate terminals. J Comp Neurol. 1997;377(4):535–549. [PubMed] [Google Scholar]
- Frank ME. Taste-responsive neurons of the glossopharyngeal nerve of the rat. J Neurophysiol. 1991;65(6):1452–1463. doi: 10.1152/jn.1991.65.6.1452. [DOI] [PubMed] [Google Scholar]
- Geran LC, Travers SP. Single neurons in the nucleus of the solitary tract respond selectively to bitter taste stimuli. J Neurophysiol. 2006;96(5):2513–2527. doi: 10.1152/jn.00607.2006. [DOI] [PubMed] [Google Scholar]
- Grabauskas G, Bradley RM. Synaptic interactions due to convergent input from gustatory afferent fibers in the rostral nucleus of the solitary tract. J Neurophysiol. 1996;76(5):2919–2927. doi: 10.1152/jn.1996.76.5.2919. [DOI] [PubMed] [Google Scholar]
- Grill HJ, Norgren R. The taste reactivity test. II. Mimetic responses to gustatory stimuli in chronic thalamic and chronic decerebrate rats. Brain Res. 1978;143(2):281–297. doi: 10.1016/0006-8993(78)90569-3. [DOI] [PubMed] [Google Scholar]
- Halsell CB, Travers JB, Travers SP. Gustatory and tactile stimulation of the posterior tongue activate overlapping but distinctive regions within the nucleus of the solitary tract. Brain Res. 1993;632(1–2):161–173. doi: 10.1016/0006-8993(93)91151-h. [DOI] [PubMed] [Google Scholar]
- Halsell CB, Travers SP, Travers JB. Ascending and descending projections from the rostral nucleus of the solitary tract originate from separate neuronal populations. Neuroscience. 1996;72(1):185–197. doi: 10.1016/0306-4522(95)00528-5. [DOI] [PubMed] [Google Scholar]
- King MS, Bradley RM. Relationship between structure and function of neurons in the rat rostral nucleus tractus solitarii. J Comp Neurol. 1994;344(1):50–64. doi: 10.1002/cne.903440105. [DOI] [PubMed] [Google Scholar]
- Knott GW, Holtmaat A, Trachtenberg JT, Svoboda K, Welker E. A protocol for preparing GFP-labeled neurons previously imaged in vivo and in slice preparations for light and electron microscopic analysis. Nat Protoc. 2009;4(8):1145–1156. doi: 10.1038/nprot.2009.114. [DOI] [PubMed] [Google Scholar]
- Knott GW, Holtmaat A, Wilbrecht L, Welker E, Svoboda K. Spine growth precedes synapse formation in the adult neocortex in vivo. Nat Neurosci. 2006;9(9):1117–1124. doi: 10.1038/nn1747. [DOI] [PubMed] [Google Scholar]
- Larkum ME, Nevian T. Synaptic clustering by dendritic signalling mechanisms. Curr Opin Neurobiol. 2008;18(3):321–331. doi: 10.1016/j.conb.2008.08.013. [DOI] [PubMed] [Google Scholar]
- Li J, Erisir A, Cline H. In vivo time-lapse imaging and serial section electron microscopy reveal developmental synaptic rearrangements. Neuron. 2011;69(2):273–286. doi: 10.1016/j.neuron.2010.12.022. [DOI] [PMC free article] [PubMed] [Google Scholar]
- Matsuo R, Inoue T, Masuda Y, Nakamura O, Yamauchi Y, Morimoto T. Neural activity of chorda tympani mechanosensitive fibers during licking behavior in rats. Brain Res. 1995;689(2):289–298. doi: 10.1016/0006-8993(95)00582-b. [DOI] [PubMed] [Google Scholar]
- May OL, Erisir A, Hill DL. Ultrastructure of primary afferent terminals and synapses in the rat nucleus of the solitary tract: comparison among the greater superficial petrosal, chorda tympani, and glossopharyngeal nerves. J Comp Neurol. 2007;502(6):1066–1078. doi: 10.1002/cne.21371. [DOI] [PMC free article] [PubMed] [Google Scholar]
- May OL, Hill DL. Gustatory terminal field organization and developmental plasticity in the nucleus of the solitary tract revealed through triple-fluorescence labeling. J Comp Neurol. 2006;497(4):658–669. doi: 10.1002/cne.21023. [DOI] [PMC free article] [PubMed] [Google Scholar]
- Melone M, Burette A, Weinberg RJ. Light microscopic identification and immunocytochemical characterization of glutamatergic synapses in brain sections. J Comp Neurol. 2005;492(4):495–509. doi: 10.1002/cne.20743. [DOI] [PubMed] [Google Scholar]
- Mishchenko Y, Hu T, Spacek J, Mendenhall J, Harris KM, Chklovskii DB. Ultrastructural analysis of hippocampal neuropil from the connectomics perspective. Neuron. 2010;67(6):1009–1020. doi: 10.1016/j.neuron.2010.08.014. [DOI] [PMC free article] [PubMed] [Google Scholar]
- Monroe S, Di Lorenzo PM. Taste responses in neurons in the nucleus of the solitary tract that do and do not project to the parabrachial pons. J Neurophysiol. 1995;74(1):249–257. doi: 10.1152/jn.1995.74.1.249. [DOI] [PubMed] [Google Scholar]
- Moore DR. Anatomy and physiology of binaural hearing. Audiology. 1991;30(3):125–134. doi: 10.3109/00206099109072878. [DOI] [PubMed] [Google Scholar]
- Nahmani M, Erisir A. VGluT2 immunochemistry identifies thalamocortical terminals in layer 4 of adult and developing visual cortex. J Comp Neurol. 2005;484(4):458–473. doi: 10.1002/cne.20505. [DOI] [PubMed] [Google Scholar]
- Ogawa H, Sato M, Yamashita S. Multiple sensitivity of chorda typani fibres of the rat and hamster to gustatory and thermal stimuli. J Physiol. 1968;199(1):223–240. doi: 10.1113/jphysiol.1968.sp008650. [DOI] [PMC free article] [PubMed] [Google Scholar]
- Piovesan EJ, Kowacs PA, Oshinsky ML. Convergence of cervical and trigeminal sensory afferents. Current pain and headache reports. 2003;7(5):377–383. doi: 10.1007/s11916-003-0037-x. [DOI] [PubMed] [Google Scholar]
- Renehan WE, Jin Z, Zhang X, Schweitzer L. Structure and function of gustatory neurons in the nucleus of the solitary tract: II. Relationships between neuronal morphology and physiology. J Comp Neurol. 1996;367(2):205–221. doi: 10.1002/(SICI)1096-9861(19960401)367:2<205::AID-CNE4>3.0.CO;2-9. [DOI] [PubMed] [Google Scholar]
- Rosen AM, Di Lorenzo PM. Neural Coding of Taste by Simultaneously Recorded Cells in the Nucleus of the Solitary Tract of the Rat. J Neurophysiol. 2012 doi: 10.1152/jn.00566.2012. [DOI] [PMC free article] [PubMed] [Google Scholar]
- Schmued L, Slikker W., Jr Black-gold: a simple, high-resolution histochemical label for normal and pathological myelin in brain tissue sections. Brain Res. 1999;837(1–2):289–297. doi: 10.1016/s0006-8993(99)01624-8. [DOI] [PubMed] [Google Scholar]
- Schmued LC. A rapid, sensitive histochemical stain for myelin in frozen brain sections. J Histochem Cytochem. 1990;38(5):717–720. doi: 10.1177/38.5.1692056. [DOI] [PubMed] [Google Scholar]
- Smith KG, Yates JM, Robinson PP. The effect of nerve growth factor on functional recovery after injury to the chorda tympani and lingual nerves. Brain Res. 2004;1020(1–2):62–72. doi: 10.1016/j.brainres.2004.06.006. [DOI] [PubMed] [Google Scholar]
- Spector AC, Glendinning JI. Linking peripheral taste processes to behavior. Curr Opin Neurobiol. 2009;19(4):370–377. doi: 10.1016/j.conb.2009.07.014. [DOI] [PMC free article] [PubMed] [Google Scholar]
- Takahashi N, Kitamura K, Matsuo N, Mayford M, Kano M, Matsuki N, Ikegaya Y. Locally synchronized synaptic inputs. Science. 2012;335(6066):353–356. doi: 10.1126/science.1210362. [DOI] [PubMed] [Google Scholar]
- Todd AJ. Neuronal circuitry for pain processing in the dorsal horn. Nat Rev Neurosci. 2010;11(12):823–836. doi: 10.1038/nrn2947. [DOI] [PMC free article] [PubMed] [Google Scholar]
- Travers JB. Efferent projections from the anterior nucleus of the solitary tract of the hamster. Brain Res. 1988;457(1):1–11. doi: 10.1016/0006-8993(88)90051-0. [DOI] [PubMed] [Google Scholar]
- Travers SP, Norgren R. Organization of orosensory responses in the nucleus of the solitary tract of rat. J Neurophysiol. 1995;73(6):2144–2162. doi: 10.1152/jn.1995.73.6.2144. [DOI] [PubMed] [Google Scholar]
- Travers SP, Pfaffmann C, Norgren R. Convergence of lingual and palatal gustatory neural activity in the nucleus of the solitary tract. Brain Res. 1986;365(2):305–320. doi: 10.1016/0006-8993(86)91642-2. [DOI] [PubMed] [Google Scholar]
- Whitehead MC. Anatomy of the gustatory system in the hamster: synaptology of facial afferent terminals in the solitary nucleus. J Comp Neurol. 1986;244(1):72–85. doi: 10.1002/cne.902440106. [DOI] [PubMed] [Google Scholar]
- Whitehead MC. Neuronal architecture of the nucleus of the solitary tract in the hamster. J Comp Neurol. 1988;276(4):547–572. doi: 10.1002/cne.902760409. [DOI] [PubMed] [Google Scholar]
- Whitehead MC. Subdivisions and neuron types of the nucleus of the solitary tract that project to the parabrachial nucleus in the hamster. J Comp Neurol. 1990;301(4):554–574. doi: 10.1002/cne.903010406. [DOI] [PubMed] [Google Scholar]
- Whiteside B. Nerve overlap in the gustatory apparatus of the rat. J Comp Neurol. 1927;44:363–377. [Google Scholar]
- Woods JW. Behavior of Chronic Decerebrate Rats. J Neurophysiol. 1964;27:635–644. doi: 10.1152/jn.1964.27.4.635. [DOI] [PubMed] [Google Scholar]
- Wouterlood FG. 3-D reconstruction of neurons from multichannel confocal laser scanning image series. Curr Protoc Neurosci. 2005;Chapter 2(Unit 2 8) doi: 10.1002/0471142301.ns0208s32. [DOI] [PubMed] [Google Scholar]
- Wouterlood FG, Boekel AJ, Aliane V, Belien JA, Uylings HB, Witter MP. Contacts between medial and lateral perforant pathway fibers and parvalbumin expressing neurons in the subiculum of the rat. Neuroscience. 2008a;156(3):653–661. doi: 10.1016/j.neuroscience.2008.08.023. [DOI] [PubMed] [Google Scholar]
- Wouterlood FG, Boekel AJ, Kajiwara R, Belien JA. Counting contacts between neurons in 3D in confocal laser scanning images. Journal of neuroscience methods. 2008b;171(2):296–308. doi: 10.1016/j.jneumeth.2008.03.014. [DOI] [PubMed] [Google Scholar]
- Yamada K. The glossophyaryngeal nerve response to taste and thermal stimuli in the rat, rabbit and cat. Kumamoto Med J. 1965;18(2):106–108. [PubMed] [Google Scholar]
- Yamada K. Gustatory and thermal responses in the glossopharyngeal nerve of the rat. Jpn J Physiol. 1966;16(6):599–611. doi: 10.2170/jjphysiol.16.599. [DOI] [PubMed] [Google Scholar]
- Yamamoto T, Kawamura Y. Dual Innervation of the Foliate Papillae of the Rat: An Electrophysiological Study. Chemical Senses and Flavor. 1975;1:241–244. [Google Scholar]
- Yamashita S, Sato M. The effects of temperature on gustatory response of rats. J Cell Physiol. 1965;66(1):1–17. doi: 10.1002/jcp.1030660102. [DOI] [PubMed] [Google Scholar]
- Zito K, Scheuss V, Knott G, Hill T, Svoboda K. Rapid functional maturation of nascent dendritic spines. Neuron. 2009;61(2):247–258. doi: 10.1016/j.neuron.2008.10.054. [DOI] [PMC free article] [PubMed] [Google Scholar]