

Abstract
Human populations have undergone dramatic changes in population size in the past 100,000 years, including recent rapid growth. How these demographic events have affected the burden of deleterious mutations in individuals and the frequencies of disease mutations in populations remains unclear. We use population genetic models to show that recent human demography has likely had little impact on the average burden of deleterious mutations. This prediction is supported by two exome sequence datasets showing that individuals of west African and European ancestry carry very similar burdens of damaging mutations. We further show that for many diseases, rare alleles are unlikely to contribute a large fraction of the heritable variation, and therefore the impact of recent growth is likely to be modest. However, for those diseases that have a direct impact on fitness, strongly deleterious rare mutations likely do play an important role, and recent growth will have increased their impact.
Recent work has highlighted the impact of demographic history on the distribution of human genetic variation. Deep sequencing studies have identified huge numbers of very rare variants in human populations, the consequence of explosive population growth in the past five thousand years1–6. Additionally, Europeans and east Asians have a greater fraction of high-frequency variants compared to Africans, likely due to an ancient bottleneck of non-African populations5, 7, 8–10.
Given these observations, it is natural to ask whether recent demographic history has impacted the burden of genetic disease in modern human populations3, 6, 11,12. Keinan and Clark3 recently hypothesized that “Some degree of genetic risk for complex disease may be due to this recent rapid increase in the number of rare variants in the human population”. A second important question concerns the relative importance of rare and common variants in causing disease13–15. If much of the genetic variation underlying disease is due to rare variants, then this could help to explain the so-called “missing heritability” of complex traits, and imply that mapping approaches based on deep sequencing will be essential for the dissection of complex traits16.
Results
To address these questions, we analyzed a theoretical model with a large number of bi-allelic sites, each subject to two-way mutation, and natural selection against one of the alleles (see Methods for details). We studied three types of demographic models thought to be relevant for human populations: (i) a bottleneck; (ii) exponential growth starting from a constant-sized population; and (iii) a complex demographic model for African Americans (including rapid recent growth) and European Americans (including two bottlenecks followed by growth) inferred by Tennessen et al.5. The main features of the Tennessen model are similar to other recent models9, 10, 17 while using a larger data set for parameter estimation. Our main results focus on selection against semi-dominant (i.e., additive) alleles in which the three genotypes have fitnesses 1, 1 − s/2 and 1 − s, respectively; and selection against recessive alleles with genotype fitnesses 1, 1, and 1 − s. The effects of demography in these two models are qualitatively representative of those over the range of dominance coefficients (Supplement Section 2.4). In addition to simulation results shown here, further results and detailed theoretical analysis for all our key results are provided in the Supplement.
The impact of demographic changes on individual load
We focus first on the impact of demographic changes on individual load – that is, we want to understand whether demographic history has impacted the burden of deleterious variation carried by a typical individual in a population. Individual load is directly related to the number of deleterious alleles carried by an individual, or for recessive mutations to the number of homozygous sites per individual (see the Methods and Supplement for further details).
Figure 1 illustrates the impact of a bottleneck and population growth on the numbers of deleterious variants with strong selection (s=1%). As expected, these demographic events have a major impact on the number and frequency spectra of deleterious variants: the bottleneck causes a decrease in the total number of segregating sites in a population due largely to loss of rare variants, while the mean frequency of alleles that survive increases. Meanwhile, exponential growth causes a rapid increase in the number of segregating sites due to a major influx of rare variants, but a consequent drop in the mean frequency at segregating sites. But despite these dramatic shifts in the overall frequency spectrum, the impact on genetic load – namely, the mean number of deleterious variants per individual and thus the average fitness – is much more subtle.
Figure 1. Time course of load and other key aspects of variation through a bottleneck (A) and exponential growth (B).

Each data line shows the expected number of variants, or alleles per MB, assuming semi-dominant mutations (C and D) or recessive mutations (E and F) with s = 1% and mutation rate per site per generation=10−8. Versions of these plots with linear scales can be found in Supplementary Figures 13, 14, and 16.
In the semi-dominant case, the load is essentially unaffected by these demographic events (Figures 1C and 1D). With growth, the increased number of segregating sites is exactly balanced by a decrease in mean frequency (and conversely for the bottleneck), so that the number of variants per individual stays constant. This kind of balance is predicted by classic mutation-selection balance models18, and can be shown to hold for general changes in population size, provided that selection is strong and deleterious alleles are at least partially dominant (Supplement, Section 2.3).
The behavior of the recessive model is more complicated (Figures 1E and 1F). In the bottleneck model, the mean number of deleterious variants per individual drops by 60% as a result of the bottleneck. This is due to the loss of rare alleles. However, during the bottleneck, some deleterious alleles drift to higher frequencies11, 19, contributing disproportionately to the number of homozygotes. This causes a transient increase in the number of deleterious homozygous sites per individual – i.e., the recessive load. Meanwhile, population growth has a less pronounced effect on recessive variation, leaving the mean number of deleterious alleles per individual unchanged, but causing a slight decrease in load.
More generally, the manner in which demography affects load varies with the degree of dominance and the strength of selection (Figure 2 and Supplement Table 1 & Section 2). The behavior of these models can be classified into three selection regimes (strong, weak and effectively neutral). In the strong selection case, i.e., where selection is much stronger than drift (approximately s ≥ 10−3 for semi-dominant mutations), deleterious variants are extremely unlikely to fix, and virtually all of the genetic load is due to segregating variation. In this range, we infer that human demography has had no impact on semi-dominant load (and more generally for mutations with at least some dominance component), and small effects on recessive load.
Figure 2. Changes in load due to changes in population size during the histories of European and African Americans for (A) semi-dominant and (B) recessive sites.
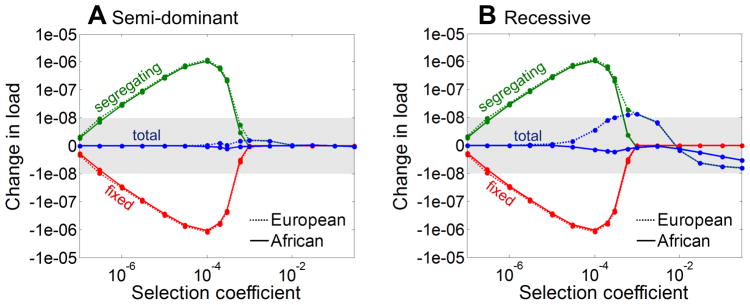
The blue lines denote the difference in load per base pair of DNA sequence in the present day population compared to the ancestral (constant) population size, as a function of selection coefficient. The green and red lines show the difference in load due to segregating and fixed variants, respectively. As can be seen, the increase in load due to segregating variation in modern populations approximately cancels out with the decrease in load due to fixed sites. The scale on the y-axis is linear within the grey region and logarithmic outside.
The weak selection case – where drift and selection have comparable effects – is more complex, as fixed alleles may contribute appreciably to load, and steady state load depends on population size20. However, the approach to steady state is very slow, being limited both by the time to fixation (on the order of 4N generations) and by the mutational input (on the order of 1/2NU generations). For both the semi-dominant and recessive cases, population growth is too recent to have substantially decreased the load. Recent growth increases the input of new deleterious mutations, but this effect is counterbalanced by the fact that the new deleterious mutations are proportionally rarer. The bottleneck in Europeans is estimated to have occurred farther in the past and at much lower population sizes5 (Supplement Figure 1), allowing it to have more effect. In this case, the increase in drift causes segregating deleterious alleles to increase in frequency, sometimes reaching fixation, and results in a slight increase in load (Supplement Figure 10). The out-of-Africa bottleneck should thus lead to a slight increase of load in Europeans, most notably for recessive sites.
Finally, in the effectively neutral range – where selection has negligible effects on the population dynamics – segregating variation contributes negligibly and hence the load does not change with demography. Thus, across all three selection regimes, recent human demographic history is likely to have had virtually no impact on genetic load at partially dominant sites, and only weak effects at recessive sites.
Analysis of exome data
To test these predictions, we analyzed two recent data sets of exome sequences from individuals of west African and European descent. Previous work comparing load in different populations has produced conflicting conclusions depending on the dataset, choice of measures and functional annotations. For example, Lohmueller et al.11 reported that there is “proportionally more deleterious variation in European than in African populations”. Similarly, Tennessen et al.5 found that European Americans had more non-reference genotypes when they used a conservative classification of deleterious sites, but observed the opposite when using a more liberal classification of sites (both observations were highly significant).
We first analyzed single nucleotide variant (SNV) frequency data from a recent exome sequencing study of 2,217 African Americans (AAs) and 4,298 European Americans (EAs) sequenced at 15,336 protein coding genes by Fu et al.6 (allele frequencies available from the NHLBI GO Exome Variant Server). Additionally, we analyzed exome data from 88 Yoruba (YRI) and 81 European (CEU) individuals collected by the 1000 Genomes Project21.
To test whether there are differences in load between individuals of west African and European descent, we considered the average number of derived alleles per individual at putatively deleterious segregating sites. For this purpose, a site is considered to be segregating if and only if it is variable within the combined sample of both populations. This definition ensures that the derived counts are comparable across populations. Under a semi-dominant model, the number of derived alleles increases monotonically with the segregating genetic load. Thus, any difference in average load between populations would be apparent as a difference in the mean number of derived alleles per individual. Here, we focused on an equivalent measure that also facilitates comparisons across different types of sites: namely, the mean derived allele frequency within functional classes. Note that the mean derived allele frequency is simply equal to the number of derived alleles per individual divided by twice the number of segregating sites in that class, and so any difference in the mean number of derived alleles per individual will also be a difference in mean derived frequencies. For sites that are either neutral or semi-dominant, our model predicts that the mean derived allele frequency should be virtually identical in Africans and Europeans (Figure 17, Supplement Section 3). At recessive sites, we expect a slight increase in mean derived frequency in Africans compared to Europeans (Supplement Figure 18), but overall we expect any differences to be small.
Functional predictions of SNVs were obtained from PolyPhen2, a method that uses sequence conservation and structural information to infer which non-synonymous changes are most likely to have functional consequences22; see Supplement Table 2 for similar analyses with other functional prediction methods. When using the functional predictions we observed a strong bias: SNVs where the genome reference carries the derived allele are much more likely to be classified as benign than SNVs where the reference allele is ancestral—this is true even when we control for the overall population frequency (Supplementary Figure 19). Hence our analysis incorporates a correction to account for this bias; we also obtained very similar results using a separate set of unpublished human-independent PolyPhen scores kindly provided by the Sunyaev lab (Supplement Table 4).
Figure 3 summarizes the results for the data of Fu et al. As expected, the mean allele frequency declines with increasing functional severity5, from 2.8% at noncoding SNVs to 0.6% at probably-damaging SNVs, implying that there is selection against most SNVs with predicted damaging effects. More striking, however, is that within each of the five functional categories, the mean allele frequencies – and hence the numbers of derived alleles per individual – are essentially identical in the two populations, despite the very large size of the data sets (p>.05 for all five comparisons). Results for the 1000 Genomes Project data are qualitatively similar: we find no significant differences between YRI and CEU in the numbers of derived alleles per individual in any functional category (see Supplement Table 5).
Figure 3. Observed mean allele frequencies in African and European Americans at various classes of SNVs.

The plot shows mean frequencies in each population, plus and minus two standard errors, using exome sequence data from Fu et al.6. Here a site is considered an SNV if it is segregating in the combined AA-EA sample of 6515 individuals. The functional classifications of sites are from PolyPhen222 with bias-correcting modifications. The AA and EA mean frequencies are essentially identical within all five functional categories (p>0.05).
In summary, these observations are consistent with our model predictions that load should be very similar in these populations. Our conclusions likely differ from previous studies partly because earlier studies used measures that are related to load but are also sensitive to other differences between the populations being compared (e.g., the number of neutral segregating sites and the frequency spectrum) and partly due to the reference bias in functional annotations accounted for here (Supplement Section 3). We note that David Reich, Shamil Sunyaev and colleagues have recently made similar observations regarding load in different populations (personal communication).
The impact of demography on the genetic architecture of disease susceptibility
Although population size changes have had little impact on the average load carried by individuals, growth has greatly increased the number of rare variants in populations. So do rare variants play a greater (and substantial) role in the genetics of disease as a result of recent growth (Figure 4)? Given the differences in population history, do higher frequency variants play a greater role in Europeans and Asians than in Africans? The answers to these questions are of practical importance because different study designs may be needed to identify rare variants13, 15, 16, 23.
Figure 4. Predicted effect of demography on the genetic architecture of disease risk.

All the plots assume an additive trait and, with the exception of (B), are based on simulations with semi-dominant selection under the Tennessen et al.5 demographic model. Results for the constant population size model are also provided for comparison. The upper plots show the cumulative fractions of genetic variance due to alleles at frequency < x, based on: (A) simulated data with weak selection (s =.0002); (B) assuming the observed frequency spectrum at “probably damaging” sites6, 22, where a constant population size of 14,474 and selection coefficient of 0.02% are used for comparison; and (C) simulated data with strong selection (s = .01). Panel (D) depicts the fraction of variance due to rare alleles (i.e., < 0.1%) as a function of the selection coefficient; (E) shows the per-site contribution to variance as a function of the selection coefficient under two extreme models, with effect sizes that are either independent of s (constant) or proportional to s; (F) shows the expected fraction of the variance due to rare variants (i.e., < 0.1%) as a function of the correlation between the selection on, and effect size of variants. Further details on the model are provided in the Methods.
To study this, we computed the contributions of different allele frequencies to the heritable phenotypic variation among individuals in the population, namely x(1 − x)f (x)/2, where f (x) is the probability that a derived allele is at frequency x given the demographic model and selection coefficient. These distributions show the fraction of genetic variance for a disease that is contributed by alleles below frequency x, for the simplest case where the loci underlying a trait all have the same effect size, the same selection coefficient, and are semi-dominant (see Supplement Section 4). In practice, we anticipate that variants underlying a given disease would have a variety of selection coefficients and effect sizes, in which case the overall distribution would be an appropriately weighted mixture of distributions for different selection coefficients. Note that in this model, we consider the proportional contribution of variants at different frequencies and thus, these results should hold regardless of the number of loci underlying variation in the trait.
Analysis of this model reveals several interesting points. For effectively neutral, or for weakly deleterious sites (Figure 4A), only a small fraction of the total variance comes from very rare alleles: although there are many rare alleles, each one contributes very little to population variance and individual load. The same is true for recessive variation across almost the entire range of selection coefficients (Supplement Section 4.2). Likewise, if we assume that the frequency density f (x) follows the frequency spectrum observed at all non-synonymous sites classified as “probably damaging”22 then, under the same model, it is still only a modest fraction of the genetic variance that is due to rare alleles (Figure 4B; cf. ref. 5). Meanwhile, in all of these cases, the Out-of-Africa bottleneck increases the contribution of intermediate frequency alleles to the genetic variance (Figure 4A–C): e.g., at probably damaging sites 62% of the variance in EAs is contributed by alleles with minor allele frequency above 10% compared to only 49% in AAs.
It is only for the case of strong, dominant selection that very rare variants (< 0.1%) become important (Figure 4C and 4D). For example, for a selection coefficient of 1%, most of the variation is due to rare alleles that arose within the recent exponential growth phase. As a result, the contribution of extremely rare variants is much greater than it would have been in the absence of growth: e.g., in AAs and EAs, 80%, and 65% of the variance is due to alleles below frequency 0.1%, compared to just 25% in the constant population model.
Of course in practice, the genetic variants that contribute to a complex trait likely have a range of selection coefficients (s) and a range of effect sizes (a) on the phenotype in question (Supplement Section 4.3). When there is a mixture of selective coefficients and effect sizes, what can we say about the relative importance of rare and common variants? The answer crucially depends on the relationship between a and s14, 24. To illustrate this, we consider two extreme cases: (1) a is independent of s, namely, the trait itself has little effect on fitness but specific variants could have fitness consequences due to pleiotropic effects on other phenotypes; and (2) a is proportional to s — likely most relevant for traits with a direct impact on fitness such as early-onset diseases or diseases affecting fertility. Figure 4E shows the expected contribution of each site to genetic variance as a function of s, under these two models. When a is independent of s, we would expect weakly selected mutations to contribute most of the variance because they have the same average effect on the trait but can drift to higher frequencies. But the reverse occurs in the model where a increases with s: highly deleterious, rare mutations will have a greater contribution to variance because their increased effect size outweighs their lower frequencies.
Many traits presumably lie between these two extreme cases. To study how demography affects genetic architecture across this range, we consider a second model. We assume that the heritable variance in a trait is due to a mixture of weakly (s = 0.0002) and strongly (s = 0.01) selected mutations and we vary the correlation between selection on a variant and its effect on the trait (see Methods for details). Figure 4F shows how the contribution of rare alleles to genetic variance changes with the correlation between the selection coefficient and effect size. As can be seen in the case with constant population size, the contribution of rare variants becomes substantial only when the variants’ effects on fitness and on the trait are highly correlated (presumably because the trait itself is strongly coupled with fitness). While growth affects the frequencies of strongly selected alleles regardless of the correlation, it will have a substantial effect on the genetic architecture of a trait only for traits in which strongly selected alleles contribute substantially to variance. In this case, we see that the recent growth greatly amplifies the contribution of rare alleles to the variance. A similar argument implies that the Out-of-Africa bottleneck should substantially increase the contribution of intermediate frequency alleles to the variance, unless the effects of variants on fitness and on the trait are highly correlated, in which case rare alleles will still dominate.
Conclusion
While recent demographic events have had well-documented effects on the frequency spectrum of SNVs in modern populations, we find that these events have had negligible impact on the average burden of mutations carried by individuals. Moreover, we conclude that although there are large absolute numbers of rare variants, they do not necessarily contribute a large fraction of the genetic variance underlying complex traits. An earlier paper from one of the present authors (Pritchard, 200113) also discussed the possible role of allelic heterogeneity and rare variants in disease using a model that is closer to the independent s model here. While the earlier model is not exactly comparable to our present work, the overall results are broadly consistent, as the bulk of the genetic variance was predicted to be due to variants that would not be considered rare by modern standards. To summarize, it is only for diseases that are primarily due to strongly deleterious mutations that we can expect much of the variance to be due to rare alleles: these will likely tend to be diseases that are tightly coupled to fitness.
Online Methods
This section provides a summary of our methods; a complete description may be found in the Supplementary Information.
Model
Our basic model starts by considering selection at a single site. We use the standard bi-allelic diploid model with two-way mutation, viability selection, drift and, in some cases, migration25. Specifically, we assume there are two possible alleles at each site: normal (N) and deleterious (D). An N allele mutates to the D allele with probability u per gamete, per generation and the reverse mutation occurs with probability v. Unless noted otherwise, we assume that mutation is symmetric, i.e., u=v. The absolute fitness of the three genotypes NN, ND and DD are 1, 1 − hs and 1 − s, respectively, where s > 0 and h ≥ 0. We focus on semi-dominant (h = 1/2) and fully recessive (h = 0) selection because these two cases exhibit the full range of qualitative behaviors, with selection acting primarily on heterozygotes when h>1/2 and only on homozygotes when h=0. Allele frequencies in the next generation follow from Wright-Fisher sampling with these viabilities, sometimes with migration, and the population size and migration rates vary according to the demographic scenario considered.
We assume that fitness is multiplicative across sites, and that there is linkage equilibrium among sites. Under these assumptions, the evolutionary dynamics at each site are independent from all other sites. In practice, linked selection is likely to have negligible effects on differences between populations because, to a first approximation this reduces the effective population size at a given site by similar proportions regardless of demographic history and these effects are thought to be modest in humans (e.g., ref. 26).
Demographic scenarios
We consider three demographic scenarios. The most detailed is the Out-of-Africa demographic model for African-Americans (AA) and European-Americans (EA) estimated by Tennessen et al.5 (Supplement Figure 1A). The model includes the Out-of-Africa split of European ancestors, changes in population size before and after the split (specifically, a severe bottleneck in Europeans following the split and recent rapid growth in both Europeans and Africans) and migration between the populations after the split. Finally, the model includes recent admixture between the populations, which we include in our simulations only when we compare our results to data from AAs.
We also study two simpler demographic scenarios (Supplement Figure 1B, 1C). To understand the effects of recent explosive growth of human populations, we use a simple model of exponential growth from a population of constant size and similarly, to investigate the effects of the bottleneck in Europeans at the Out-of-Africa split, we consider a simple model of a bottleneck where population size instantaneously changes to a lower value at which it stays constant until it instantaneously reverts back to its original size.
Simulations
For each demographic scenario, we run simulations of a single site for the semi- dominant and recessive cases and vary the selection coefficient such that the strength of selection ranges from effectively neutral to strong. Each run begins with one of the two alleles fixed, where the proportion of runs that start with each allele is given by the expectation at equilibrium. A burn-in period of ≥ 10N generations with constant population size N follows in order to ensure an equilibrium distribution of segregating sites. The initial state is defined as ancestral and the other state as derived; the derived and deleterious allele frequencies are recorded at the end of the simulation. The code is written in C++ and is available upon request.
Load
Genetic load is defined as the relative reduction in average fitness caused by deleterious alleles, compared to the maximum absolute fitness 25. In our model, the maximal absolute fitness equals 1, allowing us to directly consider differences in average fitness in populations with different demographic histories. Given our model, the average fitness function can be written as
where
| (1) |
relates the quantities at a locus with load, p and q are the beneficial and deleterious allele frequencies at a locus (p + q = 1) and hj and sj are the dominance and selection coefficient at locus j. For a model with a single site and s ≪ 1, l(h, s) coincides with the definition of load. For more than one site, load is a simple function of the sum over l(h, s)’s. For brevity, we therefore refer to l(h, s) as load.
Change in load
To assess whether there has been a change in load due to demography, we consider the difference between load at the present time and the load before recent demographic events. Specifically, in the exponential and bottleneck models the reference time is before the change in population size and in the Tennessen model the reference time is the split between the African and European populations.
Data Analysis
We used exome resequencing data from Fu et al. (2012)6 and from the 1000 Genomes Project21. Allele frequency estimates from Fu et al. are available from the NHLBI GO Exome Variant Server. These provide estimates of the derived allele frequencies (DAFs) at exonic SNVs in European-Americans (EAs) and African-Americans (AAs). 1000 Genomes Project vcf files (Phase 1, Version 3) were downloaded from the official 1000 Genomes public server. YRI and CEU individuals with (at least) exome sequencing coverage were extracted from the original .vcf files (88 YRI individuals and 81 CEU individuals). 7 YRI individuals, chosen at random, were removed to match sample sizes between YRI and CEU. Variants that were fixed for either allele in both populations were removed. Any variant that was not an SNV or did not contain ancestral allele information was also dropped.
The ANNOVAR suite of scripts 27 was used to obtain functional predictions for each SNP from each of four prediction methods: PolyPhen222, SIFT28, LRT29 and MutationTaster30. We observed a strong reference bias in the functional classifications for all four prediction methods: sites at which the reference genome carries the derived allele are much more likely to be classified as benign than are sites where the reference is ancestral; this is a very strong effect even when we control for the true population frequency in a very large sample (Supplementary Figure 19), and hence does not simply reflect the tendency for common alleles to be less functional. We therefore treated the functional designations at sites where the genome reference is derived as unreliable. To deal with this problem we used a simple procedure to estimate the probability that each reference-derived site would have been classified as damaging had the reference allele been ancestral (conditional on the overall population frequency). Specifically, we binned SNVs by overall population frequency in the full sample and, for each bin, we determined the fraction of reference-ancestral sites in each functional category. For SNVs in that bin that are reference-derived, we treated those fractions as estimates of the probability that these SNVs would have been in each functional category had they instead been reference-ancestral. Next, to estimate the mean derived allele frequency (DAF) for each functional category, we summed across all sites in that category that were reference ancestral, and added a contribution from all sites that were reference-derived, weighted according to the estimated probability that the site would have been in the relevant functional category if it had been reference-ancestral. We also provide supplementary results in which we used a new unpublished version of PolyPhen’s PSIC scores that are calculated in a human-independent (i.e., unbiased) manner and obtain qualitatively similar results. We thank Ivan Adzhubey and Shamil Sunyaev for pre-publication access to these.
We calculated mean derived frequencies within functional categories, and the corresponding standard errors (calculated as SD(DAF)/Sqrt(#sites)). Individual-level counts for the 1000 Genomes data simply counted the numbers of derived alleles per individual within a functional class (note that there are no missing genotypes in this data set as these have been imputed by the 1000 Genomes Project). For each population and functional category we estimated the standard deviation of the mean number of derived alleles per individual by bootstrapping across sites. This is more appropriate than computing the standard error directly from the distribution of derived allele counts across individuals, as the latter method ignores variation in the evolutionary process. Note that because we are working with mean allele counts or frequencies, these analyses are unaffected by linkage disequilibrium or Hardy Weinberg disequilibrium (which may affect variances but not means).
Note that our analysis effectively uses the derived allele count as a proxy for the deleterious allele count. Hence, there will be a low rate of misclassification at weakly selected sites for which the deleterious allele is ancestral. However this does not change the qualitative predictions about patterns of differences between populations and we expect the number of derived alleles to have a monotonic relationship with the number of deleterious alleles. Specifically, for sites that are either neutral or semi-dominant, we predict that this measure should yield virtually identical counts in AAs and EAs (Figure 17, Supplement Section 3). At recessive sites, our model predicts slight differences (Supplement Section 3), but overall we expect these differences to be negligibly small. Note that when SNVs are defined within populations as in some previous papers, these simple predictions do not hold.
Models for variance
We consider how the relationship between the effects of mutations on fitness and a trait affect genetic architecture. For that purpose, we calculate the expected contribution of mutations to the heritable variation in a trait. We assume an additive trait and that the fitness effects of mutations are semi-dominant. At a site with selection coefficient s, the expected contribution to the variance from deleterious alleles below frequency ω is therefore
| (2) |
where E(a2|s) is the expectation of the squared effect size, f(x|s) is the probability of the deleterious allele being at frequency x (without conditioning of the site being segregating, i.e., including x = 0 and 1) and the C is a proportion coefficient (cf. Supplement Section 4.1). A site’s expected contribution to variance is V1(s) and the proportional contribution from variants below frequency ω is ; Note that while V1(s) depends on the relationship between selection coefficients and effect sizes, Θω(s) does not. When all sites are considered jointly, denoting the input of mutations with selection coefficient s by μ(s), the expected proportion of variance from deleterious alleles below frequency ω is
| (3) |
As an illustration, we consider a simple model in which we vary the correlation between selection on variants and their effects on a trait. We assume that half of the newly arising mutations have a weak selection coefficient sw = 0.0002 and half have a strong selection coefficient of ss = 0.01. For strongly selected mutations, the effect size on the trait, a, is chosen to be css with probability and csw with probability , where c is a positive constant and 0 ≤ p ≤ 1; correspondingly, for weakly selected mutations the effect size is chosen to be csw with probability and css with probability . In this model, the marginal distributions of selection coefficients and effect sizes do not depend on p, while the correlation between them is equal to p. To obtain Figure 4F we therefore varied p between 0 and 1. In Figure 4E, we consider the two extremes (p = 0 and 1).
Supplementary Material
Acknowledgments
This work was supported by grants from the National Institutes of Health (MH084703, GM083228), the Israel Science Foundation (grant # 1492/10), and the Howard Hughes Medical Institute. MCT was supported in part by NIH grant T32 GM007197. Thanks to David Reich and Shamil Sunyaev for helpful discussions and generous input regarding the interpretation of PolyPhen 2; to Ivan Adzhubey for human-independent PolyPhen scores; to Josh Akey for assistance in accessing data; and to Josh Akey, Adam Siepel, Graham Coop, Ilan Eshel, Dick Hudson and two anonymous reviewers for comments on the manuscript; and to Molly Przeworski for many discussions and comments on the manuscript.
Footnotes
Author contributions. JKP and GS conceived and supervised the research. YBS, GS and JKP developed theory. YBS performed simulations. MCT and JKP performed data analysis. JKP and GS wrote the manuscript with input from YBS and MCT.
Competing Interests. The authors declare that they have no competing financial interests.
URLs. The NHLBI GO Exome Variant Server, http://evs.gs.washington.edu/EVS; The 1000 Genomes public server, ftp://ftp.1000genomes.ebi.ac.uk/vol1/ftp/.
Literature cited
- 1.Coventry A, et al. Deep resequencing reveals excess rare recent variants consistent with explosive population growth. Nature Communications. 2010;1:131. doi: 10.1038/ncomms1130. [DOI] [PMC free article] [PubMed] [Google Scholar]
- 2.Marth GT, et al. The functional spectrum of low-frequency coding variation. Genome Biology. 2011;12:R84. doi: 10.1186/gb-2011-12-9-r84. [DOI] [PMC free article] [PubMed] [Google Scholar]
- 3.Keinan A, Clark AG. Recent explosive human population growth has resulted in an excess of rare genetic variants. Science. 2012;336:740–743. doi: 10.1126/science.1217283. [DOI] [PMC free article] [PubMed] [Google Scholar]
- 4.Nelson MR, et al. An abundance of rare functional variants in 202 drug target genes sequenced in 14,002 people. Science. 2012;337:100–104. doi: 10.1126/science.1217876. [DOI] [PMC free article] [PubMed] [Google Scholar]
- 5.Tennessen JA, et al. Evolution and functional impact of rare coding variation from deep sequencing of human exomes. Science. 2012;337:64–69. doi: 10.1126/science.1219240. [DOI] [PMC free article] [PubMed] [Google Scholar]
- 6.Fu W, et al. Analysis of 6,515 exomes reveals the recent origin of most human protein-coding variants. Nature. 2012 doi: 10.1038/nature11690. [DOI] [PMC free article] [PubMed] [Google Scholar]
- 7.Keinan A, Mullikin JC, Patterson N, Reich D. Measurement of the human allele frequency spectrum demonstrates greater genetic drift in East Asians than in Europeans. Nature Genetics. 2007;39:1251–1255. doi: 10.1038/ng2116. [DOI] [PMC free article] [PubMed] [Google Scholar]
- 8.Wall J, Przeworski M. When did the human population size start increasing? Genetics. 2000;155:1865–1874. doi: 10.1093/genetics/155.4.1865. [DOI] [PMC free article] [PubMed] [Google Scholar]
- 9.Voight BF, et al. Interrogating multiple aspects of variation in a full resequencing data set to infer human population size changes. Proceedings of the National Academy of Sciences of the United States of America. 2005;102:18508–18513. doi: 10.1073/pnas.0507325102. [DOI] [PMC free article] [PubMed] [Google Scholar]
- 10.Gutenkunst RN, Hernandez RD, Williamson SH, Bustamante CD. Inferring the joint demographic history of multiple populations from multidimensional SNP frequency data. PLoS Genetics. 2009;5:e1000695. doi: 10.1371/journal.pgen.1000695. [DOI] [PMC free article] [PubMed] [Google Scholar]
- 11.Lohmueller KE, et al. Proportionally more deleterious genetic variation in European than in African populations. Nature. 2008;451:994–997. doi: 10.1038/nature06611. [DOI] [PMC free article] [PubMed] [Google Scholar]
- 12.Casals F, Bertranpetit J. Human genetic variation, shared and private. Science. 2012;337:39–40. doi: 10.1126/science.1224528. [DOI] [PubMed] [Google Scholar]
- 13.Pritchard JK. Are rare variants responsible for susceptibility to complex diseases? The American Journal of Human Genetics. 2001;69:124–137. doi: 10.1086/321272. [DOI] [PMC free article] [PubMed] [Google Scholar]
- 14.Eyre-Walker A. Genetic architecture of a complex trait and its implications for fitness and genome-wide association studies. Proceedings of the National Academy of Sciences. 2010;107:1752–1756. doi: 10.1073/pnas.0906182107. [DOI] [PMC free article] [PubMed] [Google Scholar]
- 15.Gibson G. Rare and common variants: twenty arguments. Nature Reviews Genetics. 2012;13:135–145. doi: 10.1038/nrg3118. [DOI] [PMC free article] [PubMed] [Google Scholar]
- 16.Manolio TA, et al. Finding the missing heritability of complex diseases. Nature. 2009;461:747– 753. doi: 10.1038/nature08494. [DOI] [PMC free article] [PubMed] [Google Scholar]
- 17.Schaffner SF, et al. Calibrating a coalescent simulation of human genome sequence variation. Genome Research. 2005;15:1576–1583. doi: 10.1101/gr.3709305. [DOI] [PMC free article] [PubMed] [Google Scholar]
- 18.Hartl DL. A Primer of Population Genetics. Sinauer Associates, Inc; 2000. [Google Scholar]
- 19.Travis M, et al. Deleterious mutations can surf to high densities on the wave front of an expanding population. Molecular Biology and Evolution. 2007;24:2334–2343. doi: 10.1093/molbev/msm167. [DOI] [PubMed] [Google Scholar]
- 20.Lynch M, Conery J, Burger R. Mutational meltdowns in sexual populations. Evolution. 1995:1067–1080. doi: 10.1111/j.1558-5646.1995.tb04434.x. [DOI] [PubMed] [Google Scholar]
- 21.The 1000 Genomes Project Consortium. A map of human genome variation from population- scale sequencing. Nature. 2010;467:1061–1073. doi: 10.1038/nature09534. [DOI] [PMC free article] [PubMed] [Google Scholar]
- 22.Adzhubei IA, et al. A method and server for predicting damaging missense mutations. Nature Methods. 2010;7:248–249. doi: 10.1038/nmeth0410-248. [DOI] [PMC free article] [PubMed] [Google Scholar]
- 23.Thornton KR, Foran AJ, Long AD. Properties and modeling of GWAS when complex disease risk is due to non-complementing, deleterious mutations in genes of large effect. PLoS Genetics. 2013;9:e1003258. doi: 10.1371/journal.pgen.1003258. [DOI] [PMC free article] [PubMed] [Google Scholar]
- 24.Johnson T, Barton N. Theoretical models of selection and mutation on quantitative traits. Philosophical Transactions of the Royal Society B: Biological Sciences. 2005;360:1411– 1425. doi: 10.1098/rstb.2005.1667. [DOI] [PMC free article] [PubMed] [Google Scholar]
- 25.Charlesworth B, Charlesworth D. Elements of evolutionary genetics. 2010. [Google Scholar]
- 26.McVicker G, Gordon D, Davis C, Green P. Widespread genomic signatures of natural selection in hominid evolution. PLoS genetics. 2009;5:e1000471. doi: 10.1371/journal.pgen.1000471. [DOI] [PMC free article] [PubMed] [Google Scholar]
- 27.Wang K, Li M, Hakonarson H. ANNOVAR: functional annotation of genetic variants from high-throughput sequencing data. Nucleic acids research. 2010;38:e164–e164. doi: 10.1093/nar/gkq603. [DOI] [PMC free article] [PubMed] [Google Scholar]
- 28.Kumar P, Henikoff S, Ng PC. Predicting the effects of coding non-synonymous variants on protein function using the SIFT algorithm. Nature Protocols. 2009;4:1073–1081. doi: 10.1038/nprot.2009.86. [DOI] [PubMed] [Google Scholar]
- 29.Chun S, Fay JC. Identification of deleterious mutations within three human genomes. Genome research. 2009;19:1553–1561. doi: 10.1101/gr.092619.109. [DOI] [PMC free article] [PubMed] [Google Scholar]
- 30.Schwarz JM, Rödelsperger C, Schuelke M, Seelow D. MutationTaster evaluates disease-causing potential of sequence alterations. Nature Methods. 2010;7:575–576. doi: 10.1038/nmeth0810-575. [DOI] [PubMed] [Google Scholar]
Associated Data
This section collects any data citations, data availability statements, or supplementary materials included in this article.