

Abstract
Insulin, leptin and GLP-1 signal in the mediobasal hypothalamus (MBH) to lower hepatic glucose production (GP). MBH glucagon action also inhibits GP but the downstream signaling mediators remain largely unknown. In parallel, a lipid-sensing pathway involving MBH AMPK→malonyl-CoA→CPT-1→LCFA-CoA→PKC-δ leading to the activation of KATP channels lowers GP. Given that glucagon signals through the MBH PKA to lower GP, and PKA inhibits AMPK in hypothalamic cell lines, a possibility arises that MBH glucagon-PKA inhibits AMPK, elevates LCFA-CoA levels to activate PKC-δ, and activates KATP channels to lower GP. We here report that neither molecular or chemical activation of MBH AMPK nor inhibition of PKC-δ negated the effect of MBH glucagon. In contrast, molecular and chemical inhibition of MBH KATP channels negated MBH glucagon's effect to lower GP. Thus, MBH glucagon signals through a lipid-sensing independent but KATP channel-dependent pathway to regulate GP.
Keywords: Hypothalamus, Glucagon, Glucose production, KATP channels
1. Introduction
A role of glucagon action in the MBH was recently documented, in contrast to the hormone's hepatic stimulatory effect, to lower GP [1]. This GP-lowering effect required the activation of the MBH glucagon receptor–cAMP–PKA signaling pathway. In an experimental model of high-fat feeding, hypothalamic glucagon resistance disrupts the control on GP. However, direct activation of MBH PKA bypasses this resistance to lower GP [1]. Since MBH glucagon resistance lies upstream of PKA in response to a high-fat diet, the potential downstream targets of PKA in MBH glucagon action warrants investigation.
The activation of PKA pathway has been documented to inhibit AMP-activated protein kinase (AMPK) in hypothalamic cell lines [2] and adipocytes [3]. These findings are of interest as direct inhibition of MBH AMPK is sufficient to lower GP [4], while activating MBH AMPK negates glucose sensing to inhibit GP [4]. It is believed that activation of MBH AMPK negates the ability of a hypothalamic glucose flux to increase the malonyl-CoA levels and relieves the inhibition on CPT-1, leading to a reduction of cytosolic LCFA-CoA levels [5,6]. An accumulation of MBH LCFA-CoA is necessary to activate MBH protein kinase C (PKC)-δ [7] and the ATP-sensitive potassium (KATP) channels [7,8] to lower GP. Given that MBH PKA signaling is necessary for glucagon to inhibit GP [1] and that PKA inhibits AMPK in vitro as discussed above [2,3], we here tested the hypothesis that MBH lipid-sensing pathway involving AMPK→LCFA-CoA→PKC-δ and the subsequent activation of the KATP channels are necessary for MBH glucagon to lower GP (Supplemental Figure 1a).
With molecular and chemical approaches, we inhibited (i) the MBH lipid-sensing pathway via activation of MBH AMPK or inhibition of MBH PKC-δ, and (ii) MBH KATP channels in the presence of MBH glucagon stimulation and evaluated the changes in the rate of GP and glucose uptake during the pancreatic basal insulin-euglycemic clamps in normal rats. We discovered that MBH glucagon infusion signals via a lipid-sensing independent (i.e., AMPK and PKC-δ) but KATP channel-dependent pathway to lower GP in vivo (Supplemental Figure 1b).
2. Research design and methods
2.1. Animal preparation
Adult male Sprague Dawley rats aged 8 weeks (260–280 g) from Charles River Laboratories (Montreal, Quebec, Canada) were studied. Rats underwent stereotaxic implantation with a 26-gauge stainless steel bilateral guide catheter (C235G, Plastics One Inc. Virginia, USA) placed into the MBH using the coordinates 3.1 mm posterior to bregma, 0.4 mm lateral of midline and 9.6 mm below skull surface as described [1]. After 6 days of recovery, vascular catheters were inserted into the internal jugular vein and carotid artery for infusion and blood sampling [1,9]. All experiments in rats complied with the rules of the Institutional Animal Care and Use committee of the University Health Network.
2.2. Adenovirus injection
Immediately following brain surgery, a group of rats received 3 μl of adenovirus containing the constitutively active (CA) form of AMPK (Ad-CA AMPK α1312) [T172D] (3.83×10¹⁰ pfu ml−1) [4]; or the dominant negative (DN) form of PKC-δ or LacZ (4×10⁸ pfu ml−1; gift from Dr. J Soh, Biomedical Research Centre for Signal Transduction, Incheon, Korea) [10]; or the DN Kir6.2 AAA (3.1×10¹⁰ pfu ml−1) or green fluorescence protein (GFP) (3.0×10¹⁰ pfu ml−1) [7] through each side of the MBH catheters, as described [4,7,11].
2.3. Pancreatic (basal insulin)-euglycemic clamp
Four days following vascular catheterization, conscious and unrestrained rats with at least 90% recovery in their food intake and body weight were used in clamp studies. All rats were limited to 15 g of food the night before the clamp to ensure comparable nutritional status [1;9]. At the start of the experiment (t=0), a primed continuous infusion of [3-3H]-glucose (Perkin-Elmer; 40 μCi bolus, 0.4 μCi min−1) was initiated and maintained until the end of the experiment (t=210) to assess glucose kinetics (i.e., steady-state changes in endogenous glucose production and glucose uptake) using tracer dilution methodology. From t=90–210, a pancreatic basal insulin clamp was performed during which somatostatin (3 μg kg−1 body weight min−1) and insulin (1.1 mU kg−1 body weight min−1) were continuously infused to replace insulin to basal levels, along with a variable infusion of 25% glucose to maintain euglycemia. At 10-min intervals, plasma samples were taken for determination of [3-3H]-glucose concentrations, as well as plasma insulin and glucagon concentrations. At the end of the experiment, rats were anesthetized and injected with 3 µl bromophenol blue through each side of the MBH catheter to verify the correct placement of the catheter. The MBH wedges were then collected, frozen in liquid nitrogen and stored at −80 °C for subsequent analysis.
Treatments administered into the MBH at a rate of 0.006 μl/min included: Saline (t=90–210); 5 pg/μl glucagon (t=90–210); 25 mmol/l AMPK activator AICAR (t=0–90) with 25 mmol/l AICAR+saline (t=90–210) or 25 mmol/l AICAR+5 pg/μl glucagon (t=90–210); 60 μmol/l PKC-δ inhibitor rottlerin (t=0–90) with 60 μmol/l rottlerin+saline or 60 μmol/l rottlerin+5 pg/μl glucagon (t=90–210); 100 μmol/l KATP channel inhibitor glibenclamide (t=0–90) with 100 μmol/l glibenclamide+saline or 100 μmol/l glibenclamide+5 pg/μl glucagon (t=90–210 min).
2.4. Western blotting for phosphorylated acetyl-coA carboxylase (ACC)
MBH wedges were obtained immediately after the infusion/clamp studies and homogenized in a lysis buffer constituting 50 mM Tris–HCl (pH 7.5), 1mM EGTA, 1 mM EDTA, 1% (w/v) Nonidet P40, 1 mM sodium orthovanadate, 50 mM sodium fluoride, 5 mM sodium pyrophosphate, 0.27 M sucrose, 1 μM Dithiotritolo (DTT), and protease inhibitor cocktail (Roche). The Pierce 660 nm protein assay (Thermo Scientific) was used to measure protein concentrations of the homogenized tissues. Protein lysates (20 µg) were subjected to SDS-PAGE and transferred onto nitrocellulose membranes (Amersham). The membranes were first incubated for 1 h at room temperature with blocking solution (5% BSA in Tris-buffered saline and 0.2% Tween-20) and then overnight at 4 °C with the primary antibody (indicated below) diluted 1000-fold. Protein expression was detected using a horseradish peroxidase (HRP)-linked rabbit-specific secondary antibody (diluted 1/4000 in blocking solution) and an enhanced chemoluminescence commercial kit (Pierce). The phosphorylation of ACC was quantified by densitometry with the Quantity One software and normalized for the total protein (ACC or β-tubulin). Primary antibodies include: anti-phospho ACC, anti-total ACC, anti-β-tubulin (Cell signaling Technology).
2.5. PKC-δ activity assay
PKC-δ was immunoprecipitated from MBH wedges obtained immediately after performing 10-min MBH infusions of saline, glucagon or 1-oleoyl-2-acetyl-sn-glycerol (OAG) in rats. To do this, 3 MBH wedges from each treatment group were pooled together to yield an n=1. Thus, we have a total of n=3 (i.e., 9 wedges) per group (Figure 2I). MBH tissues were homogenized as described above, following which 500 µg of tissue lysate was incubated overnight with 8 μg of PKC-δ polyclonal antibody (sc-213; Santa Cruz Biotechnology) on a rotating wheel and then incubated with 25 μl of protein A/G sepharose beads for 2 h at 4 °C. The beads were then centrifuged at 8000 rpm for 1 min. After removal of the supernatant, the beads were then washed (2× with 1 ml lysis buffer (as above) with 0.5 M NaCl, 1× with 1 ml lysis buffer (as above) with 0.15 M NaCl and 2× with 1 ml buffer A containing 50 mM Tris–HCl pH 7.5, 0.1 mM EGTA and 1 μM DTT). With the supernatant removed, 20 μl of buffer A was further added giving a final sample volume of 25 μl. We then proceeded with the Biotrak protein Kinase C (PKC) enzyme assay system (GE Healthcare). Additionally, to normalize for the amount of PKC-δ immunoprecipitated in each sample, PKC-δ protein was separated from the beads using Laemmli sample buffer and subjected to SDS-PAGE and quantified (as described above). Results were then presented as pmol/min/protein.
Figure 2.
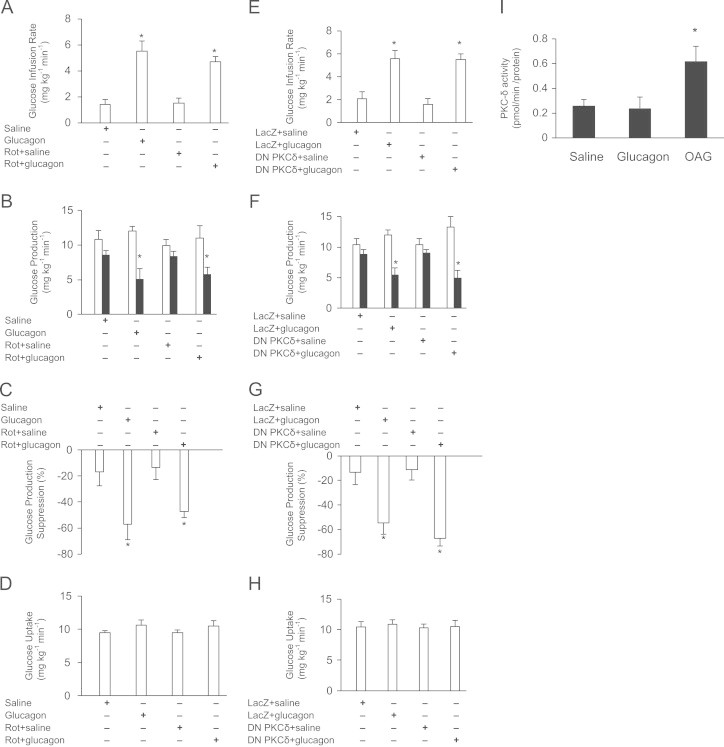
Role of MBH PKC-δ in glucagon action. (A) Glucose infusion rate, (B) GP, (C) GP suppression expressed as the percentage decrease from basal period (60–90 min) to the clamp period (180–210 min) and (D) glucose uptake obtained during the clamps that received MBH Saline (n=5); Glucagon (n=5); Rot+saline (n=5); Rot+glucagon (n=5). Rot=Rottlerin. (E) Glucose infusion rate, (F) GP, (G) GP suppression expressed as the percentage decrease from basal period (60–90 min) to the clamp period (180–210 min) and (H) glucose uptake obtained during the clamps that received MBH LacZ+saline (n=5); Lacz+glucagon (n=5); DN PKC-δ+saline (n=5); DN PKC-δ+glucagon (n=5). I: PKC-δ activity in MBH wedges. Shown is a representative quantification from three samples in each treatment group. Data are shown as means+SE. *P<0.05.
2.6. Biochemical analysis
Plasma glucose levels were determined by the glucose oxidase method (Glucose analyzer GM9; Analox Instruments, Lunenberg, MA). Radioimmunoassays (Linco Research, St. Charles, MO) were used to determine plasma insulin and glucagon concentrations.
2.7. Statistical analysis
Unpaired Student's t tests and ANOVA were performed as appropriate. Significance was accepted as P<0.05.
3. Results
3.1. Role of MBH AMPK in glucagon action
We activated MBH AMPK in the presence of MBH glucagon by infusing the AMPK activator AICAR and examined whether it would negate the ability of MBH glucagon to lower GP. This AICAR dose negated the ability of hypothalamic glucose infusion to lower GP [4]. Firstly, consistent with previous findings [1], MBH glucagon infusion led to a significant increase in the glucose infusion rate (Figure 1A) to achieve euglycemia during the pancreatic basal insulin clamp and significantly lowered GP (Figure 1B and C) compared to MBH saline treatment independent of changes in glucose uptake (Figure 1D) and plasma levels of insulin, glucagon and glucose (Supplemental Table 1). Interestingly, glucagon co-infused with AICAR into the MBH still led to a significant increase in glucose infusion rate and decrease in GP. Notably, rats that received MBH AICAR infusion alone showed no significant difference in the glucose infusion rate and GP compared with the MBH saline group, thereby showing that AICAR per se has minimal effect on glucose kinetics in these experimental conditions. These data indicate that chemical activation of MBH AMPK does not reverse the ability of MBH glucagon to lower GP.
Figure 1.
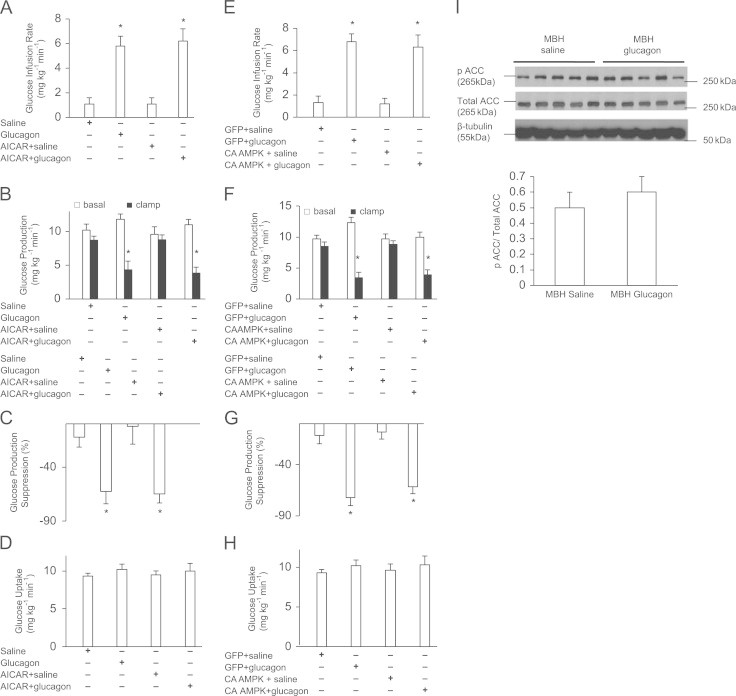
Role of MBH AMPK in glucagon action. (A) Glucose infusion rate, (B) GP, (C) GP suppression expressed as the percentage decrease from basal period (60–90 min) to the clamp period (180–210 min) and (D) glucose uptake obtained during the clamps that received MBH saline (n=5), glucagon (n=5), AICAR+saline (n=5) or AICAR+glucagon (n=7). (E) Glucose infusion rate, (F) GP, (G) GP suppression expressed as the percentage decrease from basal period (60–90 min) to the clamp period (180–210 min) and (H) glucose uptake obtained during the clamps that received MBH GFP+saline (n=5), GFP+glucagon (n=5), CA AMPK+saline (n=5) or CA AMPK+glucagon (n=6). (I): Phosphorylation of ACC. Shown above is the representative western blot of pACC in saline (n=5) and glucagon (n=5) treated MBH wedges normalized to total ACC and B-tubulin. Shown below is the quantification of pACC normalized to total ACC. Data are shown as means+SE. *P<0.05.
Alternatively, we activated MBH AMPK by injecting an adenovirus expressing the CA form of AMPK, which has been previously shown to negate the metabolic effects of hypothalamic nutrient-sensing mechanisms [4]. We examined whether MBH glucagon inhibition on GP is then blocked in rats expressing MBH CA AMPK. Firstly, infusion of MBH glucagon with prior Ad-GFP (control) injection significantly increased the glucose infusion rate required to maintain euglycemia compared to MBH saline infusions (Figure 1E), owing to a reduction in GP (Figure 1F, G) as opposed to a difference in glucose uptake (Figure 1H). Similarly, in rats injected with MBH CA AMPK, MBH glucagon also led to an increase in the glucose infusion rate and suppression of GP, while glucose uptake was similar in all groups (Figure 1E–H). Similar to our chemical approach data, these results show that molecular activation of MBH AMPK does not negate the ability of MBH glucagon to lower GP.
As added confirmation, we evaluated AMPK activity (i.e., protein content ratio of pACC/total ACC) in MBH wedges obtained from rats that received MBH saline or glucagon treatments during clamps. Acetyl CoA carboxylase (ACC) is phosphorylated by AMPK; thus, a lower ratio of phospho (P)–ACC/total ACC is indicative of a lower degree of AMPK activation. MBH glucagon infusion showed a similar degree of AMPK activation (0.6±0.1) as with MBH saline infusion (0.5±0.1) (Figure 1I) (in contrast to our original hypothesis where MBH glucagon action was postulated to inhibit AMPK). These results suggest that the MBH glucagon infusion does not alter MBH AMPK activity in these experimental conditions and hence changes in MBH AMPK activity are not necessary for glucagon to lower GP.
3.2. Role of MBH PKC-δ in glucagon action
We next investigated whether inhibition of MBH PKC-δ will negate the GP-regulating effect of MBH glucagon. MBH PKC-δ was inhibited by infusing PKC-δ inhibitor rottlerin directly into the MBH at a dose previously shown to block MBH lipid or PKC activator (OAG) infusion to lower GP and MBH OAG to activate PKC-δ [7]. We found that introduction of rottlerin into the MBH did not attenuate the ability of MBH glucagon to increase the exogenous glucose infusion rate (Figure 2A) and lower glucose production (Figure 2B and C) during the clamp, while glucose uptake remained unchanged (Figure 2D). Alternatively, MBH glucagon was also equally potent to increase the glucose infusion rate (Figure 2E) and lower glucose production (Figure 2 F and G) in rats injected with MBH DN PKC-δ as compared with LacZ injected rats, while glucose uptake remained similar between groups (Figure 2H). Of note, injection of DN PKC-δ has been previously shown to reduce PKC-δ activity and negate the metabolic effects of OAG in the duodenum [10]. Collectively, these data suggest that both chemical and molecular inhibition of MBH PKC-δ do not block the ability of MBH glucagon to lower GP. Consistent with these observations, no significant difference in MBH PKC-δ activity between glucagon- and saline-treated MBH tissues was detected, whereas MBH OAG (positive control) infusion markedly stimulated PKC-δ activity in the same experimental conditions (Figure 2I).
3.3. Role of MBH KATP channels in glucagon action
We inhibited MBH KATP channels using glibenclamide in the presence of MBH glucagon to examine whether the GP-lowering effect of MBH glucagon is abrogated. MBH glibenclamide has been reported to negate MBH lipid [7], PKC activator OAG [7] and insulin [12] to lower GP. Interestingly, co-infusion with glibenclamide attenuated the ability of MBH glucagon to increase the glucose infusion rate (Figure 3A) and lower glucose production (Figure 3B and C), without any changes in glucose uptake (Figure 3D).
Figure 3.
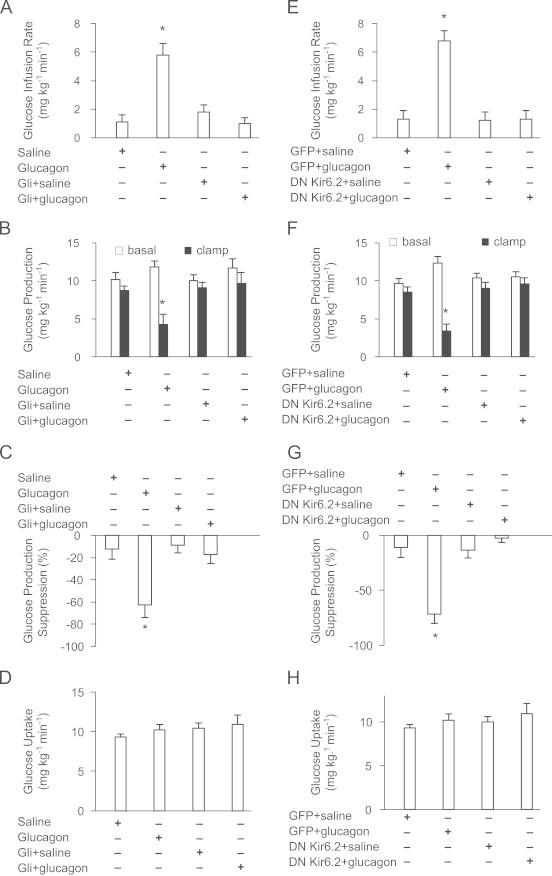
Role of MBH KATP channels glucagon action. (A) Glucose infusion rate, (B) GP, (C) GP suppression expressed as the percentage decrease from basal period (60–90 min) to the clamp period (180–210 min) and (D) glucose uptake obtained during the clamps that received Saline (n=5); Glucagon (n=5); Gli+saline (n=5); Gli+glucagon (n=4). Gli=Glibenclamide. (E) Glucose infusion rate, (F) GP, (G) GP suppression expressed as the percentage decrease from basal period (60–90 min) to the clamp period (180–210 min) and (H) glucose uptake obtained during the clamps that received MBH GFP+saline (n=5); GFP+glucagon (n=5); DN Kir6.2+saline (n=5); DN Kir6.2+glucagon (n=5). Values are shown as means+SE. *P<0.05.
Glibenclamide sensitive KATP channels composed of Kir6.2 and SUR1 subunits are expressed in both the pancreatic β-cells and neurons [12]. The adenovirus expressing the DN form of Kir6.2 expresses a subunit of Kir6.2 with a 3-amino acid GFG to AAA substitution in the selectivity filter that co-assembles with endogenous Kir6.2 and prevents the KATP channels from conducting potassium current [13]. We directly injected the adenovirus DN Kir6.2 AAA into the MBH as described [7] and tested the metabolic effect of MBH glucagon. Consistent with our chemical approach data, MBH glucagon also failed to increase the exogenous glucose infusion rate (Figure 3E) and lower GP (Figure 3F and G) in rats expressing MBH DN Kir 6.2 AAA unlike GFP (control virus)-injected rats, independent of changes in glucose uptake (Figure 3H). Together, these chemical and molecular loss-of-function experiments indicate that MBH KATP channels are necessary for MBH glucagon to lower GP.
4. Discussion
We presently demonstrate that activation of MBH AMPK or inhibition of MBH PKC-δ did not negate the GP-lowering effect of MBH glucagon. Activation of MBH AMPK increases the ratio of pACC/total ACC protein, inhibits ACC activity and prevents the formation of malonyl-CoA (endogenous inhibitor of CPT-1) and LCFA-CoA [6,14], while inhibiting MBH PKC-δ negates LCFA-CoA to lower GP [7,8]. Although hypothalamic malonyl-CoA and LCFA-CoA levels were not measured, our studies indicate that blocking the beginning or the end of this malonyl-CoA→CPT-1→LCFA-CoA→PKC-δ, lipid sensing, pathway did not alter the gluco-regulatory effect of MBH glucagon. These data collectively imply that MBH glucagon signals through a lipid-sensing independent pathway to lower GP. It is important to note that although adenoviruses were used to alter MBH AMPK and PKC-δ activities as well as the KATP channels, the negative and positive gluco-regulatory impacts they had on MBH glucagon action were not due to secondary changes in local inflammation since the appropriate control adenoviruses (i.e., GFP, LacZ) were used (Figures 1–3).
Like glucagon, leptin and insulin action in the MBH lowers GP [12,15,16]. However, in contrast to the inability of MBH glucagon infusion to alter MBH pACC/total ACC (i.e., AMPK activity) as currently reported, hypothalamic leptin and insulin administration lower MBH AMPK activity, the protein ratio of pACC/total ACC and increase ACC activity [14,17]. These findings raise the possibility that unlike glucagon, leptin and insulin in the MBH signal through a lipid-sensing dependent pathway to lower GP. This working hypothesis, however, remains to be investigated.
Interestingly, activation of MBH KATP channels is necessary for MBH glucagon to lwoer GP. Hypothalamic KATP channels thus become the common integrator of hormonal and nutrient sensing to regulate GP as activation of hypothalamic KATP channels is sufficient [12] and necessary for insulin [12], GLP-1 [18] and lipids [8] as well to lower GP in rodents. Of note, activating KATP channels in the whole brain of humans [19] or the dorsal vagal complex in rodents [9] lowers GP, highlighting that the gluco-regulatory role of the KATP channels is not limited to the ones that are expressed in the hypothalamus. In addition, the physiological and therapeutic relevance of MBH glucagon-KATP channel signaling pathway remain to be explored.
In summary, glucagon action in the hypothalamus signals through a KATP channel dependent pathway to lower GP. Given that MBH glucagon receptor-PKA signaling [1] and the activation of MBH KATP channels are required for glucagon to lower GP, while PKA could directly phosphorylate and activate the Kir6.2/SUR1 subunits of KATP channels [20], our data further implicate that glucagon activates a hypothalamic glucagon receptor→PKA→KATP channels signaling axis to regulate GP in vivo.
Conflict of interest
No potential conflicts of interest relevant to this article were reported.
Acknowledgments
This work was supported by a research grant from the Canadian Diabetes Association (OG-3–13-4156-TL). M.A.A. is supported by a Banting and Best Diabetes Center graduate scholarship. J.T.Y.Y. is supported by a Canadian Institutes of Health Research and a Canadian Diabetes Association post-doctoral fellowship. M.P.L. is supported by an Ontario Graduate Scholarship and an UHN Unilever Graduate Fellowship in Neuroscience. G.A.R. is supported by a Wellcome Trust Senior Investigator Award, a Royal Society Research Merit Award, and a Programme Grant the Medical Research Council (U.K.). T.K.T.L. holds the J.K. McIvor (1915–1942) Endowed Chair in Diabetes Research and the Canada Research Chair in Obesity at the Toronto General Research Institute and the University of Toronto. T.K.T.L. is the guarantor of this work and, as such, had full access to all the data in the study and takes responsibility for the integrity of the data and the accuracy of the data analysis.
M.A.A. conducted and designed the experiments, performed data analyses, and wrote the manuscript. J.T.Y.Y., M.P.L. and B.M.F. assisted with experiments. G.A.R. provided the adenovirus expressing the CA AMPK. P.E.L. provided the adenovirus expressing the DN Kir6.2 AAA. T.K.T.L. supervised the project, designed the experiments and edited the manuscript.
Footnotes
This is an open-access article distributed under the terms of the Creative Commons Attribution-NonCommercial-No Derivative Works License, which permits non-commercial use, distribution, and reproduction in any medium, provided the original author and source are credited.
Appendix A. Supporting information
Supplementary data associated with this article can be found in the online version at doi:10.1016/j.molmet.2013.11.007.
Appendix A. Supplementary materials
Supplementary data
References
- 1.Mighiu P.I., Yue J.T., Filippi B.M., Abraham M.A., Chari M., Lam C.K., Yang C.S., Christian N.R., Charron M.J., Lam T.K. Hypothalamic glucagon signaling inhibits hepatic glucose production. Nature Medicine. 2013;19:766–772. doi: 10.1038/nm.3115. [DOI] [PubMed] [Google Scholar]
- 2.Damm E., Buech T.R., Gudermann T., Breit A., Melanocortin-induced P.K.A. activation inhibits AMPK activity via ERK-1/2 and LKB-1 in hypothalamic GT1-7 cells. Molecular Endocrinology. 2012;26:643–654. doi: 10.1210/me.2011-1218. [DOI] [PMC free article] [PubMed] [Google Scholar]
- 3.Djouder N., Tuerk R.D., Suter M., Salvioni P., Thali R.F., Scholz R., Vaahtomeri K., Auchli Y., Rechsteiner H., Brunisholz R.A., Viollet B., Makela T.P., Wallimann T., Neumann D., Krek W. PKA phosphorylates and inactivates AMPKalpha to promote efficient lipolysis. The EMBO Journal. 2010;29:469–481. doi: 10.1038/emboj.2009.339. [DOI] [PMC free article] [PubMed] [Google Scholar]
- 4.Yang C.S., Lam C.K., Chari M., Cheung G.W., Kokorovic A., Gao S., Leclerc I., Rutter G.A., Lam T.K. Hypothalamic AMP-activated protein kinase regulates glucose production. Diabetes. 2010;59:2435–2443. doi: 10.2337/db10-0221. [DOI] [PMC free article] [PubMed] [Google Scholar]
- 5.Lam T.K. Neuronal regulation of homeostasis by nutrient sensing. Nature Medicine. 2010;16:392–395. doi: 10.1038/nm0410-392. [DOI] [PubMed] [Google Scholar]
- 6.Yue J.T., Lam T.K. Lipid sensing and insulin resistance in the brain. Cell Metabolism. 2012;15:646–655. doi: 10.1016/j.cmet.2012.01.013. [DOI] [PubMed] [Google Scholar]
- 7.Ross R., Wang P.Y., Chari M., Lam C.K., Caspi L., Ono H., Muse E.D., Li X., Gutierrez-Juarez R., Light P.E., Schwartz G.J., Rossetti L., Lam T.K. Hypothalamic protein kinase C regulates glucose production. Diabetes. 2008;57:2061–2065. doi: 10.2337/db08-0206. [DOI] [PMC free article] [PubMed] [Google Scholar]
- 8.Lam T.K., Pocai A., Gutierrez-Juarez R., Obici S., Bryan J., Aguilar-Bryan L., Schwartz G.J., Rossetti L. Hypothalamic sensing of circulating fatty acids is required for glucose homeostasis. Nature Medicine. 2005;11:320–327. doi: 10.1038/nm1201. [DOI] [PubMed] [Google Scholar]
- 9.Filippi B.M., Yang C.S., Tang C., Lam T.K. Insulin activates Erk1/2 signaling in the dorsal vagal complex to inhibit glucose production. Cell Metabolism. 2012;16:500–510. doi: 10.1016/j.cmet.2012.09.005. [DOI] [PubMed] [Google Scholar]
- 10.Kokorovic A., Cheung G.W., Breen D.M., Chari M., Lam C.K., Lam T.K. Duodenal mucosal protein kinase C-delta regulates glucose production in rats. Gastroenterology. 2011;141:1720–1727. doi: 10.1053/j.gastro.2011.06.042. [DOI] [PubMed] [Google Scholar]
- 11.Chari M., Yang C.S., Lam C.K., Lee K., Mighiu P., Kokorovic A., Cheung G.W., Lai T.Y., Wang P.Y., Lam T.K. Glucose transporter-1 in the hypothalamic glial cells mediates glucose sensing to regulate glucose production in vivo. Diabetes. 2011;60:1901–1906. doi: 10.2337/db11-0120. [DOI] [PMC free article] [PubMed] [Google Scholar]
- 12.Pocai A., Lam T.K., Gutierrez-Juarez R., Obici S., Schwartz G.J., Bryan J., Aguilar-Bryan L., Rossetti L. Hypothalamic K(ATP) channels control hepatic glucose production. Nature. 2005;434:1026–1031. doi: 10.1038/nature03439. [DOI] [PubMed] [Google Scholar]
- 13.Baczko I., Jones L., McGuigan C.F., Manning Fox J.E., Gandhi M., Giles W.R., Clanachan A.S., Light P.E. Plasma membrane KATP channel-mediated cardioprotection involves posthypoxic reductions in calcium overload and contractile dysfunction: mechanistic insights into cardioplegia. The FASEB Journal. 2005;19:980–982. doi: 10.1096/fj.04-3008fje. [DOI] [PubMed] [Google Scholar]
- 14.Gao S., Kinzig K.P., Aja S., Scott K.A., Keung W., Kelly S., Strynadka K., Chohnan S., Smith W.W., Tamashiro K.L., Ladenheim E.E., Ronnett G.V., Tu Y., Birnbaum M.J., Lopaschuk G.D., Moran T.H. Leptin activates hypothalamic acetyl-CoA carboxylase to inhibit food intake. Proceedigns of the National Academy of Sciences of the United States America. 2007;104:17358–17363. doi: 10.1073/pnas.0708385104. [DOI] [PMC free article] [PubMed] [Google Scholar]
- 15.Buettner C., Pocai A., Muse E.D., Etgen A.M., Myers M.G., Jr., Rossetti L. Critical role of STAT3 in leptin's metabolic actions. Cell Metabolism. 2006;4:49–60. doi: 10.1016/j.cmet.2006.04.014. [DOI] [PMC free article] [PubMed] [Google Scholar]
- 16.German J., Kim F., Schwartz G.J., Havel P.J., Rhodes C.J., Schwartz M.W., Morton G.J. Hypothalamic leptin signaling regulates hepatic insulin sensitivity via a neurocircuit involving the vagus nerve. Endocrinology. 2009;150:4502–4511. doi: 10.1210/en.2009-0445. [DOI] [PMC free article] [PubMed] [Google Scholar]
- 17.Minokoshi Y., Alquier T., Furukawa N., Kim Y.B., Lee A., Xue B., Mu J., Foufelle F., Ferre P., Birnbaum M.J., Stuck B.J., Kahn B.B. AMP-kinase regulates food intake by responding to hormonal and nutrient signals in the hypothalamus. Nature. 2004;428:569–574. doi: 10.1038/nature02440. [DOI] [PubMed] [Google Scholar]
- 18.Sandoval D.A., Bagnol D., Woods S.C., D'Alessio D.A., Seeley R.J. Arcuate glucagon-like peptide 1 receptors regulate glucose homeostasis but not food intake. Diabetes. 2008;57:2046–2054. doi: 10.2337/db07-1824. [DOI] [PMC free article] [PubMed] [Google Scholar]
- 19.Kishore P., Boucai L., Zhang K., Li W., Koppaka S., Kehlenbrink S., Schiwek A., Esterson Y.B., Mehta D., Bursheh S., Su Y., Gutierrez-Juarez R., Muzumdar R., Schwartz G.J., Hawkins M. Activation of KATP channels suppresses glucose production in humans. Journal of Clinical Investigation. 2011;121:4916–4920. doi: 10.1172/JCI58035. [DOI] [PMC free article] [PubMed] [Google Scholar]
- 20.Beguin P., Nagashima K., Nishimura M., Gonoi T., Seino S. PKA-mediated phosphorylation of the human K(ATP) channel: separate roles of Kir6.2 and SUR1 subunit phosphorylation. The EMBO Journal. 1999;18:4722–4732. doi: 10.1093/emboj/18.17.4722. [DOI] [PMC free article] [PubMed] [Google Scholar]
Associated Data
This section collects any data citations, data availability statements, or supplementary materials included in this article.
Supplementary Materials
Supplementary data