

Highlights
-
•
Protein- but not lipid-stabilizing fixatives induce cell blebbing of spread cells.
-
•
Asymmetric distribution of fixation-induced blebs coincides with that of PIP2.
-
•
Fixation less readily induces blebbing on spread cells with elevated PIP2 levels.
-
•
Fixation more readily induces blebbing on spread cells with lower PIP2 levels.
-
•
Disruption of lipid rafts enhances fixation-induced blebbing of spread cells.
Abbreviations: DIC, differential interference contrast; HUVECs, human umbilical vein endothelial cells; PIP2, phosphatidylinositol 4,5-bisphosphate; TBS, Tris-buffered saline; DAG, 1,2-diacylglycerol; IP3, inositol 1,4,5-trisphosphate; MβCD, methyl-β-cyclodextrin; PI3K, phosphoinositide-3 kinase; PIP3, phosphatidylinositol 3,4,5-trisphosphate; PLC, phospholipase C
Keywords: Cell fixation; Cell blebbing; Phosphatidylinositol 4,5-bisphosphate (PIP2); Human umbilical vein endothelial cells (HUVECs); Lipid rafts; THP-1-derived macrophages
Abstract
While most attention has been focused on physiologically generated blebs, the molecular mechanisms for fixation-induced cell blebbing are less investigated. We show that protein-fixing (e.g. aldehydes and picric acid) but not lipid-stabilizing (e.g. OsO4 and KMnO4) fixatives induce blebbing on spread cells. We also show that aldehyde fixation may induce the loss or delocalization of phosphatidylinositol 4,5-bisphosphate (PIP2) in the plasma membrane and that the asymmetric distribution of fixation-induced blebs on spread/migrating cells coincides with that of PIP2 on the cells prefixed by lipid-stabilizing fixatives (e.g., OsO4). Moreover, fixation induces blebbing less readily on PIP2-elevated spread cells but more readily on PIP2-lowered or lipid raft-disrupted spread cells. Our data suggest that fixation-induced lowering of PIP2 level at cytoskeleton-attaching membrane sites causes bleb formation via local breakdown of the membrane–cytoskeleton coupling.
1. Introduction
Plasma membrane blebs are spherical, dynamic, functional cell protrusions. Cell blebbing is a common phenomenon during many cell physiological behaviors including cell spreading [1,2], migration [3,4], cytokinesis [5,6], apoptosis [7,8], and viral infection [9]. Physiologically produced blebs are commonly regarded to be directly driven by the hydrostatic pressure that is exerted on the cytoplasm by the contractile actomyosin cortex [10,11]. Expansion of a physiologically produced bleb lasts ∼30 s whereas its retraction lasts ∼2 min and many proteins (particularly myosin motor proteins) dynamically participate in these processes [12,13].
Cell fixation with aldehyde fixatives at certain concentrations is also able to induce cell blebbing [14,15,16,17], based on which a technique mainly using formaldehyde as the fixative for isolating plasma membranes or giant plasma membrane vesicles has been developed and applied widely [18,19,20]. Unlike physiologically produced blebs, fixation-induced blebs expand for 10–30 min and retract quickly (within seconds) or detach from the plasma membrane [16,21]. Aldehydes are mainly protein-stabilizing fixatives that, especially at relatively high concentrations, can completely fix most proteins in/on cells rapidly including those that may participate in cell blebbing under physiological conditions. It suggests that the molecular mechanisms for fixation-induced cell blebbing may be unique although we believe that fixation-induced blebs are also the mechanical consequence of hydrostatic pressure. Until now, however, while most attention in this research field has been paid to physiologically generated blebs the molecular mechanisms for fixation-induced cell blebbing remain unclear.
In this study, we focus on fixation-induced blebbing of spread adherent cells. We reveal that fixation-induced bleb formation inversely correlates with the level of phosphatidylinositol 4,5-bisphosphate (PtdIns(4,5)P2 or PI(4,5)P2 or PIP2) in the plasma membrane. The inability of protein-stabilizing fixatives (e.g., aldehydes) to stabilize PIP2 may cause local loss or delocalization of PIP2 from cytoskeleton-attaching sites of the plasma membrane (i.e., lower PIP2 level at these sites) where local detachments of the plasma membrane from the cell cortex occur, followed by hydrostatic pressure-powered blebbing.
2. Materials and methods
2.1. Reagents, cell lines and cell culture
Paraformaldehyde (Solarbio, Beijing, China), Picric acid (AiKeda Chemical Technology, Chengdu, China), osmium tetroxide (OsO4; Ted Pella, CA, USA), potassium permanganate (KMnO4; Shanghai Chemical Company, Shanghai, China), wortmannin (Sigma) and LY294002 (inhibitors of phosphoinositide-3 kinase (PI3K); Calbiochem), U73122 and m-3M3FBS (inhibitor and activator of phospholipase C, respectively; Calbiochem), methyl-β-cyclodextrin (MβCD; Invitrogen), and phorbol-12-myristate-13-acetate (PMA; Sigma) were all purchased commercially. The stock or working solutions of all reagents were prepared, stored, and used according to the manufacturer’s instructions. All working solutions were freshly prepared for each experiment.
Human umbilical vein endothelial cells (HUVECs) were purchased from Xiangya Central Experiment Laboratory (Hunan, China) and were routinely cultured in DMEM (Gibco) supplemented with 10% (w/v) fetal calf serum (Hyclone, South Logan, UT, USA), 100 U/ml penicillin, and 100 μg/ml streptomycin. For all experiments, cell cultures had been passaged ∼5 times.
Human THP-1 monocytic leukemia cells were purchased from the Cell Bank of the Chinese Academy of Sciences (Shanghai, China). THP-1 cells were routinely cultured in RPMI 1640 media (Hyclone) supplemented with 10% FBS, 100 U/ml penicillin, 100 μg/ml streptomycin, and 2 mM l-glutamine. Before stimulation, approximately 1.5 × 10⁵/ml THP-1 cells were seeded in 12-well plates and cultured at 37 °C in a 5% CO2 incubator for 2 days. Then, the cells were differentiated for 2 days in growth medium with addition of PMA (100 ng/ml), washed twice with PBS, and cultured in growth medium without PMA.
2.2. Cell fixation by different types of fixatives
Approximately 2 × 10⁴/ml HUVECs were plated in a petri dish and cultured at 37 °C in a 5% CO2 incubator for 24 h. After washing with PBS, cells were fixed at room temperature (except the OsO4 experiments) with the following fixation strategies: (a) 4% paraformaldehyde (pH ∼7.0) for 20 min; (b) 1.5% or 1% picric acid solution (pH ∼7.1) for 1 h; (c) 2%, 1%, or 0.5% KMnO4 solution (pH ∼7.1) for 1 h; (d) different concentrations of KMnO4 for 1 h and then 4% paraformaldehyde for 20 min; (e) 1% or 0.5% OsO4 solution (pH ∼7.1) at 4 °C for 2 h; (f) 1% or 0.5% OsO4 at 4 °C for 2 h and then 4% paraformaldehyde for 30 min. All fixative solutions were prepared or diluted using PBS and freshly prepared for each experiment. After fixation, the cells were immediately imaged by confocal microscope. In order to make sure whether a slight change in ionic strength of fixative solutions influences the genesis of blebs, we also prepared 3% paraformaldehyde (pH ∼7.2) and 3% paraformaldehyde (pH ∼7.3) by diluting 4% paraformaldehyde (already in PBS when purchased) with PBS and double distilled water, respectively.
2.3. Measurement of fixation-induced blebs on migrating cells
Approximately 5 × 10⁴/ml HUVECs in a petri dish were cultured at 37 °C in the incubator for 24 h to create a confluent cell monolayer. A p100 pipet tip was used to scrape in a straight line to make a “scratch” in the cell monolayer. After cell debris was removed by two washes with PBS and the medium was refreshed, an image of a section of the scratch was taken as a reference image by confocal microscope. Then, the cells were cultured for an additional 6 h in the incubator. After a 20-min fixation with 4% paraformaldehyde, the section of the scratch was imaged again by confocal microscope. The number and radius of blebs on migrating cells in the scratch in each image was counted or measured.
2.4. Inhibitors/activator or MβCD treatments
Approximately 2 × 10⁴/ml HUVECs were plated in a Petri dish and cultured at 37 °C in the incubator for 24 h. After washing with PBS, cells were treated at 37 °C in the incubator with various working reagent solutions at different concentrations: (a) 100, 75, 50, or 25 nM wortmannin for 1 h; (b) 50, 40, 30, or 20 μM LY294002 for 30 min; (c) 10, 8, 6, or 4 μM U-73122 for 30 min; (d) 100 μM m-3M3FBS for 2 min; (e) 10 or 5 mM MβCD for 30 min; (f) 50 μM LY294002 for 30 min, washing with PBS twice, and then 10 mM MβCD for 30 min. After washing with PBS, cells were fixed with 4% paraformaldehyde for 30 min and immediately imaged by confocal microscope. For THP-1-derived macrophages, 100 nM wortmannin, 50 μM LY294002, 10 μM U-73122, and 100 μM m-3M3FBS were used.
2.5. Fluorescence staining of PIP2 and cholesterol
PIP2 staining was performed according to the manufactory provided protocol. Briefly, the cells pre-treated with or without reagents (OsO4, wortmannin, m-3M3FBS, and others as indicated in the corresponding figure legends) were fixed with 4% paraformaldehyde for 20 min at room temperature and rinsed with Tris-buffered saline (TBS) three times. The cells were permeabilized with 0.5% saponin for 15 min at room temperature and washed three times with TBS. After the block with 1% BSA (Solarbio) in TBS overnight at 4 °C, the cells were incubated with biotinylated mouse anti-PIP2 IgM (Echelon Biosciences, UT, USA) at a final concentration of 10 μg/ml in TBS for 60 min at 37 °C followed by TBS washes and subsequent incubation with streptavidin-conjugated Alexa Fluor 555 (Life Technologies, USA) in TBS (1:1000) for 30 min at 37 °C. After rinsing thoroughly with distilled water, the cells were imaged with confocal microscopy.
Cholesterol cell-based detection assay kit (Cayman, USA) was used to fluorescently detect cellular cholesterol. Briefly, the cells pretreated with or without MβCD were fixed with cell-based assay fixative solution for 10 min. After washing with cholesterol detection wash buffer three times, the cells were incubated with filipin solution in the dark for 60 min. After washing with wash buffer two times, the cells were immediately imaged with confocal microscopy.
2.6. Flow cytometry
The treatments and PIP2 staining of cell samples for flow cytometry were similar to the procedures described above. Flow cytometric acquisition and analysis were performed in a FASCScalibur flow cytometer (BD Biosciences, USA).
2.7. Confocal microscopy
An LSM710 confocal microscope (Carl Zeiss, Germany) was used. All images for observation and measurement of fixation-induced blebs were differential interference contrast (DIC) images and obtained with a Zeiss Plan-Neofluar objective (10×/0.30 or 20×/0.50 or 40×/0.75). The fluorescence images for PIP2/cholesterol detection were obtained with a 63× oil immersion objective. Occasionally, a FV1000 confocal microscope (Olympus, Japan) with an UPLAPO objective (40×/0.95) was used for PIP2 imaging.
2.8. Quantification of fixation-induced blebs
Only the blebs on spread cells were measured to exclude potential physiologically generated blebs because blebs seldom form on cultured spread cells under physiological conditions but generally appear on the cells during cytokinesis or at the beginning of cell spreading. To quantify blebs, the largest cross-sectional area of each bleb on a spread cell was measured by Zeiss LSM710 Zen Software and used to calculate the radius of each bleb, based on which the average radius of blebs per cell was calculated as well as a sum of cross-sectional areas of all blebs on the cell. At the same time, the spread area of the same cell was measured by the software. Then, a ratio of the total cross-sectional area of all blebs to the spread area of the cell and the average area ratio per cell were calculated. Previously, we found that the sizes of blebs on a cell inversely correlate with the spread area of the cell [17]. Therefore, analyzing the ratio of the total cross-sectional area of all blebs to the spread area of the cell is able to as much as possible exclude the effect of the degree of cell spreading.
For the data on bleb distribution on spread or migrating cells, besides the average radius of blebs per cell, the amount of blebs on each cell and the average number of blebs per cell were also counted and calculated. On a spread cell with blebs at the edge (cell boundary) but without blebs inside the edge (at cell body), or on a migrating cell with blebs at the leading (front) edge but without blebs at the uropod (rear), the number or size of blebs at the inside or at the rear was counted as zero and also used for statistical analysis. For quantification of fixation-induced blebs on spread cells pre-treated with or without various reagents, both the average radius of blebs per cell and the average area ratio per cell were obtained.
2.9. Statistical analysis
All values shown in the text/table and in the graphs are expressed as the mean ± SD and the mean ± SEM, respectively. Three independent experiments were performed in each experimental group. Statistical analyses were performed using Student’s t test. P < 0.05 was considered a statistically significant difference.
3. Results
3.1. Protein- but not lipid-stabilizing fixatives induce cell blebbing of spread HUVECs
Two putative protein-stabilizing fixatives (paraformaldehyde and picric acid) and two lipid-stabilizing fixatives (KMnO4 and OsO4) were used at different concentrations to fix HUVECs (Fig. 1). We found that fixation with 4% paraformaldehyde for 20 min induced formation of large blebs (∼10 μm in diameter) on almost all spread cells (Fig. 1A) and that fixation with 1.5% (Fig. 1B) or 1% (Fig. 1C) picric acid for 1 h induced formation of relatively small blebs (⩽1–2 μm in diameter) on many spread cells. In contrast, both KMnO4 (2%, 1%, or 0.5%) and OsO4 (1% or 0.5%), alone (Fig. 1D and Fig. 1E, respectively) or successively in combination with 4% paraformaldehyde (data not shown), failed to induce cell blebbing. The results suggest that Protein- but not lipid-stabilizing fixatives can induce cell blebbing of spread HUVECs.
Fig. 1.
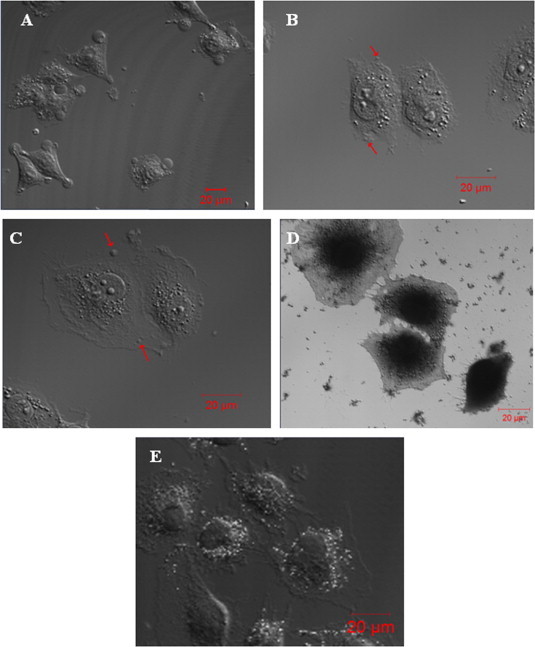
Protein- (paraformaldehyde and picric acid) but not lipid- (KMnO4 and OsO4) stabilizing fixatives induce cell blebbing of spread HUVECs. (A) Fixation with 4% paraformaldehyde at room temperature for 20 min induced large blebs (∼10 μm in diameter) on almost all spread cells. Fixation with (B) 1.5% or (C) 1% picric acid at room temperature for 1 h induced small blebs (⩽1–2 μm in diameter as indicated by the arrows) on many spread cells. (D, E) Fixation with KMnO4 (D) or OsO4 (E) at various concentrations, alone or successively in combination with 4% paraformaldehyde, induced no bleb formation on spread cells (shown are representative images). Scale bar: 20 μm.
3.2. Distribution of fixation-induced blebs on spread or migrating HUVECs
On spread HUVECs, the majority of fixation-induced blebs with 4% paraformaldehyde distributed at the edge/boundary of spread cells: 1.57 ± 1.12 (edge/boundary) vs. 0.54 ± 0.89 (inside/body) in average number of blebs per cell (Fig. 2A). Moreover, the average size of blebs (5.48 ± 2.93 μm in radius) at the edge was much larger than that (1.33 ± 2.27 μm in radius) at the inside/body (Fig. 2B).
Fig. 2.
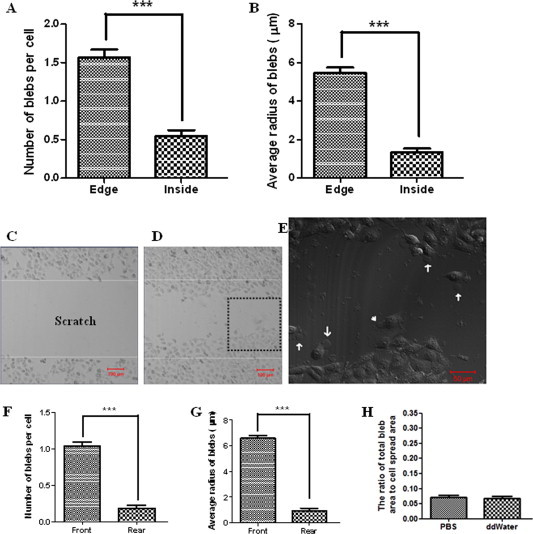
Asymmetric distribution of fixation-induced blebs on spread or migrating HUVECs. Cells were fixed with 4% paraformaldehyde at room temperature for 20 min. (A) The average number of blebs per cell and (B) the average radius of blebs distributing at the edge/boundary or at the inside/body of spread cells. (C) A “scratch” field was shown before cell migration. (D) Many cells migrated into the “scratch” field. (E) The higher-magnification image of fixed migrating cells in the area enlarged from the dashed square in Fig. 2D. Some blebs at the front (arrows) and rear (arrowhead) edges were indicated. (F) The average number of blebs per cell and (G) the average radius of blebs distributing at the front or rear edge of migrating cells. (H) Slight changes in ionic strength and pH value of fixative solutions have no significant effects on the genesis of blebs. The terms “PBS” and “ddWater” in the graph means the cells fixed by 3% paraformaldehyde (pH ∼7.2) and 3% paraformaldehyde (pH ∼7.3), respectively. The fixative solutions were prepared by diluting 4% paraformaldehyde with PBS and double distilled water (ddWater), respectively, causing slight differences in ionic strength and pH value of the two fixative solutions. Scale bar: (C, D) 100 μm; (E) 50 μm.
A scratch method was used to trigger the directional movement of cells (Fig. 2C–E). On migrating HUVECs, the majority of fixation-induced blebs with 4% paraformaldehyde distributed at the leading/front edge of migrating cells: 1.04 ± 0.53 (front) vs. 0.18 ± 0.41 (rear) in average number of blebs per cell (Fig. 2F) and 6.58 ± 2.27 μm (front) vs. 0.91 ± 2.24 μm (rear) in average radius of blebs (Fig. 2G).
In this study, all fixative solutions were prepared or diluted with PBS. However, there were slight differences in ionic strength and/or pH value of various fixative solutions. To determine whether a slight change in ionic strength and/or pH value of fixative solutions influences the genesis of blebs, we also compared the bleb-inducing effects of two fixative solutions at the same fixative concentration but with slight differences in ionic strength and/or pH value, i.e., 3% paraformaldehyde (pH ∼7.2) and 3% paraformaldehyde (pH ∼7.3) by diluting 4% paraformaldehyde (already in PBS when purchased) with PBS and double distilled water, respectively. Our data indicates that a slight change in ionic strength and/or pH value of fixative solutions has no significant effect on cell blebbing (Fig. 2H). However, compared with 4% paraformaldehyde, 3% paraformaldehyde induced much smaller blebs which is consistent with our previous report [17].
3.3. Distribution of PIP2 on spread or migrating HUVECs
An anti-PIP2 IgM was used to specifically detect PIP2 in the plasma membrane of HUVECs. Since PIP2 majorly distributes in the inner leaflet of the plasma membrane, a fixation step (paraformaldehyde fixation here) has to be performed prior to cell staining. Based on this method, we found that PIP2 distributes the entire plane of the plasma membrane of HUVECs (Fig. 3A). Interestingly, however, when the cells were prefixed with 0.5% OsO4 (the lipids in the plasma membrane were supposed to be at least partially stabilized) prior to paraformaldehyde fixation and cell staining, PIP2 also distributed in the entire plasma membrane plane but majorly at the perimeter of spread cells (Fig. 3B) or the leading edge of migrating cells (data not shown).
Fig. 3.
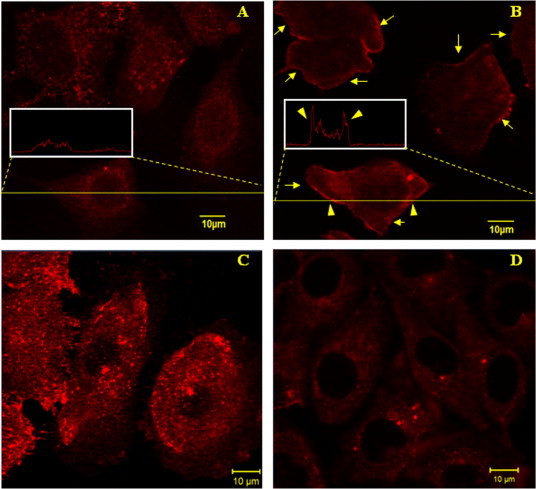
Immunofluorescence imaging of PIP2 on HUVECs. (A) The control. The cells were fixed with 4% paraformaldehyde before permeabilization with saponin and cell staining with biotinylated anti-PIP2 IgM and streptavidin-conjugated Alexa Fluor 555. The inset shows the fluorescence intensity profile of the indicated cross section of a cell. (B) The cells were pretreated with 0.5% OsO4 for 1 h prior to the fixation with 4% paraformaldehyde. PIP2 mainly localizes at the perimeters of the cells as indicated by the arrows. The inset shows the fluorescence intensity profile of the indicated cross section of a cell. The arrowheads in the inset indicate the much higher fluorescence intensity at the perimeters. (C) The cells were pretreated with 100 nM wortmannin for 1 h prior to paraformaldehyde fixation and cell staining. (D) The cells were pretreated with 100 μM m-3M3FBS for 2 min prior to paraformaldehyde fixation and cell staining. Scale bar: 10 μm.
3.4. Different effects of various reagents on PIP2 level in the plasma membrane of HUVECs
Three reagents including wortmannin and LY294002 (two inhibitors of PI3K which lower the generation of phosphatidylinositol 3,4,5-trisphosphate (PIP3) from PIP2) and U-73122 (a specific inhibitor of phospholipase C (PLC) which lowers the hydrolysis of PIP2 into inositol 1,4,5-trisphosphate (IP3) and 1,2-diacylglycerol (DAG)) are supposed to promote cellular PIP2 level. Whereas m-3M3FBS, a direct and potent chemical activator of PLC, is supposed to impair cellular PIP2 level. To confirm these, we also performed immunofluorescence imaging. Compared with the control (Fig. 3A), the PIP2 level on HUVECs was clearly elevated by wortmannin/LY294002/U-73122 treatment (Fig. 3C; the data on LY294002 treatment was shown in a following figure; the data on U-73122 treatment was not shown) but lowered by m-3M3FBS treatment (Fig. 3D). Our flow cytometric data on the mean fluorescence intensity of PIP2 on HUVECs treated by LY294002 or m-3M3FBS (Fig. 4) also coincided with the results from confocal imaging.
Fig. 4.
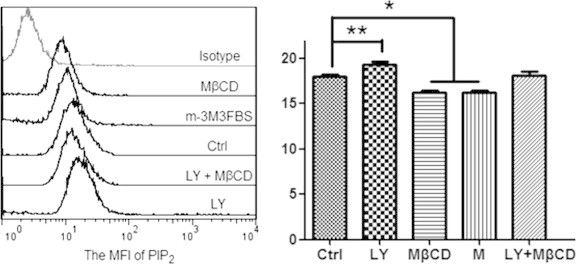
Flow cytometric data shows the different effects of various reagents on the mean fluorescence intensity (MFI) of PIP2 on HUVECs. Left panel: a representative of more than three experiments. Right panel: the statistical histogram of MFI (∗p < 0.05, ∗∗p < 0.01 compared with the control).
3.5. Fixation less readily induces blebbing on spread HUVECs with elevated PIP2 level
Next, the fixation-induced blebbing on HUVECs with elevated PIP2 level was investigated. LY294002, wortmannin, and U-73122 were used at various concentrations to up-regulate PIP2 to different degrees in the plasma membrane of HUVECs. Then, cell blebbing was induced by cell fixation with 4% paraformaldehyde. We found that as the concentration of each inhibitor increased both the average radius of fixation-induced blebs per cell (Table 1) and the average ratio of total bleb area to cell spread area (Fig. 5A–C) gradually decreased and that fixation with 4% paraformaldehyde even failed to induce bleb formation on the HUVECs pre-treated with U-73122 at 10 μM or higher concentrations for 30 min (Fig. 5C). These data suggest that fixation less readily induces blebbing on spread HUVECs with elevated PIP2 level mediated by related inhibitors.
Table 1.
Average radius (μm) of fixation-induced blebs on spread HUVECs pre-treated with or without various reagents at different concentrations. The cells were fixed with 4% paraformaldehyde at room temperature for 30 min. All data are expressed as the mean ± SD (n = the number of cells measured) from three independent experiments.
| LY-294002 (μM) | 0 | 7.43 ± 2.69 (n = 90) |
| 20 | 5.21 ± 3.08 ⁎⁎⁎ (n = 74) | |
| 30 | 4.97 ± 3.13 ⁎⁎⁎ (n = 81) | |
| 40 | 5.13 ± 2.60 ⁎⁎⁎ (n = 86) | |
| 50 | 5.21 ± 2.83 ⁎⁎⁎ (n = 114) | |
| Wortmannin (nM) | 0 | 4.73 ± 2.03 (n = 120) |
| 25 | 4.65 ± 2.18 (n = 84) | |
| 50 | 4.69 ± 2.02 (n = 98) | |
| 75 | 4.00 ± 2.29 ⁎ (n = 86) | |
| 100 | 3.71 ± 2.14 ⁎⁎⁎ (n = 94) | |
| U-73122 (μM) | 0 | 6.04 ± 2.41 (n = 78) |
| 4 | 3.43 ± 2.84 ⁎⁎⁎ (n = 83) | |
| 6 | 1.01 ± 2.30 ⁎⁎⁎ (n = 90) | |
| 8 | 0.20 ± 0.86 ⁎⁎⁎ (n = 99) | |
| 10 | 0 ⁎⁎⁎ | |
| m-3M3FBS (μM) | 0 | 5.41 ± 2.21 (n = 94) |
| 100 | 6.86 ± 2.28 ⁎⁎⁎ (n = 91) | |
| MβCD (mM) | 0 | 6.30 ± 2.40 (n = 118) |
| 5 | 7.09 ± 1.46 ⁎⁎⁎ (n = 100) | |
| 10 | 7.69 ± 1.69 ⁎⁎⁎(n = 95) | |
p < 0.05, compared with the control.
p < 0.001 compared with the control.
Fig. 5.
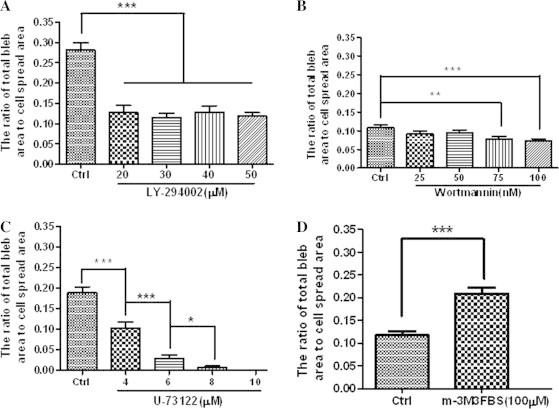
Effects of various reagents at different concentrations on fixation-induced blebbing of spread HUVECs. The Y axis of each graph shows the average area ratio calculated from the ratio of the sum of the largest cross-sectional areas of all fixation-induced blebs on each cell to the spread area of the same cell. HUVECs were pre-treated with or without various reagents and then fixed with 4% paraformaldehyde at room temperature for 30 min. (A) LY294002 (0, 20, 30, 40, or 50 μM for 30 min); (B) wortmannin (0, 25, 50, 75, 100 nM for 1 h); (C) U-73122 (0, 4, 6, 8, 10 μM for 30 min); (D) m-3M3FBS (0 or 100 μM for 2 min). The number of cells measured in each group are indicated in Table 1 (∗p < 0.05, ∗∗p < 0.01, ∗∗∗p < 0.001 compared with the control or as indicated).
3.6. Fixation more readily induces blebbing on spread HUVECs with lower PIP2 level
On the other hand, m-3M3FBS was used to downregulate PIP2 via PIP2 hydrolysis prior to cell fixation with 4% paraformaldehyde. As we predicted, m-3M3FBS pre-treatment caused significant increases in average radius of fixation-induced blebs per cell (Table 1) and average ratio of total bleb area to cell spread area (Fig. 5D). The data suggests that fixation more readily induces blebbing on spread HUVECs with lower PIP2 level mediated by m-3M3FBS.
3.7. Fixation more readily induces blebbing on lipid raft-disrupted spread HUVECs
MβCD is a lipid raft-disrupting reagent by depleting cholesterol. The data on cell-surface staining with filipin (a dye interacting directly with cholesterol) showed that MβCD indeed lowered the cholesterol level significantly (Fig. 6A). Our recently published data has showed that MβCD significantly impairs the level of ganglioside GM1 (a well-known lipid raft marker) in the plasma membrane of HUVECs [22]. Moreover, according to the flow cytometric (Fig. 4) and immunofluorescence imaging (Fig. 6B) data, cholesterol depletion by MβCD also significantly caused the loss of PIP2 in the plasma membrane.
Fig. 6.
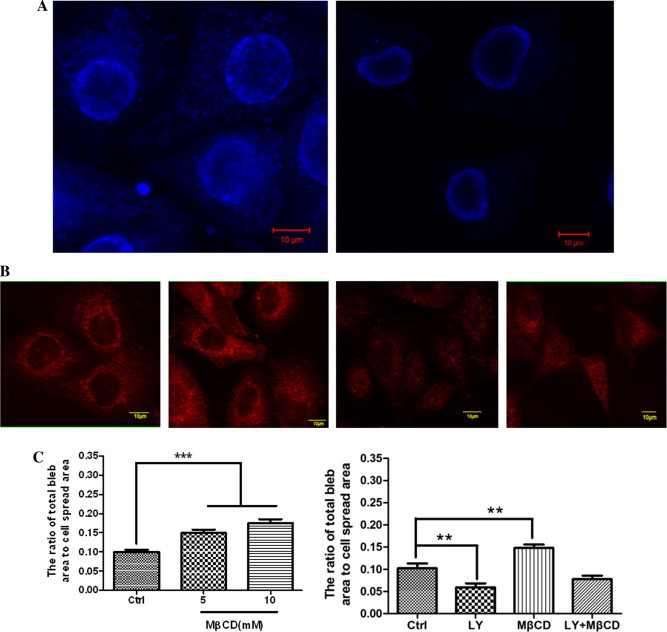
Effect of MβCD on fixation-induced blebbing of spread HUVECs. (A) MβCD causes the loss of cholesterol in the plasma membrane of HUVECs. HUVECs were pre-treated with (right) or without (left) 10 mM MβCD and then subjected to filipin staining and confocal microscopy. Scale bar: 10 μm. (B) MβCD causes the loss of PIP2 in the plasma membrane of HUVECs visualized by confocal microscopy. From left to right: no treatment; treated with 50 μM LY294002 for 30 min; treated with 10 mM MβCD for 30 min; treated with LY294002 first and then MβCD. Scale bar: 10 μm. (C) Quantitative analyses of fixation-induced blebs on MβCD-treated HUVECs. Left panel: HUVECs were pre-treated with MβCD (0, 5, or 10 mM for 30 min) and then fixed with 4% paraformaldehyde at room temperature for 30 min. The number of cells measured in each group are indicated in Table 1 (∗∗∗p < 0.001 compared with the control). Right panel: the cells were treated as indicated in Fig. 6B (∗∗p < 0.01 compared with the control).
Then, we used MβCD to pre-treat cells followed by cell fixation with 4% paraformaldehyde for bleb induction. We found that with the increase of MβCD concentration both the average radius of fixation-induced blebs per cell (Table 1) and the average ratio of total bleb area to cell spread area (left panel of Fig. 6C) increased gradually and significantly. Moreover, MβCD treatment restored the effects of LY294002 treatment on PIP2 level (Fig. 4) and cell blebbing (right panel of Fig. 6C). The data suggests that fixation more readily induces blebbing on lipid raft-disrupted spread HUVECs.
It should be noted that MβCD is a cholesterol-depleting reagent and so MβCD-induced PIP2 loss is an indirect effect or perhaps a by-product. It is reasonable that the effect of MβCD on the loss of PIP2 is not as dramatic as that on the loss of cholesterol. Therefore, in the combination (MβCD plus LY294002) treatment, MβCD did not override the effect of LY-294002 (Fig. 4 and the right panel of Fig. 6C). In the combination treatment, a lower LY-294002 concentration (or a shorter treatment time) or a higher MβCD concentration (or a longer treatment time) might cause a result that MβCD treatment significantly override the effect of LY-294002. More independent experiments might also enhance this result because the combination treatment already induced an obvious decrease (although not statistically significant yet) in cell blebbing when compared with the control (the right panel of Fig. 6C).
3.8. Similar effects of PIP2 level on fixation-induced blebbing of spread macrophages
Finally, we investigated the effects of PIP2 level on fixation-induced blebbing of spread THP-1-derived macrophages, another type of adherent cells. Both the average radius of fixation-induced blebs per cell (Table 2) and the average ratio of total bleb area to cell spread area (Fig. 7) significantly decreased after promoting the PIP2 level by each one of the three inhibitors (LY294002, wortmannin, and U-73122) or significantly increased after lowering the PIP2 level by m-3M3FBS. The data suggests that fixation-induced bleb formation on spread macrophages also inversely correlates with PIP2 level.
Table 2.
Average radius (μm) of fixation-induced blebs on spread THP-1-derived macrophages pre-treated with various reagents. The cells were fixed with 4% paraformaldehyde at room temperature for 30 min. All data are expressed as the mean ± SD (n = the number of cells measured) from three independent experiments.
| Control | 2.99 ± 1.21 (n = 188) |
| LY-294002 (50 μM) | 1.93 ± 1.97 ⁎⁎⁎ (n = 277) |
| Wortmannin (100 nM) | 1.81 ± 1.78 ⁎⁎⁎ (n = 251) |
| U-73122 (10 μM) | 1.08 ± 1.65 ⁎⁎⁎ (n = 275) |
| m-3M3FBS (100 μM) | 3.27 ± 3.59 ⁎⁎⁎ (n = 243) |
p < 0.001 compared with the control.
Fig. 7.
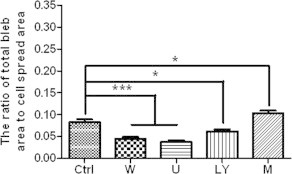
Effects of various reagents on fixation-induced blebbing of spread THP-1-derived macrophages. THP-1-derived macrophages were pre-fixed with or without wortmannin (100 nM for 1 h), U-73122 (10 μM for 30 min), LY294002 (50 μM for 30 min), or m-3M3FBS (100 μM for 2 min) followed by paraformaldehyde fixation. The number of cells measured in each group are indicated in Table 2 (∗p < 0.05, ∗∗∗p < 0.001 compared with the control).
4. Discussion
Bleb formation generally involves two different mechanisms, a local detachment of the plasma membrane from the actin cortex or a local rupture of the cortex [10]. Under physiological condition, partially or fully spread cultured HUVECs do not bleb. When fixed with a certain concentration of aldehyde fixatives (e.g., ⩾0.5% of glutaraldehyde or ⩾2% of formaldehyde/paraformaldehyde), cell blebbing was induced[17]. At a high concentration (e.g., 2.5% glutaraldehyde or 4% formaldehyde/paraformaldehyde), after addition the fixatives immediately fixed the cells completely since we observed that the whole cells and the cell-surface particles were motionless under time-lapse confocal microscopy [17] whereas many cell blebs appeared several minutes later (data not shown). On the other hand, at low temperature (e.g., 4 °C) the behavior of enzymes, protein–protein interactions, and intracellular signaling will generally slow down, including the cortex-related behaviors. However, aldehyde fixatives at low temperature still can induce bleb formation dramatically in number and size [17]. These observations suggest that the actin cortex has potentially been fixed immediately after the addition of the fixative solution particularly at relatively high concentrations and therefore the local rupture of the cortex was not, or at least not majorly, responsible for bleb formation although there were no strong evidence to exclude the possibility that aldehyde fixation can cause the local rupture of the cortex.
It is well known that aldehyde fixatives mainly stabilize proteins but not lipids. Therefore, we speculated whether this characteristic of aldehyde fixatives might cause local detachments of the plasma membrane from the cortex and then initiate cell blebbing. To test this hypothesis, two putative protein-fixing fixatives (paraformaldehyde and picric acid) and two putative lipid-stabilizing fixatives (OsO4 and KMnO4) [23,24] were used separately or successively to fix HUVECs. We found that the protein-fixing fixatives induced bleb formation on almost all cells whereas the lipid-stabilizing fixatives alone, or successively in combination with paraformaldehyde, failed to induce cell blebbing (Fig. 1). The data suggest that fixation-induced bleb formation may be related to the inability of protein-stabilizing fixatives to stabilize lipids. The phenomenon that fixation through direct osmium or rapid freezing was unable to induce cell blebbing on platelets or purple sea-urchin eggs has been reported previously and also been suggested that fixation-induced blebbing is caused by the inability of aldehyde fixatives to stabilize lipids [25,26]. The inability of aldehyde fixatives to stabilize lipids may cause at least two potential consequences: a loss of lipids from cells and a failure to arrest lipid mobility within the plasma membrane undergoing rapid changes, both of which may probably weaken the plasma membrane–cytoskeleton coupling.
In the last decade, PIP2 that is a specialized lipid of cellular membranes in eukaryotes and constitutively present in the plasma membrane has been reported to play key roles in membrane–cytoskeleton attachment [27,28]. A pool of PIP2 in the inner leaflet of the plasma membrane directly but reversibly binds to many cytoskeletal proteins (e.g., the ERM-family proteins, Band III, and glycophorin) and its level in the plasma membrane is regarded to be the string-puller behind controlling the plasma membrane–cytoskeleton adhesion [29,30,31]. Therefore, we speculated that fixation-induced cell blebbing relates to the inability of aldehyde fixatives to stabilize PIP2 (local loss or delocalization of PIP2 from cytoskeleton-attaching sites of the plasma membrane, i.e., lower PIP2 levels at these membrane sites) which may weaken the membrane–cytoskeleton attachment and then cause a local detachment of the plasma membrane from the actin cortex.
To test this speculation, we first determined whether the distribution of PIP2 coincides with that of fixation-induced cell blebs on cells. We found that fixation-induced blebs are mainly localized at the cell perimeter of spread cells and at the leading edge of migrating cells (Fig. 2). However, immunofluorescence imaging using anti-PIP2 antibody failed to observe similar distribution pattern of PIP2 (Fig. 3A). We noticed that in this approach paraformaldehyde fixation was needed before cell staining. Therefore, to determine whether aldehyde fixation probably caused the change in the distribution of PIP2 due to the fixation-induced loss or delocalization of PIP2, OsO4 was used to stabilize membrane lipids (including PIP2) prior to cell fixation with paraformaldehyde. Then, similar distribution pattern of PIP2 to that of blebs was observed, i.e., PIP2 mainly distributed at the perimeters or the leading edges of OsO4-fixed cells (Fig. 3B).
To further test the speculation, we used multiple specific inhibitors or activator to up- or down-regulate the levels of PIP2 in the plasma membrane of spread cells prior to cell fixation to see whether the up- or down-regulation of PIP2 level significantly influence fixation-induced blebbing. Wortmannin and LY294002, two inhibitors of PI3K which lower the generation of PIP3 from PIP2, and U-73122, a PLC inhibitor which lowers the hydrolysis of PIP2 into IP3 and DAG, were used to up-regulate the PIP2 level (Fig. 3C and data not shown) prior to cell fixation; whereas m-3M3FBS, an activator of PLC, was used to down-regulate the PIP2 level (Fig. 3D) by promoting local PIP2 breakdown into IP3 and DAG. The flow cytometric data also confirmed these effects of various reagents on PIP2 level (Fig. 4). As expected, compared with the controls the PIP2-upregulated spread cells (including HUVECs and THP-1-derived macrophages) were more difficult to bleb upon cell fixation with 4% paraformaldehyde whereas cell blebbing was more readily induced by cell fixation on the PIP2-downregulated spread cells (Tables 1 and 2, Figs. 5 and 7).
It has been revealed that lipid rafts (cholesterol-rich membrane microdomains) are essential for membrane–cytoskeleton coupling[32] and that a pool of PIP2 is enriched in lipid rafts[33,34,35]. A widely used lipid raft-disrupting cyclic oligosaccharide, MβCD which removes cholesterol from the cellular membranes (Fig. 6A), is able to cause the loss of PIP2 compartmentalization in lipid rafts[21]. Our flow cytometric (Fig. 4) and fluorescence imaging (Fig. 6B) data indeed showed the MβCD-induced loss of PIP2 in the plasma membrane of HUVECs. Therefore, we speculated that MβCD treatment might make spread cells prone to fixation-induced blebbing due to disruption of lipid rafts or loss of PIP2 compartmentalization which is related with local breakdown of membrane–cytoskeleton coupling. Our data show that cell blebbing was more readily induced by cell fixation on the MβCD-pretreated spread cells compared with the control (Table 1 and Fig. 6C), confirming the above-mentioned speculation.
Taken together, fixation-induced blebbing of spread adherent cells inversely correlates with PIP2 level. It may relate to the inability of protein-fixing fixatives to stabilize specific lipids like PIP2. Whether there are other specific lipids involved in fixation-induced blebbing needs to be further investigated. Fixation-induced local loss or delocalization of PIP2 from cytoskeleton-attaching sites of the plasma membrane (lower PIP2 levels at these sites) may lead to down-regulation of membrane–cytoskeleton adhesions [36] or local detachments of the plasma membrane from the cytoskeleton and finally induce the hydrostatic pressure-powered blebbing of spread cells on/in which proteins have been completely fixed with protein-stabilizing fixatives.
Acknowledgments
This study was supported by the National Natural Science Foundation of China (31260205) and the Scientific Research Foundation for Returned Overseas Chinese Scholar of State Education Ministry.
References
- 1.Bereiter-Hahn J., Luck M., Miebach T., Stelzer H.K., Voth M. Spreading of trypsinized cells: cytoskeletal dynamics and energy requirements. J. Cell Sci. 1990;96(Pt 1):171–188. doi: 10.1242/jcs.96.1.171. [DOI] [PubMed] [Google Scholar]
- 2.Erickson C.A., Trinkaus J.P. Microvilli and blebs as sources of reserve surface membrane during cell spreading. Exp. Cell Res. 1976;99(2):375–384. doi: 10.1016/0014-4827(76)90595-4. [DOI] [PubMed] [Google Scholar]
- 3.Charras G., Paluch E. Blebs lead the way: how to migrate without lamellipodia. Nat. Rev. Mol. Cell Biol. 2008;9(9):730–736. doi: 10.1038/nrm2453. [DOI] [PubMed] [Google Scholar]
- 4.Bergert M., Chandradoss S.D., Desai R.A., Paluch E. Cell mechanics control rapid transitions between blebs and lamellipodia during migration. Proc. Natl. Acad. Sci. U.S.A. 2012;109(36):14434–14439. doi: 10.1073/pnas.1207968109. [DOI] [PMC free article] [PubMed] [Google Scholar]
- 5.Hickson G.R., Echard A., O’Farrell P.H. Rho-kinase controls cell shape changes during cytokinesis. Curr. Biol. 2006;16(4):359–370. doi: 10.1016/j.cub.2005.12.043. [DOI] [PMC free article] [PubMed] [Google Scholar]
- 6.Boucrot E., Kirchhausen T. Endosomal recycling controls plasma membrane area during mitosis. Proc. Natl. Acad. Sci. U.S.A. 2007;104(19):7939–7944. doi: 10.1073/pnas.0702511104. [DOI] [PMC free article] [PubMed] [Google Scholar]
- 7.Coleman M.L., Sahai E.A., Yeo M., Bosch M., Dewar A., Olson M.F. Membrane blebbing during apoptosis results from caspase-mediated activation of ROCK I. Nat. Cell Biol. 2001;3(4):339–345. doi: 10.1038/35070009. [DOI] [PubMed] [Google Scholar]
- 8.Barros L.F., Kanaseki T., Sabirov R., Morishima S., Castro J., Bittner C.X., Maeno E., Ando-Akatsuka Y., Okada Y. Apoptotic and necrotic blebs in epithelial cells display similar neck diameters but different kinase dependency. Cell Death Differ. 2003;10(6):687–697. doi: 10.1038/sj.cdd.4401236. [DOI] [PubMed] [Google Scholar]
- 9.Mercer J., Helenius A. Vaccinia virus uses macropinocytosis and apoptotic mimicry to enter host cells. Science. 2008;320(5875):531–535. doi: 10.1126/science.1155164. [DOI] [PubMed] [Google Scholar]
- 10.Charras G.T. A short history of blebbing. J. Microsc. 2008;231(3):466–478. doi: 10.1111/j.1365-2818.2008.02059.x. [DOI] [PubMed] [Google Scholar]
- 11.Tinevez J.Y., Schulze U., Salbreux G., Roensch J., Joanny J.F., Paluch E. Role of cortical tension in bleb growth. Proc. Natl. Acad. Sci. U.S.A. 2009;106(44):18581–18586. doi: 10.1073/pnas.0903353106. [DOI] [PMC free article] [PubMed] [Google Scholar]
- 12.Charras G.T., Coughlin M., Mitchison T.J., Mahadevan L. Life and times of a cellular bleb. Biophys. J. 2008;94(5):1836–1853. doi: 10.1529/biophysj.107.113605. [DOI] [PMC free article] [PubMed] [Google Scholar]
- 13.Charras G.T., Hu C.K., Coughlin M., Mitchison T.J. Reassembly of contractile actin cortex in cell blebs. J. Cell Biol. 2006;175(3):477–490. doi: 10.1083/jcb.200602085. [DOI] [PMC free article] [PubMed] [Google Scholar]
- 14.Scott R.E., Perkins R.G., Zschunke M.A., Hoerl B.J., Maercklein P.B. Plasma membrane vesiculation in 3T3 and SV3T3 cells. I. Morphological and biochemical characterization. J. Cell Sci. 1979;35:229–243. doi: 10.1242/jcs.35.1.229. [DOI] [PubMed] [Google Scholar]
- 15.Scott R.E., Maercklein P.B. Plasma membrane vesiculation in 3T3 and SV3T3 cells. II. Factors affecting the process of vesiculation. J. Cell Sci. 1979;35:245–252. doi: 10.1242/jcs.35.1.245. [DOI] [PubMed] [Google Scholar]
- 16.Fox C.H., Johnson F.B., Whiting J., Roller P.P. Formaldehyde fixation. J. Histochem. Cytochem. 1985;33(8):845–853. doi: 10.1177/33.8.3894502. [DOI] [PubMed] [Google Scholar]
- 17.Zeng F., Yang W., Huang J., Chen Y., Chen Y. Determination of the lowest concentrations of aldehyde fixatives for completely fixing various cellular structures by real-time imaging and quantification. Histochem. Cell Biol. 2013;139(5):735–749. doi: 10.1007/s00418-012-1058-5. [DOI] [PubMed] [Google Scholar]
- 18.Scott R.E. Plasma membrane vesiculation: a new technique for isolation of plasma membranes. Science. 1976;194(4266):743–745. doi: 10.1126/science.982044. [DOI] [PubMed] [Google Scholar]
- 19.Johnson R.C., Augustin-Voss H.G., Zhu D.Z., Pauli B.U. Endothelial cell membrane vesicles in the study of organ preference of metastasis. Cancer Res. 1991;51(1):394–399. [PubMed] [Google Scholar]
- 20.Baumgart T., Hammond A.T., Sengupta P., Hess S.T., Holowka D.A., Baird B.A., Webb W.W. Large-scale fluid/fluid phase separation of proteins and lipids in giant plasma membrane vesicles. Proc. Natl. Acad. Sci. U.S.A. 2007;104(9):3165–3170. doi: 10.1073/pnas.0611357104. [DOI] [PMC free article] [PubMed] [Google Scholar]
- 21.Pike L.J., Miller J.M. Cholesterol depletion delocalizes phosphatidylinositol bisphosphate and inhibits hormone-stimulated phosphatidylinositol turnover. J. Biol. Chem. 1998;273(35):22298–22304. doi: 10.1074/jbc.273.35.22298. [DOI] [PubMed] [Google Scholar]
- 22.Wu L., Huang J., Yu X., Zhou X., Gan C., Li M., Chen Y. AFM of the ultrastructural and mechanical properties of lipid-raft-disrupted and/or cold-treated endothelial cells. J Membr Biol. 2014;247(2):189–200. doi: 10.1007/s00232-013-9624-x. [DOI] [PubMed] [Google Scholar]
- 23.Ongun A., Thomson W.W., Mudd J.B. Lipid fixation during preparation of chloroplasts for electron microscopy. J. Lipid Res. 1968;9(4):416–424. [PubMed] [Google Scholar]
- 24.Korn E.D., Weisman R.A. I. Loss of lipids during preparation of amoebae for electron microscopy. Biochim. Biophys. Acta. 1966;116(2):309–316. doi: 10.1016/0005-2760(66)90013-0. [DOI] [PubMed] [Google Scholar]
- 25.Morgenstern E. Aldehyde fixation causes membrane vesiculation during platelet exocytosis: a freeze-substitution study. Scanning Microsc. Suppl. 1991;5(4):S109–115. [PubMed] [Google Scholar]
- 26.Chandler D.E. Comparison of quick-frozen and chemically fixed sea-urchin eggs: structural evidence that cortical granule exocytosis is preceded by a local increase in membrane mobility. J. Cell Sci. 1984;72:23–36. doi: 10.1242/jcs.72.1.23. [DOI] [PubMed] [Google Scholar]
- 27.Shewan A., Eastburn D.J., Mostov K. Phosphoinositides in cell architecture. Cold Spring Harb. Perspect. Biol. 2011;3(8):a004796. doi: 10.1101/cshperspect.a004796. [DOI] [PMC free article] [PubMed] [Google Scholar]
- 28.Zhang L., Mao Y.S., Janmey P.A., Yin H.L. Phosphatidylinositol 4,5 bisphosphate and the actin cytoskeleton. Subcell. Biochem. 2012;59:177–215. doi: 10.1007/978-94-007-3015-1_6. [DOI] [PubMed] [Google Scholar]
- 29.Nebl T., Oh S.W., Luna E.J. Membrane cytoskeleton: PIP(2) pulls the strings. Curr. Biol. 2000;10(9):R351–354. doi: 10.1016/s0960-9822(00)00465-6. [DOI] [PubMed] [Google Scholar]
- 30.Saarikangas J., Zhao H., Lappalainen P. Regulation of the actin cytoskeleton-plasma membrane interplay by phosphoinositides. Physiol. Rev. 2010;90(1):259–289. doi: 10.1152/physrev.00036.2009. [DOI] [PubMed] [Google Scholar]
- 31.Golebiewska U., Nyako M., Woturski W., Zaitseva I., McLaughlin S. Diffusion coefficient of fluorescent phosphatidylinositol 4,5-bisphosphate in the plasma membrane of cells. Mol. Biol. Cell. 2008;19(4):1663–1669. doi: 10.1091/mbc.E07-12-1208. [DOI] [PMC free article] [PubMed] [Google Scholar]
- 32.Levitan I., Gooch K.J. Lipid rafts in membrane-cytoskeleton interactions and control of cellular biomechanics: actions of oxLDL. Antioxid. Redox Signal. 2007;9(9):1519–1534. doi: 10.1089/ars.2007.1686. [DOI] [PubMed] [Google Scholar]
- 33.Pike L.J., Casey L. Localization and turnover of phosphatidylinositol 4,5-bisphosphate in caveolin-enriched membrane domains. J. Biol. Chem. 1996;271(43):26453–26456. doi: 10.1074/jbc.271.43.26453. [DOI] [PubMed] [Google Scholar]
- 34.van Rheenen J., Achame E.M., Janssen H., Calafat J., Jalink K. PIP2 signaling in lipid domains: a critical re-evaluation. EMBO J. 2005;24(9):1664–1673. doi: 10.1038/sj.emboj.7600655. [DOI] [PMC free article] [PubMed] [Google Scholar]
- 35.Fujita A., Cheng J., Tauchi-Sato K., Takenawa T., Fujimoto T. A distinct pool of phosphatidylinositol 4,5-bisphosphate in caveolae revealed by a nanoscale labeling technique. Proc. Natl. Acad. Sci. U.S.A. 2009;106(23):9256–9261. doi: 10.1073/pnas.0900216106. [DOI] [PMC free article] [PubMed] [Google Scholar]
- 36.Sheetz M.P. Cell control by membrane-cytoskeleton adhesion. Nat. Rev. Mol. Cell Biol. 2001;2(5):392–396. doi: 10.1038/35073095. [DOI] [PubMed] [Google Scholar]