Abstract
Background
BTG3/ANA/APRO4 is a candidate tumor suppressor gene in some malignancies. We report here that BTG3 is transcriptionally down-regulated in prostate cancer and the mechanism of inactivation is through promoter hypermethylation.
Methods
Prostate cancer and normal cell lines were treated with different doses of genistein and 5-aza-2’-deoxycytidine (5Aza-C). BTG3 mRNA expression was determined by quantitative real-time PCR in tissues and cell lines. BS-PCR, cloning and sequencing were used to examine promoter methylation in tumor samples and cell lines. Enzyme activity/inhibition assays were done to check the effect of genistein and 5Aza-C on DNA methyltransferases. ChIP assay was performed to analyze chromatin modifications caused by genistein treatment.
Results
BTG3 mRNA expression was down-regulated in cancer tissues and cells. Genistein and 5Aza-C induced BTG3 mRNA expression in all PC cell lines. Complete methylation of BTG3 promoter in tumor samples and cancer cell lines was observed. Genistein and 5Aza-C treatment significantly decreased promoter methylation, reactivating BTG3 expression. Genistein and 5Aza-C increased levels of acetylated histones 3, 4, 2H3K4, 3H3K4 and Pol II, decreased DNMTase, MBD2 activity and increased HAT activity.
Conclusion
This is the first report to show that BTG3 is silenced in prostate cancer and can be reactivated by genistein induced promoter demethylation and active histone modification. Genistein showed similar effects to that of 5Aza-C, which is currently undergoing phase II clinical trials as a treatment for prostate cancer. Since genistein is a natural, non-toxic, dietary isoflavone, these results indicate that genistein is a novel, advantageous therapeutic agent for treating prostate cancer.
Keywords: Prostate cancer, genistein, BTG3, DNA methylation, Histone modification
Introduction
Cell cycle progression is tightly controlled by the sequential activation of proliferative and antiproliferative genes. Imbalance in this control system can lead to malignant transformation. Initially, most cancers were thought to arise through activation of oncogenes. However, increasing evidence indicates that loss of function of tumor suppressor genes represents a major route to tumor development. Extensive searches using diverse strategies have since led to the identification of a number of antiproliferative genes including for example P53 and RB1, cyclin-dependent kinase inhibitors (CDK) and more recently the BTG1, BTG2 and BTG3 genes 1-3.
BTG3/ANA/APRO4 is a member of the antiproliferative BTG (B-cell translocation gene)/Tob (Transducer of ErbB2) gene family, which also includes BTG1, BTG2/TIS21/PC3, Tob, Tob2 and PC3b 4. These proteins are characterized by a BTG1/APRO homology domain in their N-terminal regions, within which reside two highly conserved motifs, box A and box B. The BTG3 gene was isolated in a low-stringency cDNA library screening using BTG1 and BTG2 as probes 3. The protein also seemed to be antiproliferative, as its introduction into NIH3T3 cells reduced BrdU incorporation 5. More recently, BTG3 was found to associate with and inhibit Src tyrosine kinase in PC12 cells 6 and a direct transcriptional target of p53 7.
The regulation of gene expression in eukaryotes is complex and multilayered. Gene regulation may be exerted at the level of initiation of transcription, following transcription, or through epigenetic events. Hypermethylation of DNA is a key epigenetic mechanism for the silencing of many genes, including those for cell cycle regulation, receptors, DNA repair, and apoptosis 8, 9. It is responsible for chromosome condensation and transcription repression 10, 11. The second mechanism of epigenetic transcriptional control results from histone modifications. Although histone modification and DNA methylation are both independent processes, they are also integrally linked 12. For example, DNMTs are known to recruit HDACs, leading to histone deacetylation and transcriptional repression 13, 14. In addition, MBDs can independently recruit HDACs to the site of DNA methylation 15, 16. A number of in vitro studies have demonstrated that DNA methylation and histone deacetylation may co-operate to repress gene transcription 17, 18. The inhibition of DNMT, especially DNMT1, blocks the hypermethylation of the newly synthesized DNA strand, resulting in the reversal of hypermethylation and the re-expression of the silenced genes 14, 19, 20. Indeed, this point has been demonstrated by studies with DNMT inhibitors, DAC (also known as 5-aza-2'-deoxycytidine) and zebularine. These compounds have been shown to inhibit cancer cell growth, induce cancer cell apoptosis, and reduce tumor volume in mice 21-24. There is a high potential for developing this group of inhibitors for cancer therapy, however side effects and toxicity are serious concerns. Therefore, there is a great need for the development of effective, nontoxic inhibitors of promoter hypermethylation and histone deacetylation.
In the present study, we tested the hypothesis that genistein can induce expression of BTG3 genes through promoter de-methylation and induction of active chromatin modifications in prostate cancer. We also investigated the effect of genistein on various enzymatic activities (DNMT, HAT, HDAC and MBD2) that are involved in promoter hyper-methylation and histone modification in prostate cancer cell lines and compared the results with that of 5Aza-C.
Materials and Methods
Tissue samples and cell culture
Tissue samples from radical prostatectomy's were obtained from the Veterans Affairs Medical Center, San Francisco, CA. Informed consent was obtained from all patients. A board certified pathologist processed the specimens according to protocol, snap frozen in liquid nitrogen and stored at −80°C.
Human prostate carcinoma cell lines (LNCaP, PC3) and a normal epithelial prostate cell line (RWPE-1) were obtained from the American Type Culture Collection (Manassas, VA). The prostate cancer cell lines were cultured as monolayers in RPMI medium supplemented with 10% fetal bovine serum (Hyclone, Logan, UT), 50 ug/mL penicillin, 50 ug/mL streptomycin (Invitrogen, Carlsbad, CA), and maintained in an incubator with a humidified atmosphere of 95% air and 5% CO2 at 37°C. The RWPE- 1 cells were cultured in keratinocyte growth medium supplemented with 5 ng/mL human recombinant epidermal growth factor, 0.05 mg/mL bovine pituitary extract (Gibco/Invitrogen, Carlsbad, CA) and maintained in an incubator under the conditions described above. Subconfluent cells (60-70% confluent) were treated with varying concentrations of genistein (0, 10, 25 and 50 umol/L) (Sigma, St. Louis, MO) dissolved in DMSO or 5-Aza-2’-deoxycytidine (5umol/L) (Sigma, St. Louis, MO) and cells treated with vehicle (DMSO) served as control. The cells were treated with fresh genistein and 5Aza-C everyday along with change of media and grown for 3 days (genistein) or 5 days (5Aza-C).
RNA/DNA extraction from clinical samples and cell lines
Total RNA was extracted using a combination of TRIzolreagent (Invitrogen) and RNeasy columns (Qiagen, Valencia, CA). Fresh prostate tissues, however, were homogenized in 1ml TRIzol reagent. After the addition of 0.2 ml chloroform, samples were centrifuged for 15 minutes at 14000 × rpm. The aqueous phase was moved to a new centrifuge tube and re-suspended with one half volume of 100% ethanol. Samples were then applied to an RNeasy mini-column. For DNA digestion, an Ambion DNA-Free kit was used according to the manufacturer's protocol. RNA quality was assessed using a NanoDrop ND-1000 (NanoDrop Technologies, Wilmingon, DE) spectrophotometer. Extracted RNA was stored at –80°C.
Genomic DNA was extracted from paraffin-embedded non-cancerous and cancerous microdissected prostate tissues which were obtained from the Veterans Affairs Medical Center, San Francisco. Genomic DNA was also extracted from pathologically proven benign prostate hypertrophy (BPH) samples. A DNA mini kit (Qiagen, Valencia, CA) was used to extract DNA from tissue according to the manufacturer's protocols.
Genomic DNA and RNA were extracted from 80% confluent plates of cultured cells using AllPrep DNA/RNA Mini Kit (Qiagen, Valencia, CA) according to the manufacturer's directions.
Quantitative real time PCR
First strand cDNA was prepared from total RNA (1 ug) using the Reverse Transcription System (Promega Corp. Madison, WI, USA).
In the real-time PCR step, cDNA was amplified with Inventoried Gene Assay Products containing two gene-specific primers and one TaqMan MGB probe (6-FAM dye-labeled) using the TaqMan Universal Fast PCR Master Mix in a 7500 Fast Real Time PCR System (Applied Biosystems). Thermal cycling conditions included 95°C for 20 seconds, 40 cycles of 95°C for 3 seconds, and 60°C for 30 seconds according to the TaqMan Fast Universal PCR Protocol. GAPDH was used as an endogenous control and vehicle control was used as a calibrator. Each sample was run in four wells. The comparative Ct method was used to calculate the relative changes in gene expression in the 7500 Fast Real Time PCR System. The relative changes of gene expression were calculated using the following formula: Fold change in gene expression, 2−ΔΔCt = 2−where ΔCt = Ct (detected genes) – Ct (GAPDH) and Ct represents threshold cycle number.
Sodium bisulfite modification and sequencing
Bisulfite modification of DNA was performed using the Epi-Tect Bisulfite kit (Qiagen, Valencia, CA) following the manufacturer's directions. The basic principle of Bisulfite modification of DNA is that in the bisulfite reaction, all unmethylated cytosines are deaminated and sulfonated, converting them to thymines, while methylated cytonies (5-methylcytosines) remain unaltered. Thus, the sequence of the treated DNA will differ depending on whether the DNA is originally methylated or unmethylated. Primers for bisulfite genomic sequencing PCR were designed by using the online program MethPrimer 25. The primer sequences are shown in Fig. 2, B. All reactions for tissue samples were subjected to two rounds of amplifications using a nested primer approach. Bisulfite-modified DNA (1ul) was amplified using a primer pair in a total volume of 20ul. Aliquots (2ul) of the first PCR reactions were subjected to second round amplifications using a pair of nested primer pairs in a total volume of 30ul. The amplification products were confirmed by electrophoresis on a 2% agarose gel and sequenced directly by an outside vendor (McLab, South San Francisco, CA).
Figure 2.
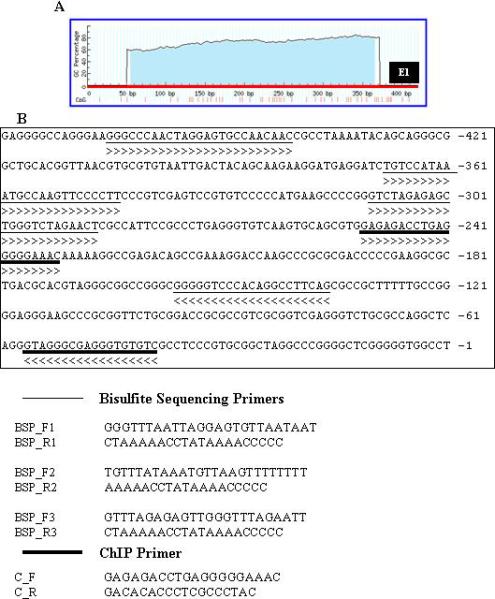
A, Graphic depiction of the CpG islands in the promoter of BTG3 gene. B, Position and sequence of primers used for BSP and ChIP.
Cloning for methylation confirmation
Bisulfite modification of DNA from selected samples was performed as described above. The modified DNA was amplified using nested PCR with primer sets F1R1 and F3R3 and the products were confirmed by electrophoresis. Amplified products were cloned into the pCR2.1-Topo vector using TOPO TA Cloning Kit (Invitrogen, Carlsbad, CA). Ten to fifteen colonies were randomly chosen for culture and DNA was purified using PureLink Quick Plasmid Miniprep Kit (Invitrogen, Carlsbad, CA) and sequenced by an outside vendor (Quintara Biosciences, Albany, CA).
Chromatin immunoprecipitation (ChIP) analysis
ChIP analysis was performed using the EZ-ChIP kit (Upstate Biotechnology, Charlottesville, VA) according to the manufacturer's directions. Antibodies used in the immunoprecipitations were purchased from Upstate Biotechnology and Ambion and were specific for acetyl histone H3 (06-599), acetyl histone H4 (06-866), dimethyl-histone H3 lysine 4 (07-030), trimethyl-histone H3 lysine 4(07-473), dimethyl-histone H3 lysine 9 (07-441), trimethyl-histone H3 lysine 9 (ab8898) and anti polymerase II (05-623). The immunoprecipitated DNA was eluted in a total volume of 50 ul and 2 ul were used for PCR which was performed with an annealing temperature of 60°C for a total of 28 cycles. The amplified DNA was electrophoresed in a 2% agarose gel and visualized by staining with ethidium bromide. The ImageJ Software version 1.36b (http://rsb.info.nih.gov/ij/) was used for optical densitometry. For enrichment calculation, each sample was normalized with their respective input samples and then the treated samples were compared with their untreated controls for each used antibody. In short enrichment was calculated as the ratio between the net intensity of each bound sample normalized to its input sample and the vehicle control sample normalized to vehicle control input samples (Bound sample/Bound sample Input)/(Vehicle control sample/Vehicle control Input). The sequence of primers is given in Fig. 2 B.
DNA Methyltransferase (DNMTase), Methyl-CpG-binding domain protein 2 (MBD2) activities and DNMT1, DNMT3a and DNMT3b Assays
Total DNA methyltransferase and MBD2 activities were measured using the EpiQuik DNA Methyltransferase and EpiQuik MBD2 Activity/Inhibition Assay Kits respectively, (Epigentek, Brooklyn, NY). Nuclear extracts were isolated using the EpiQuik Nuclear Extraction Kit (Epigentek, Brooklyn, NY). The experiments were carried out according to the manufacturer's protocols. In brief, nuclear extracts were bound to the specific substrates forming a complex. This complex was captured using a specific capture antibody and recognized by a specific detection antibody. Enzymatic activity was measured calorimetrically through an ELISA-like reaction. DNMT activity (O.D./h/ml) was calculated according to the formula: (Sample OD – blank OD)/(sample volume) × 1000, and MBD2 binding percentage was calculated according to the following formula: (O.D (treated sample – blank )/(O.D (untreated control – blank) × 100%, according to the manufacturer's instructions. Nuclear extracts were assayed for individual DNMT proteins of interest (DNMT1, DNMT3a, or DNMT3b) using the Epiquik DNMT1, −3a, and −3b assay kits, respectively (Epigentek, Brooklyn, NY). Protein standards of known concentration (30 ng, 20 ng, 10 ng, and 2 ng) were included to generate a standard curve. The amount of DNMT protein was calculated as follows: DNMT protein (ng/ml) = (Sample OD – blank OD/standard slope) × sample dilution, according to the manufacturer's instructions.
Histone acetylase (HAT) and Histone deacetylase (HDAC) Analysis
Total HAT and HDAC activities were measured using the EpiQuik HAT and EpiQuik HDAC Activity/Inhibition Assay Kits, respectively (Epigentek, Brooklyn, NY). In brief, the nuclear extracts were incubated with specific substrate for 1 hour at 37°C, followed by capture antibody for 60 minutes, and then detection antibody for 30 minutes at room temperature. Absorbance was determined using a microplate spectrophotometer at 450 nm. HAT activity (ng/h/mg) [(Sample OD – blank OD)/(slope × h × protein amount (μg) added into the assay) × 1000] and HDAC activity (ng/h/ml) [{O.D (control – blank) – O.D (sample – blank)/Slope × h} × sample dilution] were measured according to the manufacturer's instructions.
Statistical Analysis
Statistical analysis was performed using StatView version 5.0 for Windows as needed. Data was analyzed using StatView and a statistically significant difference was considered to be p<0.05 and it was represented by * on the bars in the figures.
Results
BTG3 expression profile
In order to determine relative expression levels of BTG3 in prostate cancer (PCa) cells, we performed TaqMan quantitative real-time PCR analysis for androgen-dependent (LNCaP) and –independent (PC3) cell lines and compared them with normal prostate epithelial cells (RWPE-1). We also compared the mRNA expression levels of tumor samples and normal tissue samples (Fig. 1A, C). The results showed that relative mRNA expression was significantly lower in tumor samples and the PCa cell line when compared to normal tissue samples and RWPE-1 cells. These results show that BTG3 gene is transcriptionally down-regulated in prostate cancer.
Figure 1.
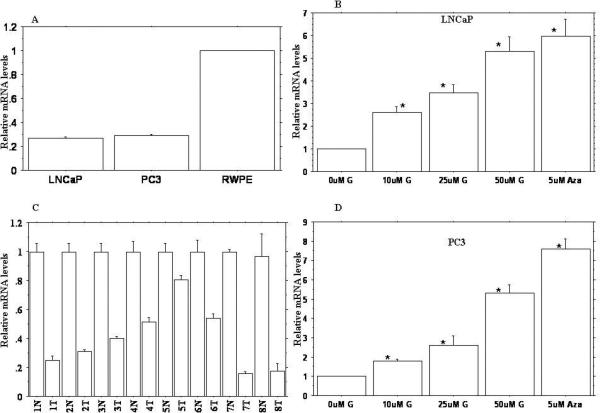
A, Expression profile of BTG3 in prostate cancer and normal prostate epithelial cells. C, Expression profile of BTG3 in prostate cancer (T) and normal prostate (N) clinical samples. B, D, Relative expression profile of BTG3 gene following treatment with 0, 10, 25 and 50uM genistein (G) and 5uM 5-Aza-2’-deoxycytidine (Aza). Relative quantification was performed by quantitative real-time PCR. Data are in triplicate from three independent experiments and were normalized to GAPDH and calibrated to levels in untreated samples. All data are expressed as mean ±SE (bars). * Statistically significant at p<0.05.
Effect of genistein and 5Aza-C treatment on the expression of BTG3
Genistein significantly up-regulated the relative expression level of BTG3 in a dose dependent manner over vehicle control (Fig., 1 B, D). Maximum increase was observed with 50uM genistein (5-6 fold) followed by 25uM genistein (3-4 fold). 5Aza-C treatment also increased the BTG3 mRNA expression level by 5-7 folds in both PCa cell lines compared to vehicle control indicating that BTG3 gene can be significantly induced by genistein and 5Aza-C treatment.
Methylation status of BTG3 promoter
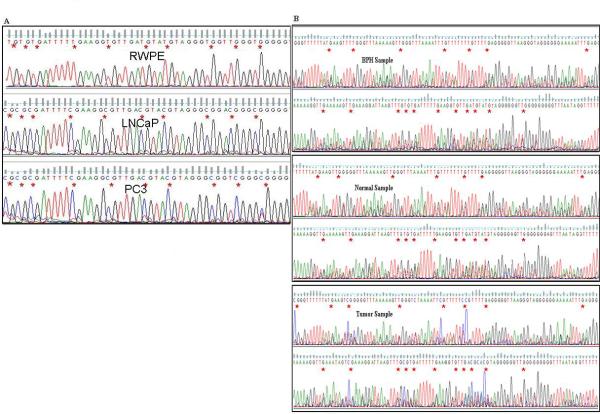
To check whether transcriptional silencing of BTG3 gene is due to promoter hypermethylation, we analyzed the status of promoter methylation for BTG3 in 10 pairs of tumor and normal tissue samples, 10 BPH samples and cell lines by bisulfite modified PCR followed by direct sequencing of the modified DNA samples. We used MethPrimer software 25 to select primers in the CpG rich region of the BTG3 promoter around the transcription start site. Primers were designed with no CpG sites in either the forward or reverse primer and thus amplification proceeds in a manner unbiased by promoter methylation status. Selected amplicons were subsequently subcloned, and the recombinants were identified and subjected to automated DNA sequencing. Resulting sequences were compared with the parent promoter sequence from which the clones were made and the methylation status of the CpG dinucleotides within this amplicon was determined by characteristic chemical changes associated with cytosines existing in either a methylated or an unmethylated state (Fig. 4 D). DNA sequencing results revealed promoter of the BTG3 gene in tumor samples was hypermethylated in comparison to normal tissue samples (Fig. 3). Similar results were observed in cell lines. The BTG3 promoter in PCa cell lines was completely methylated whereas there was an absence of CpG island methylation in normal prostate epithelial cells (RWPE-1) (Fig. 3). Genistein and 5Aza-C treatments significantly demethylated the hypermethylated BTG3 promoter (Fig., 4). These results indicate that transcriptional silencing of the BTG3 gene is due to promoter hypermethylation which can be reversed by genistein and 5Aza-C treatments.
Figure 4.
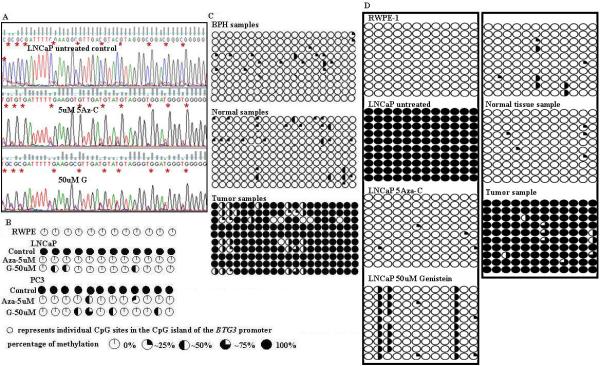
A, Representative sequencing results showing the effect of 5Aza-C and genistein on promoter methylation. B, Summarized results showing demethylation of CpG sites by 5Aza-C and genistein treatments in LNCaP and PC3 cell lines. C, Summarized results showing promoter methylation status in 10 BPH samples and in 10 pairs of normal and tumor samples. Each pair was obtained from the same patient and micro-dissected by a certified pathologist into normal and tumor. D, Summarized sequencing results from 10 clones of each selected sample. Each row represents a single clone. ○, * indicate individual CpG sites in the CpG island. For cloning samples a nested PCR was performed using two primer sets BSP_F1 – R1 and BSP_F3 – R3.
Figure 3.
A, DNA sequencing results showing promoter methylation status in untreated LNCaP, PC3 and RWPE-1 cells. B, Representative figures showing methylation status in BPH, normal and tumor prostate tissues. * indicates individual CpG sites. For cell lines, a single primer set (BSP_F3 –R3) was used for BS-PCR whereas a nested PCR was performed for tissue samples using two primer sets BSP_F1 – R1 and BSP_F2 – R2.
Enzymatic Activity Assays
We performed several enzyme activity assays related to methylation and histone modifications. DNA methyltransferase activity was down-regulated by treatment with 50uM genistein and 5Aza-C in LNCaP and PC3 cells (Fig., 5 A). There were also decreased levels of DNMT proteins in genistein and 5Aza-C treated samples compared to untreated controls. There was a significant decrease (60 to 70%) in DNMT1 levels with 5Aza-C followed by 35 to 45% decrease by genistein over untreated control. There were also decreased levels of DNMT 3a and 3b in both prostate cancer cell lines (Fig., 5 C). We also checked the MBD2 binding activity in terms of Binding percent. MBD2 activity was decreased 80% and 40-50% by 5Aza-C and genistein, respectively, compared to untreated controls (Fig., 5 B). We also checked HAT and HDAC activities. Genistein and 5Aza-C treatment increased HAT activity (Fig., 5 D), whereas there was no difference in HDAC activity with either 5Aza-C or genistein except the PC3 cells, where 5Aza-C caused a significant decrease in HDAC activity (Fig., 5 D).
Figure 5.
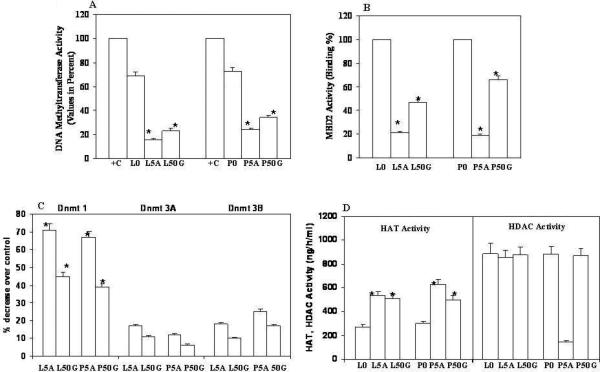
A, Percent Methyltransferase Activity. B, MBD2 binding Activity expressed as binding percent. C, DNMT proteins expressed as percent decrease over control calculated by formula [(Treated/untreated control) × 100 – 100]. D, HAT and HDAC activity (ng/h/ml). +C positive control provided with the assay kit. LNCaP (L), PC3 (P), Genistein (G), 5Aza-C (5A), untreated control (0), 50uM Genistein (50G), 5uM 5Aza-C (5A).
Changes in chromatin modifications
To determine whether there were changes in chromatin structure at the BTG3 locus after genistein and 5Aza-C treatment, we did ChIP analysis with various antibodies as described in Materials and Methods section. Genistein and 5Aza-C treatments resulted in enrichment of acetylated histones H3, H4, H3 di-methylated at lysine 4 and H3 tri-methylated at lysine 4 near the transcription start sites in both LNCaP and PC3 cell lines (Fig. 6 A, B). These changes are markers of active modifications and indicative of gene activation. Therefore, promoter demethylation by genistein and 5Aza-C also correlated with active histone modifications at the transcription start site in both cell lines.
Figure 6.
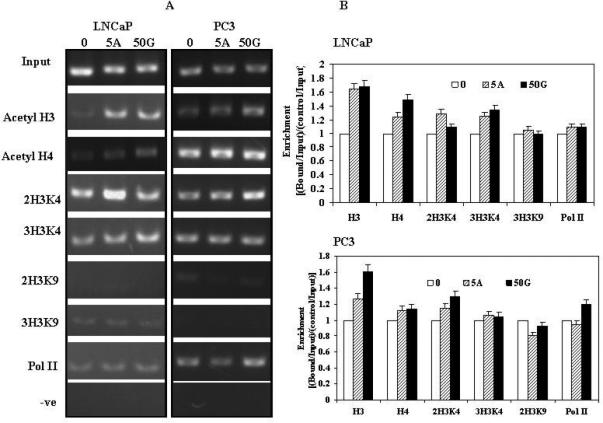
A. Histone modifications. ChIP assay was performed on cells after treatment with 50uM/L genistein and 5uM/L 5Aza-C. Untreated control (0), 5Aza-C (5A), 50uM Genistein (50G). B. Data calculated from the corresponding DNA fragments amplified by PCR at annealing temperature of 60°C for a total of 28 cycles; bars, error ±SD. Enrichment was calculated as the ratio between the net intensity of each bound sample normalized to its input sample and the vehicle control sample normalized to vehicle control input samples (Bound sample/Bound sample Input)/(Vehicle control sample/Vehicle control Input).
Discussion
The hypermethylation of DNA is a key epigenetic mechanism for the silencing of many genes including tumor suppressors, DNA repair enzymes, and receptors 8, 9. In recent years, the list of tumor suppressor genes that are inactivated by epigenetic rather than classical mutation/deletion events has been growing 26. Unlike mutational inactivation, methylation is reversible and demethylating agents and inhibitors of histone deacetylases are being used in clinical trials 26. Our study clearly demonstrates that genistein causes CpG demethylation, inhibition of DNMTase and MBD2 activity and reactivation of the methylation-silenced BTG3 gene. To our knowledge, this is the first time that such a role for genistein has been reported in prostate cancer.
Gene inactivation by DNA methylation is an important mechanism in prostate cancer, and is involved in the inactivation of a number of essential genes such as E-cadherin 27, MDR1 28 and glutathione S-transferase P1 29. Our results showed that the BTG3 gene is hypermethylated in both prostate cancer cell lines and tumor samples compared to normal cell lines and tissues. Promoter hypermethylation subsequently led to the transcriptional repression of the BTG3 gene (Fig., 1 A, C). Yamamoto et al., 30 have also reported that the BTG3 gene is silenced by hypermethylation in primary oral squamous cell carcinomas (OSCCs). In theory, this epigenetic process is reversible if newly synthesized DNA strands are not methylated. Therefore, DNMT inhibitors such as 5Aza-C and zebularine have been actively investigated as cancer therapeutic agents 21, 22. However, side effects and toxicity are serious concerns. So we used genistein, a natural, nontoxic dietary isoflavone and compared its effect with 5Aza-C. Our results revealed that genistein significantly induced BTG3mRNA levels and its effects were similar to that of 5Aza-C in both androgen dependent (LNCaP) and independent (PC3) cell lines (Fig., 1 B, C). This is consistent with other reports that have shown that genistein up-regulated mRNA expression of the BRAC1 gene, p16INK4a, RARβ, MGMT genes and p16INK4a, p21CIP1/WIF1 31.
BTG3/ANA/APRO4 is thought to be negative regulator of cell cycle which is expressed highly in late G1 phase before the entry of the cells in S phase 3. It has been found that its antiproliferative action is through inhibition of transcription factor E2F1 which in turn controls the cell cycle by activating genes important for G1/S progression: these include the genes for cyclin E, PCNA, DNA polymerase α, Cdc6 dihydrofolate reductase and others 7. More recently, BTG3 was found to associate with and inhibit Src tyrosine kinase6. Other studies have shown that BTG3 gene is a candidate tumor suppressor gene in human non-small cell lung cancer cell line and in oral squamous cell carcinomas (OSCCs) 30.
It is well known that the predominant consequence of methylation is transcriptional repression and we found that CpG island in the promoter of the BTG3 gene were hypermethylated in cancer cell lines and tumor samples (Fig. 3 A, B). Treatment with 50uM genistein caused demethylation of these sites though to a lesser extent than that of 5Aza-C (Fig., 4). Direct inhibition of transcription may be through blocking the binding of transcription factors to promoters containing methylated CpG sites 32, while indirect repression may involve proteins such as MePC2 that specifically bind to methylated DNA via a methyl-CpG-binding domain (MBD) 33. It is likely that inhibition of DNMT and enhanced histone acetylation can also prevent the hypermethylation. The prevention of intestinal tumorigenesis by Dnmt1 deficiency and 5Aza-C has been demonstrated in Min mice, which carry a mutated Apc gene 34. Our enzymatic activity assays revealed that genistein and 5Aza-C treatment inhibited DNA Methyltransferase, decreased MBD2 binding and also increased HAT activity (Fig., 6). The 5Aza-C is a potent inhibitor of DNA methyltransferase (DNMTase) activity, through irreversible binding of DNMTs to 5-aza-2’-deoxycytidine-substituted DNA 35. The methylation of genomic DNA is catalyzed by DNMTs, which include DNMT1, DNMT3A and DNMT3B. Our current results showed a significant decrease in DNMT1 protein levels by genistein and 5Aza-C treatments (Fig., 5 C). A decrease in DNMT 3A and -3B was also observed but to a lesser extent.
Another important epigenetic event is chromatin modification. There are reports which show that hyper-acetylation of histone lysine residues facilitates transcriptional activation 36 and induction of gene expression 37. Our results revealed that both genistein and 5Aza-C caused enrichment of active chromatin modifications near the transcription start site of the BTG3 gene in both LNCaP and PC3 cell lines (Fig., 6 A, B).
In conclusion, our study is the first report to show that the tumor suppressor gene BTG3 is epigenetically silenced in prostate cancer and can be reactivated by genistein induced promoter demethylation and active histone modification. Furthermore, genistein showed similar effects to that of 5Aza-C, which is currently undergoing phase II clinical trials as a treatment for prostate cancer. Since genistein is a natural, non-toxic, dietary isoflavone, these results indicate that genistein may be a novel, advantageous therapeutic agent for treating prostate cancer.
Acknowledgement
We thank Dr. Roger Erickson for his support and assistance with the preparation of the manuscript.
This study was supported by Veterans Affairs Merit Review, Veterans Affairs Research Enhancement Award Program (REAP), and NIH grants: RO1CA111470 and T32DK007790 (PI: Rajvir Dahiya).
Reference
- 1.Hartwell LH, Kastan MB. Cell cycle control and cancer. Science. 1994;266(5192):1821–8. doi: 10.1126/science.7997877. [DOI] [PubMed] [Google Scholar]
- 2.Hirama T, Koeffler HP. Role of the cyclin-dependent kinase inhibitors in the development of cancer. Blood. 1995;86(3):841–54. [PubMed] [Google Scholar]
- 3.Guehenneux F, Duret L, Callanan MB, Bouhas R, Hayette S, Berthet C, et al. Cloning of the mouse BTG3 gene and definition of a new gene family (the BTG family) involved in the negative control of the cell cycle. Leukemia. 1997;11(3):370–5. doi: 10.1038/sj.leu.2400599. [DOI] [PubMed] [Google Scholar]
- 4.Matsuda S, Rouault J, Magaud J, Berthet C. In search of a function for the TIS21/PC3/BTG1/TOB family. FEBS Lett. 2001;497(2-3):67–72. doi: 10.1016/s0014-5793(01)02436-x. [DOI] [PubMed] [Google Scholar]
- 5.Yoshida Y, Matsuda S, Ikematsu N, Kawamura-Tsuzuku J, Inazawa J, Umemori H, et al. ANA, a novel member of Tob/BTG1 family, is expressed in the ventricular zone of the developing central nervous system. Oncogene. 1998;16(20):2687–93. doi: 10.1038/sj.onc.1201805. [DOI] [PubMed] [Google Scholar]
- 6.Rahmani Z. APRO4 negatively regulates Src tyrosine kinase activity in PC12 cells. J Cell Sci. 2006;119(Pt 4):646–58. doi: 10.1242/jcs.02778. [DOI] [PubMed] [Google Scholar]
- 7.Ou YH, Chung PH, Hsu FF, Sun TP, Chang WY, Shieh SY. The candidate tumor suppressor BTG3 is a transcriptional target of p53 that inhibits E2F1. EMBO J. 2007;26(17):3968–80. doi: 10.1038/sj.emboj.7601825. [DOI] [PMC free article] [PubMed] [Google Scholar]
- 8.Jones PA, Takai D. The role of DNA methylation in mammalian epigenetics. Science. 2001;293(5532):1068–70. doi: 10.1126/science.1063852. [DOI] [PubMed] [Google Scholar]
- 9.Lichtenstein AV, Kisseljova NP. DNA methylation and carcinogenesis. Biochemistry (Mosc) 2001;66(3):235–55. doi: 10.1023/a:1010249510906. [DOI] [PubMed] [Google Scholar]
- 10.Rice JC, Massey-Brown KS, Futscher BW. Aberrant methylation of the BRCA1 CpG island promoter is associated with decreased BRCA1 mRNA in sporadic breast cancer cells. Oncogene. 1998;17(14):1807–12. doi: 10.1038/sj.onc.1202086. [DOI] [PubMed] [Google Scholar]
- 11.Nguyen CT, Gonzales FA, Jones PA. Altered chromatin structure associated with methylation-induced gene silencing in cancer cells: correlation of accessibility, methylation, MeCP2 binding and acetylation. Nucleic Acids Res. 2001;29(22):4598–606. doi: 10.1093/nar/29.22.4598. [DOI] [PMC free article] [PubMed] [Google Scholar]
- 12.Li E. Chromatin modification and epigenetic reprogramming in mammalian development. Nat Rev Genet. 2002;3(9):662–73. doi: 10.1038/nrg887. [DOI] [PubMed] [Google Scholar]
- 13.Fuks F, Burgers WA, Godin N, Kasai M, Kouzarides T. Dnmt3a binds deacetylases and is recruited by a sequence-specific repressor to silence transcription. EMBO J. 2001;20(10):2536–44. doi: 10.1093/emboj/20.10.2536. [DOI] [PMC free article] [PubMed] [Google Scholar]
- 14.Robertson KD, Ait-Si-Ali S, Yokochi T, Wade PA, Jones PL, Wolffe AP. DNMT1 forms a complex with Rb, E2F1 and HDAC1 and represses transcription from E2F-responsive promoters. Nat Genet. 2000;25(3):338–42. doi: 10.1038/77124. [DOI] [PubMed] [Google Scholar]
- 15.Jones PA, Baylin SB. The fundamental role of epigenetic events in cancer. Nat Rev Genet. 2002;3(6):415–28. doi: 10.1038/nrg816. [DOI] [PubMed] [Google Scholar]
- 16.Nan X, Ng HH, Johnson CA, Laherty CD, Turner BM, Eisenman RN, et al. Transcriptional repression by the methyl-CpG-binding protein MeCP2 involves a histone deacetylase complex. Nature. 1998;393(6683):386–9. doi: 10.1038/30764. [DOI] [PubMed] [Google Scholar]
- 17.Cameron EE, Bachman KE, Myohanen S, Herman JG, Baylin SB. Synergy of demethylation and histone deacetylase inhibition in the re-expression of genes silenced in cancer. Nat Genet. 1999;21(1):103–7. doi: 10.1038/5047. [DOI] [PubMed] [Google Scholar]
- 18.Nakayama T, Watanabe M, Suzuki H, Toyota M, Sekita N, Hirokawa Y, et al. Epigenetic regulation of androgen receptor gene expression in human prostate cancers. Lab Invest. 2000;80(12):1789–96. doi: 10.1038/labinvest.3780190. [DOI] [PubMed] [Google Scholar]
- 19.Rountree MR, Bachman KE, Baylin SB. DNMT1 binds HDAC2 and a new co repressor, DMAP1, to form a complex at replication foci. Nat Genet. 2000;25(3):269–77. doi: 10.1038/77023. [DOI] [PubMed] [Google Scholar]
- 20.Clark SJ, Melki J. DNA methylation and gene silencing in cancer: which is the guilty party? Oncogene. 2002;21(35):5380–7. doi: 10.1038/sj.onc.1205598. [DOI] [PubMed] [Google Scholar]
- 21.Christman JK. 5-Azacytidine and 5-aza-2'-deoxycytidine as inhibitors of DNA methylation: mechanistic studies and their implications for cancer therapy. Oncogene. 2002;21(35):5483–95. doi: 10.1038/sj.onc.1205699. [DOI] [PubMed] [Google Scholar]
- 22.Zhou L, Cheng X, Connolly BA, Dickman MJ, Hurd PJ, Hornby DP. Zebularine: a novel DNA methylation inhibitor that forms a covalent complex with DNA methyltransferases. J Mol Biol. 2002;321(4):591–9. doi: 10.1016/S0022-2836(02)00676-9. [DOI] [PMC free article] [PubMed] [Google Scholar]
- 23.Cheng JC, Matsen CB, Gonzales FA, Ye W, Greer S, Marquez VE, et al. Inhibition of DNA methylation and reactivation of silenced genes by zebularine. J Natl Cancer Inst. 2003;95(5):399–409. doi: 10.1093/jnci/95.5.399. [DOI] [PubMed] [Google Scholar]
- 24.Bender CM, Pao MM, Jones PA. Inhibition of DNA methylation by 5-aza-2'-deoxycytidine suppresses the growth of human tumor cell lines. Cancer Res. 1998;58(1):95–101. [PubMed] [Google Scholar]
- 25.Li LC, Dahiya R. MethPrimer: designing primers for methylation PCRs. Bioinformatics. 2002;18(11):1427–31. doi: 10.1093/bioinformatics/18.11.1427. [DOI] [PubMed] [Google Scholar]
- 26.Agathanggelou A, Cooper WN, Latif F. Role of the Ras-association domain family 1 tumor suppressor gene in human cancers. Cancer Res. 2005;65(9):3497–508. doi: 10.1158/0008-5472.CAN-04-4088. [DOI] [PubMed] [Google Scholar]
- 27.Li LC, Zhao H, Nakajima K, Oh BR, Ribeiro Filho LA, Carroll P, et al. Methylation of the E-cadherin gene promoter correlates with progression of prostate cancer. J Urol. 2001;166(2):705–9. [PubMed] [Google Scholar]
- 28.Enokida H, Shiina H, Igawa M, Ogishima T, Kawakami T, Bassett WW, et al. CpG hypermethylation of MDR1 gene contributes to the pathogenesis and progression of human prostate cancer. Cancer Res. 2004;64(17):5956–62. doi: 10.1158/0008-5472.CAN-04-0081. [DOI] [PubMed] [Google Scholar]
- 29.Enokida H, Shiina H, Urakami S, Igawa M, Ogishima T, Pookot D, et al. Ethnic group-related differences in CpG hypermethylation of the GSTP1 gene promoter among African-American, Caucasian and Asian patients with prostate cancer. Int J Cancer. 2005;116(2):174–81. doi: 10.1002/ijc.21017. [DOI] [PubMed] [Google Scholar]
- 30.Yamamoto N, Uzawa K, Yakushiji T, Shibahara T, Noma H, Tanzawa H. Analysis of the ANA gene as a candidate for the chromosome 21q oral cancer susceptibility locus. Br J Cancer. 2001;84(6):754–9. doi: 10.1054/bjoc.2000.1656. [DOI] [PMC free article] [PubMed] [Google Scholar]
- 31.Majid S, Kikuno N, Nelles J, Noonan E, Tanaka Y, Kawamoto K, et al. Genistein induces the p21WAF1/CIP1 and p16INK4a tumor suppressor genes in prostate cancer cells by epigenetic mechanisms involving active chromatin modification. Cancer Res. 2008;68(8):2736–44. doi: 10.1158/0008-5472.CAN-07-2290. [DOI] [PubMed] [Google Scholar]
- 32.Iguchi-Ariga SM, Schaffner W. CpG methylation of the cAMP-responsive enhancer/promoter sequence TGACGTCA abolishes specific factor binding as well as transcriptional activation. Genes Dev. 1989;3(5):612–9. doi: 10.1101/gad.3.5.612. [DOI] [PubMed] [Google Scholar]
- 33.Bird A. DNA methylation patterns and epigenetic memory. Genes Dev. 2002;16(1):6–21. doi: 10.1101/gad.947102. [DOI] [PubMed] [Google Scholar]
- 34.Eads CA, Nickel AE, Laird PW. Complete genetic suppression of polyp formation and reduction of CpG-island hypermethylation in Apc(Min/+) Dnmt1-hypomorphic Mice. Cancer Res. 2002;62(5):1296–9. [PubMed] [Google Scholar]
- 35.Creusot F, Acs G, Christman JK. Inhibition of DNA methyltransferase and induction of Friend erythroleukemia cell differentiation by 5-azacytidine and 5-aza-2'-deoxycytidine. J Biol Chem. 1982;257(4):2041–8. [PubMed] [Google Scholar]
- 36.Kristeleit R, Stimson L, Workman P, Aherne W. Histone modification enzymes: novel targets for cancer drugs. Expert Opin Emerg Drugs. 2004;9(1):135–54. doi: 10.1517/eoed.9.1.135.32947. [DOI] [PubMed] [Google Scholar]
- 37.Archer SY, Hodin RA. Histone acetylation and cancer. Curr Opin Genet Dev. 1999;9(2):171–4. doi: 10.1016/s0959-437x(99)80026-4. [DOI] [PubMed] [Google Scholar]


