

Abstract
Interactomes are often measured using affinity purification-mass spectrometry (AP-MS) or yeast two-hybrid approaches but these lack stoichiometric or temporal information. We combine quantitative proteomics and size exclusion chromatography to map 291 coeluting complexes. This method allows mapping of an interactome to the same depth and accuracy as AP-MS with less work and without overexpression or tagging. The use of triplex labeling enables monitoring of interactome rearrangements.
Activation of growth factor receptors initiates signaling that can lead to cell proliferation, differentiation and migration1. This process is strictly regulated via post-translational modifications, such as ubiqutination and phosphorylation, and involves the dynamic regulation of numerous protein-protein interactions. Existing methods for studying interactomes (all protein-protein interactions within a system) require tagging of all open reading frames of interest to provide a measurable readout or to enable purification and identification of the protein complex2,3. A protein-tag can be time consuming to introduce and can disrupt interactions or alter localization of the protein complex2,4. Finally, existing large-scale methods are not easily amenable to addressing how an interactome responds to stimulation.
Protein correlation profiling-stable isotope labeling by amino acids in cell culture (PCP-SILAC) was initially used to profile organelle proteins across a sucrose gradient by mass spectrometry, using the similarity of any two profiles to assign localization to specific organelles5,6. Theoretically protein complexes could be studied in the same way but they are poorly resolved on density gradients. In contrast, size exclusion chromatography (SEC) is a universally accepted method for resolving protein complexes and assigning their composition based on co-eluting enzymatic activity and/or immunoblot profiles. Traditionally, researchers have used targeted detection assays downstream of SEC but its use in global monitoring of protein complexes has been limited7.
To overcome some of the limitations of present interactome-scale techniques, we combined PCP-SILAC with high performance liquid chromatography using a SEC column (SEC-PCP-SILAC) with a theoretical plate count exceeding 100,000 plates per meter to determine the composition of the human interactome, as well as the global changes that occur in the interactome following EGF stimulation (Fig. 1a, Online Methods). In this scheme, the light-labelled proteins act as internal standards and any interactome changes following EGF stimulation are monitored with the ratio of medium/heavy labeled proteins (Fig. 1b).
Figure 1. Identification of spatiotemporal changes in the interactome following EGF stimulation.

a, Three populations of Hela cells are metabolically labeled with amino acid isotopologs, and the heavy population is stimulated with EGF. The high molecular weight fraction of the lysed cells is enriched by ultrafiltration prior to size exclusion chromatography (SEC). SEC fractions from the light cells are pooled and subsequently aliquoted into each fraction from medium/heavy fractions as an internal standard prior to LC-MS/MS.
b, Mass spectra of three peptides that display different spatiotemporal interactions changes following EGF stimulation. The medium:light ratio (M/L) is used to generate chromatograms, whereas the heavy to medium (H/M) ratio represents the impact of EGF stimulation on that protein. The monoisotopic peaks from the light, medium and heavy envelopes are marked by open, grey and black stars respectively. Protein name and sequence are indicted.
3400 proteins were identified from three independent biological replicates, with chromatograms being reconstructed for each protein based on the light/medium ratios in the individual fractions (Fig. 1c, Supplementary table 1). Many of the chromatograms had multiple peaks, indicating that proteins very frequently participate in more than one complex or in similar complexes with different stoichiometries. To assign binary interactions among the proteins represented in these chromatograms, we used two types of information: First, for every chromatogram we calculated the Euclidian distance to all other chromatograms, with the assumption that two proteins that always occur together in the same complex(es) would have similar chromatograms. Second, we deconvolved each chromatogram into component Gaussian curves, with the assumption that for large complexes, which are made of independent, stable and observable subcomplexes, the constituent proteins might only show similarities in part of the chromatogram (Supplementary Fig. 1). We then used receiver-operator characteristics (ROC) and precision-recall curves for these data (Supplementary Fig. 2) to select a combination of parameters that yielded a false positive rate of less than 0.7% and a precision of 53% (Supplementary table 2). This resulted in 7209 binary protein interactions (Supplementary table 3), which hierarchically clustered into 291 protein complexes with an average of 4.1 distinct proteins per complex (Fig. 2a–b, Supplementary table 4). These results are similar to other high throughput techniques such as AP-MS but involves two orders of magnitude fewer samples for LC-MS analysis.. The complexes varied from very stable machines to relatively transient interactions, such as the binding of UCHL5 and ADRM1 to the proteasome8.
Figure 2. Evaluation of the PCP-SILAC approach to identify protein-protein interactions.
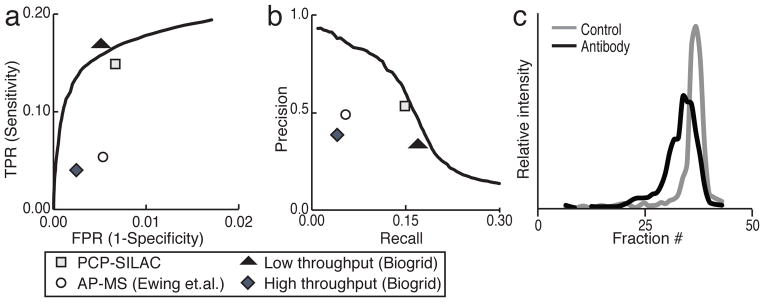
a, The receiver operator characteristic (ROC) curve for Euclidian distance describing the tradeoff in identifying interactions misclassified as positive (FPR) versus the proteins correctly classified as positive (TPR). The points represent the following datasets: PCP-SILAC is the value for all 7209 binary interactions identified in this study after applying all limits from Supplementary Table 2, AP-MS (Ewing) is from ref 16 Biogrid low and high throughput is acquired from the Biogrid database version 3.1.82.
b, Pprecision-recall curve for the Euclidian distance The points describe the same datasets as in Fig. 2a.
c, Antibodies against 14-3-3γ were added to heavy lysate prior to SEC. The chromatograms of 14-3-3γ in the absence (grey line) and presence (black line) of exogenous IgG are shown.
To validate one of the identified complexes we made further use of the high resolution of the SEC column to test the impact on retention time when adding an antibody against a specific protein found to be part of a complex. This should increase the Stokes radius of any complex containing the target of the antibody, resulting in earlier elution from the column. Indeed, an antibody against 14-3-3γ shifted its elution to at least two fractions earlier (Fig. 2c), along with its known interactors 14-3-3α/β, 14–3–3ε and BAD (Supplementary Fig. 3, Supplementary Table 5)9.
SEC-PCP-SILAC allows the determination of an interactome but it also highlights the heterogeneity of complexes within the cell. Conventional interactome approaches cannot resolve the various complexes a protein might be involved in and so the distribution of a protein among different complexes goes undetected, yet this distribution can be important for biological outcomes. Forty-three percent of the protein chromatograms measured here deconvolved into more than one Gaussian peak (Supplementary Fig. 4), suggesting that these proteins bind to multiple different proteins. Since the chromatograms are quantitative, the relative stoichiometry of a protein binding to its various partners should therefore be calculable from the areas of the individual Gaussian curves. An interesting example that arises from this analysis is the proteasome: Our data reveals that on average there are 1.7± 0.6 moles of 19S regulatory particle proteins in the doubly-capped proteasome for every mole in a singly-capped proteasome (Fig. 3a). Since each doubly-capped proteasome molecule would have twice as many regulatory proteins as a singly-capped proteasome, this means that the singly-and doubly-capped complexes are approximately equally abundant, an observation that supports an estimated stoichiometry of one between the double- and single-capped proteasome in the cytosol reported by others10. Furthermore, we can resolve substructures within one complex by examining the stoichiometric distribution of individual proteins (Fig. 3b). For example, the E3 ubiquitin-protein ligase KCMF1 distributes differently than other 19S regulatory particle proteins and a closer inspection of the chromatogram revealed that it is only bound to the 19S regulatory particle when the 19S is in turn bound to the 20S core particle (Supplementary Fig. 5).
Figure 3. Determination of stoichiometry and the interactome response to EGF stimulation.

a, The areas under the fitted curves show the relative stoichiometry of a protein in different complexes. The three curves fitted (R2 = 0.99, SSE = 0.15) to the chromatogram of PSMD8 have approximate relative areas of 2:1:3, representing the fraction of PSMD8’s participation in the full, 26S, doubly-capped proteasome (purple), in the singly-capped proteasome (yellow) and in the isolated 19S regulatory subunit (blue) respectively. b, Example of two protein complexes regulated by EGF stimulation; the color key is the average H/M ratio in the three fractions where the complexes peaked. Complexes 50: AP-3, 102: ILK (see Supplementary table 6).
Interactome rearrangement must occur in order for a cell to respond to stimuli, however most interactome data currently available are derived from studies where only a single experimental condition was measured since this is already immensely labor intensive. Incorporation of the third SILAC label into the PCP-SILAC scheme (Fig. 1b) allows the heavy/medium ratio to be used to quantify the temporal changes in the interactome following 20 minutes of EGF stimulation. This approach reveals 351 proteins whose association with a complex is increased or decreased by the EGF challenge (Supplementary methods and Supplementary table 6). Among these changes were well documented proteins known to be a part of the EGF signaling cascade: EPS15, SHIP2, STAM/STAM2 and HRS bind to the EGF receptor (EGFR) itself, STAT3, an important transcription factor downstream of EGFR, and ILK, PXN, PARVA and PINCH that are all involved in synergistic integrin-mediated signaling11 (Supplementary Fig. 6). Among the newly discovered interactions affected by EGF are all members of an AP-3 complex (Fig. 3c), suggesting that AP-3 may also have a role in moving EGFR through the endosomal system after AP-2 assists with endocytosis during receptor down-regulation.
Many of the proteins whose interactions were affected by EGF are known to be involved in EGF signaling but we validated, HRS, whose connection to EGF has not been reported. Similar to 14-3-3γ, antibodies against HRS accelerated it and its only two interactors, STAM1 and STAM2 through SEC (Supplementary tables 7). Likewise, affinity purified HRS from the fraction it co-purified with only STAM1 and STAM2 (Supplementary Fig. 7), as it is previously shown12.
Next we investigated whether proteins affected by EGF here were co-enriched in other studies that measured omic-scale responses to EGF. We saw significant (P=0.01, Fisher’s exact test) co-enrichment between the proteins detected here and the subset of proteins in the IntAct database that are recorded to bind to EGFR, as well as one study that looked at global phosphorylations changes in response to EGF, (P=0.01; Fisher’s exact test)13 and in a second study focused on phosphotyrosine signaling (P=0.03; Fisher’s exact test)14. On the other hand there was no apparent co-enrichment between our data and proteins ubiquitylated following EGF stimulation (P=0.58; Fisher’s Exact test)15, implying that phosphorylation could be a stronger regulator of interactions than is ubiquitylation.
SEC-PCP-SILAC can be used to study the interactome within a single subcellular compartment, thereby avoiding irrelevant interactions that can arise when all proteins are exposed to all other proteins. The incorporation of a third SILAC label enables the measurement of interactome dynamics. The time and resources that go into a PCP-SILAC experiment allow screening the impact of a whole range of stimuli or pharmacological agents on the interactome, something that would be completely inconceivable with conventional methods. This could be used to look for off-target effects of drugs or to finally fill in gaps in data used for systems biology modeling.
Online methods
Cell culture
Three populations of cells were SILAC labeled using Arg and Lys-free Dulbecco’s Modified Eagle’s medium (DMEM) with 1% glutamine, 1% penicillin/streptomycin and 10% dialyzed fetal bovine serum and either (L-[U-13C6,14N4]arginine and L-[2H4]lysine or L-[U-12C6,14N4]arginine [1H4]lysine or L-[U-13C6,15N4]arginine and L-[U-13C6,15N2]lysine (Cambridge Isotope Labs, Cambridge, MA). The cells were grown for at least five doublings to ensure 100% incorporation of labeled amino acids and subsequently washed three times with phosphate-buffered saline (PBS) before being scraped into PBS.
SEC-PCP-SILAC
The cells were lysed in a Dounce homogenizer in size exclusion chromatography (SEC) mobile phase (50 mM KCl, 50 mM NaCH3COO, pH 7.2) including protease inhibitors without EDTA (Roche) and phosphatase inhibitors (1 mM Na orthovanadate; 5mM sodium pyrovanadate; 0.5 mM pervanadate). Two millilitres of each lysate were clarified of very large material by a 15 min ultracentrifugation (100,000 rcf) to enrich soluble, cytosolic complexes, before being concentrated to 50 μL using ultrafiltration (100000 MWCO, Sartorius Stedim). The ultrafiltration served three purposes: 1) to reduce the volume, 2) to enrich for high molecular weight complexes and 3) to generate sharper peaks during SEC by minimizing the band loaded on-column. The medium/heavy fractions were recombined just prior to loading (100 μL) onto a 1200 Series semi-preparative HPLC (Agilent Technologies, Santa Clara, CA) equipped with a 600 × 7.8 mm BioSep4000 Column (Phenomenex) (resolving power 62257, 79522 and 109287 plates/meter, for the three iterations of the columns used in experiments 1, 2 and 3, respectively) controlled at 12°C and a flow rate of 0.5 mL/min. Fractions were collected at a rate of 2/min from 20 to 30 min and at 3/min from 30 to 40 min. The relatively low salt concentration was used since it has been reported that some protein complexes will dissociate even in physiological salt buffers17. The light SILAC population was similarly separated by SEC, after which all fractions were recombined and mixed thoroughly before being aliquoted equally into each of the medium/heavy fractions.
Protein digestion and mass spectrometry
To each of the combined fractions, sodium deoxycholate was added to a final concentration of 1% and then each sample was boiled for 5 min. Subsequently, the fractions were in-solution digested as described18 and afterwards acidified by 1% TFA in 1% acetonitrile and the precipitated cholic acid was pelleted at 16,000 relative centrifugal force (r.c.f.) for 10 min. The individual fractions were cleaned up as described previously19 and analyzed by LC-MS/MS. Peptides were separated by a 180 min gradient (5–35% acetonitrile in 0.5 % acetic acid) on an 1100 Series HPLC system (Agilent), using in-house packed C18 capillary column (75 μm ID, packed with 3 μm Reprosil-Pur (Dr Maisch)). Eluate was electrosprayed into an LTQ-Orbitrap XL that was operated with the following settings: One full scan (Resolution 60,000; m/z 300-1600) followed by five MS/MS scans using CID in the linear ion trap (Min. Signal Required 500; Isolation width 3, Normalized collision energy 35; Activation Q 0.25; Activation time 30 ms) using dynamic exclusion (Repeat count 1, Repeat duration 30 sec, Exclusion list size 200, Exclusion duration 80 sec).
Mass spectrometry data processing
Tandem mass spectra were extracted from the data files using the most recently available version of MaxQuant (v1.0.13.13- v2.2.2.5)20 and searched against the human IPI database (v3.69, 74,854 sequences for experiment 1 and 2 or Uniprot 21/6/2011 69924 sequences for experiment 3) with common serum contaminants and enzyme sequences added. The results were then quantified and identified using MaxQuant with the following settings: 1% FPR on protein and peptide levels, trypsin/P cleavage rules with a maximum of 2 missed cleavages, 0.5 Da tolerance for MS/MS.
Data analysis
The three biological replicates were processed independently using the Curve Fitting Toolbox in Matlab (www.mathworks.com) to deconvolve chromatograms into component Gaussian curves. Prior to curve fitting though, chromatograms were filtered using two rules: 1) only datapoints in a group of at least five consecutive datapoints were retained, and 2) the remaining datapoints needed at least three consecutive points with a medium/light (M/L) ratio greater than 0.5 (signal:noise filter). Briefly, an interative .m script was written that fits from one to five Gaussian curves to each chromatogram, depending on the number of fractions with a M/L ratio above 0.5 (<6 fractions 1 gaussian; <9 fractions 2 gaussians; <12 fractions 3 gaussians; <15 fractions 4 gaussians; 15< fractions 5 gaussian) using the non-linear least squares method with the following lower and upper bounds for height, center and width: [1, 0.1, 0.3] and [(max ratio medium/light) 50, 8]. Then, for each successful fit a leave-one-out cross-validation was performed where one point from the chromatogram was dropped prior to re-fitting the data. The squares of the error (SSE) between the dropped datapoint and the re-fit curve was then summed across 500 such iterations and the number of Gaussians with the smallest SSE for a given chromatogram was considered the best fit. All the scripts, together with step-by-step instructions and test data, are also available from our website (http://www.chibi.ubc.ca/faculty/foster/software/) or as supplementary information.
Receiver-operator characteristics and recall-precision curves
We next calculated receiver-operator characteristics and recall-precision curves for the three biological replicates independently, since they were analyzed on three different SEC columns, using an in-house Matlab script for distances between center, height and width of the Gaussian curves and in addition for the Euclidian distances between chromatograms for two proteins. We used the Corum database21 as a validated set of true interactions, generating all possible binary interactions within each contained complex to make it compatible with our data; this list contained 5571 interactions and represents all possible true positive (TP) interactions we could potentially find in our data. For true negative interactions, we first took all the proteins we identified here and that were also contained in Corum and generated all possible interactions among them. From this we then subtracted all the true interactions contained in Corum, leaving 139,689 interactions in the true negative (TN) set. False positives (FP) were defined as all interactions minus TP, false negatives (FN) were defined as the interactions in Corum database not being found and finally the recall, precision, true positive rate (TPR) and false positive rate (FPR) was calculated exactly as described22.
Assigning binary interactions and protein complexes
To assign binary protein-protein interactions we used two types of information: 1) First, we calculated the pairwise Euclidian distance (which is defined by the sum of ΔM/L-ratio at each fraction) to all other chromatograms, with the assumption that two proteins which always are together in the same complex would have similar chromatograms and thus would have small distances. Second, we used the Gaussian curves deriving from the deconvolved chromatograms, with the assumption that interactions among proteins that are not always in a complex together and proteins with incomplete chromatograms, should have similar Gaussian curves in part of the chromatogram. If two chromatograms were very similar (Euclidian distance resulting in a precision>0.8), the two proteins were assigned as having a binary interaction. However, if the distances between the curves were large (0.2<precision<0.8), additional criteria were used: very strict limits (see Supplementary table 2) for center and width were applied since they are not affected by differences in stoichiometry and wider limits for height in order to catch stoichiometry differences. Afterwards the binary interactions from the three independent biological replicates were combined and TPR, FPR, recall and precision were calculated, being 0.15, 0.0067, 0.15 and 0.53, respectively, for the combined dataset.
These interactions were subsequently converted to base-2 numbers where 1 indicates an interaction and 0 indicates no interaction; these data were then clustered using the dist package and hclust package in R, with a distance of 0.825 generating 291 complexes containing between 2 and 43 proteins.
All the scripts used for this analysis are available from our FTP site (ftp://foster.chibi.ubc.ca/Download/PCP-SILAC/) and lab website (http://www.chibi.ubc.ca/faculty/foster/software), together with some sample data and instructions on their use.
Validation of complex components by antibody-based SEC elution shift
Three SILAC populations of cells were grown as described above for dynamic PCP-SILAC. The cells were lysed and concentrated by ultrafiltration (100000 MWCO) before 10 μg of 14-3-3γ polyclonal antibody (C-16) (Santa Cruz Biotechnology) or HRS polyclonal antibody (C2C3) (GeneTex Inc.) was added to the heavy population and incubated for 30 min on ice. The medium and heavy SILAC populations lysates were fractionated independently by SEC prior to the fractions being combined and having the aliquots of the pooled light fractions spiked in. Since the medium and heavy populations are combined after SEC, the antibody has no opportunity to alter the elution times in the medium population. The fractions were analyzed as described above and proteins having medium/light (M/L) ratios smaller than 2 and heavy/medium (H/M) ratios larger than 1.5 in fraction 34 and M/L ratios larger than 2 and H/M smaller than 1 in fraction 36 was assigned as interacting with 14-3-3γ.
Validating interactions using AP-MS of SEC fractions
Two SILAC populations of cells were grown, before the cells were lysed and concentrated by ultrafiltration (100000 MWCO) before being separated individually by SEC as described above. Fractions 19 through 24 from each population were combined and subjected to AP using 100 μl anti-rabbit Dynabeads and 20 μg of HRS polyclonal antibody (C2C3) (GeneTex Inc.) or 20 μg rabbit IgG individually. The pull down was washed three times in PBS, before being combined, eluted by LDL sample buffer (Invitrogen) and separated by SDS-PAGE. Finally the sample was “in-gel digested” as described23 prior to the peptides being analyzed by MS and quantified and identified as described above by MaxQuant.
Determination of protein stoichiometries
The areas of the individual Gaussians derived from a protein’s chromatogram are a direct representation of how much a protein participated in each of the individual subcomplexes. To calculate if any protein with a complex had significantly different stoichiometries, we first assigned the individual peaks to subcomplexes and calculated the relative stoichiometry of each protein, which is done by calculating the areas of the individual peaks. Next we performed principle component analysis of the different stoichiometries for the proteins and calculated the T2 value, from which using the F cumulative distribution (n <50) the P-values could be identified. All calculations were performed in Matlab using the statistical toolbox.
Analysis of spatiotemporal changes following EGF stimulation
Proteins were assigned as changing their protein-protein interactions if the medium/heavy ratio changed 1.5 fold in three consecutive fractions and in addition had a medium/light ratio larger than 0.75. Two biological replicates were generated for the EGF stimulated cells and one for unstimulated cells as a control.
The dataset of proteins changing interaction after EGF treatment was compared to the following high throughput datasets:
Olsen et. al. global phosphorylation dataset13, where we assigned proteins as differentially regulated if a single phosphopeptide changed kinetics twofold at any of the timepoints.
Blagoev et al. phosphotyrosine proteome, where all proteins from supplementary table 1 were used as differentially regulated following EGF stimulation14.
Argenzio et. al. EGF ubiproteome, where proteins from the ‘endogenous approach’ were used since this experiment was carried out in Hela cells. We used the proteins assigned as differentially regulated and the steady state from the endogenous approach as not changing following EGF stimulation15.
To investigate possible positive correlations with proteins known to bind to the EGFR we extracted the interactions from the IntAct database24 with the following query: EGFR AND species:human, which resulted in 238 unique proteins from 46 publications.
Statistical tests
For comparison with the other large-scale experiments (IntAct, global phosphorylation, P-tyrosine phosphorylation and ubiquitination), the two-tailed Fisher’s exact test was used. For investigating significantly different protein stoicheometries in a complex, we performed principal components analysis, calculated the Hotelling’s T2-value, from which using the F cumulative distribution (n <50) the P-values could be identified, which were all done in Matlab.
Supplementary Material
Acknowledgments
The authors would like to thank members of the Foster group for discussions and advice. This work was supported by a grant from the Canadian Institutes for Health Research to LJF (MOP-77688). LJF is the Canada Research Chair in Quantitative Proteomics and ARK is supported by the Danish Agency for Science Technology and Innovation. Mass spectrometry infrastructure used in this work was supported by the Canada Foundation for Innovation, the British Columbia Knowledge Development Fund and the BC Proteomics Network.
Footnotes
Author contributions
ARK conceived and performed the experiments; ARK, JG and LF analyzed the data and wrote the manuscript.
References
- 1.Blume-Jensen P, Hunter T. Nature. 2001;411:355–365. doi: 10.1038/35077225. [DOI] [PubMed] [Google Scholar]
- 2.Gavin AC, et al. Nature. 2006;440:631–636. doi: 10.1038/nature04532. [DOI] [PubMed] [Google Scholar]
- 3.Uetz P, et al. Nature. 2000;403:623–627. doi: 10.1038/35001009. [DOI] [PubMed] [Google Scholar]
- 4.Werner JN, et al. Proc Natl Acad Sci USA. 2009;106:7858–7863. doi: 10.1073/pnas.0901781106. [DOI] [PMC free article] [PubMed] [Google Scholar]
- 5.Andersen JS, et al. Nature. 2003;426:570–574. doi: 10.1038/nature02166. [DOI] [PubMed] [Google Scholar]
- 6.Foster LJ, et al. Cell. 2006;125:187–199. doi: 10.1016/j.cell.2006.03.022. [DOI] [PubMed] [Google Scholar]
- 7.Olinares PD, Ponnala L, van Wijk KJ. Mol Cell Proteomics. 2010;9:1594–1615. doi: 10.1074/mcp.M000038-MCP201. [DOI] [PMC free article] [PubMed] [Google Scholar]
- 8.Wang X, Huang L. Mol Cell Proteomics. 2008;7:46–57. doi: 10.1074/mcp.M700261-MCP200. [DOI] [PubMed] [Google Scholar]
- 9.Jin J, et al. Current Biology. 2004;14:1436–1450. doi: 10.1016/j.cub.2004.07.051. [DOI] [PubMed] [Google Scholar]
- 10.Tai H-C. Front Mol Neurosci. 2010 doi: 10.3389/fnmol.2010.00012. [DOI] [PMC free article] [PubMed] [Google Scholar]
- 11.Vuori K, Ruoslahti E. Science. 1994;266:1576–1578. doi: 10.1126/science.7527156. [DOI] [PubMed] [Google Scholar]
- 12.Bache KG, Raiborg C, Mehlum A, Stenmark H. J Biol Chem. 2003;278:12513–12521. doi: 10.1074/jbc.M210843200. [DOI] [PubMed] [Google Scholar]
- 13.Olsen JV, et al. Cell. 2006;127:635–648. doi: 10.1016/j.cell.2006.09.026. [DOI] [PubMed] [Google Scholar]
- 14.Blagoev B, Ong SE, Kratchmarova I, Mann M. Nat Biotechnol. 2004;22:1139–1145. doi: 10.1038/nbt1005. [DOI] [PubMed] [Google Scholar]
- 15.Argenzio E, et al. Molecular Systems Biology. 2011;7:462. doi: 10.1038/msb.2010.118. [DOI] [PMC free article] [PubMed] [Google Scholar]
- 16.Ewing RM, et al. Molecular Systems Biology. 2007;3 doi: 10.1038/msb4100134. [DOI] [PMC free article] [PubMed] [Google Scholar]
- 17.Sancak Y, et al. Mol Cell. 2007;25:903–915. doi: 10.1016/j.molcel.2007.03.003. [DOI] [PubMed] [Google Scholar]
- 18.Rogers LD, Foster LJ. Proc Natl Acad Sci USA. 2007;104:18520–18525. doi: 10.1073/pnas.0705801104. [DOI] [PMC free article] [PubMed] [Google Scholar]
- 19.Rappsilber J, Ishihama Y, Mann M. Anal Chem. 2003;75:663–670. doi: 10.1021/ac026117i. [DOI] [PubMed] [Google Scholar]
- 20.Cox J, Mann M. Nat Biotechnol. 2008;26:1367–1372. doi: 10.1038/nbt.1511. [DOI] [PubMed] [Google Scholar]
- 21.Ruepp A, et al. Nucleic Acids Research. 2010;38:D497–501. doi: 10.1093/nar/gkp914. [DOI] [PMC free article] [PubMed] [Google Scholar]
- 22.Davis J. 2006 [Google Scholar]
- 23.Shevchenko A, Tomas H, Havlis J, Olsen JV, Mann M. Nature Protocols. 2006;1:2856–2860. doi: 10.1038/nprot.2006.468. [DOI] [PubMed] [Google Scholar]
- 24.Aranda B, et al. Nucleic Acids Research. 2010;38:D525–31. doi: 10.1093/nar/gkp878. [DOI] [PMC free article] [PubMed] [Google Scholar]
Associated Data
This section collects any data citations, data availability statements, or supplementary materials included in this article.