

Abstract
Few longitudinal studies have examined how visual impairment affects mobility as people age. Data from the Salisbury Eye Evaluation Study, a population-based sample of 2,520 adults aged 65 years and older, were used to investigate the longitudinal association between visual impairment and mobility. Baseline, 2-year, 6-year, and 8-year visits occurred between 1993 and 2001. Mobility was assessed by measuring speeds on the following 3 tasks: walking up 7 steps, walking down 7 steps, and walking 4 m. Random-effects linear regression was used to model factors affecting speed. For each year of observation, speeds declined, and the visually impaired had significantly slower speeds than the non–visually impaired on all 3 tests after accounting for other covariates (βwalking up steps = −0.08 steps/second, 95% confidence interval (CI): −0.10, −0.06; βwalking down steps = −0.11 steps/second, 95% CI: −0.14, −0.08; and βwalking 4 m = −0.08 m/second, 95% CI: −0.10, −0.06). However, the interaction between years since baseline and visual impairment status was not significant, indicating that mobility speeds declined at a similar rate in the visually impaired and the non–visually impaired. These results suggest that the impact of visual impairment on speed is significant but does not change as people age.
Keywords: aging, disability, mobility, visual impairment
Walking speed is a strong predictor of disability and death in older adults (1–3). As a result, walking speeds have been used as an indicator of health and functioning in elderly populations (4). Previous research has shown that mobility declines with age, including declines in walking speeds on flat surfaces, as well as stair ascent and descent speeds (1, 5, 6). Examining factors that affect mobility at older ages is an important step toward preventing or postponing mobility disability.
Declines in the mobility performance of older adults are thought to be primarily a result of the accumulation of health conditions at older ages (7, 8). Visual impairment is 1 condition that has been shown in cross-sectional studies to negatively affect walking speeds among older adults (9–11). However, we do not know how vision loss affects walking speeds over time. Increasing our understanding of how mobility changes in visually impaired (VI) older adults compared with non–visually impaired (NVI) older adults may guide prevention and intervention strategies aimed at minimizing the impact of visual impairment.
Therefore, the primary goal of this study was to determine how visual impairment status affects changes in walking speed over an 8-year period. We hypothesized that the VI will have a more rapid decline in walking speeds on stairs and a flat surface than the NVI over the study period, and we aimed to determine whether visual impairment exacerbates the decline in walking speeds as people age. The secondary aims of this study were to determine whether the VI are more likely than the NVI to be classified as having mobility disability and whether changes in the odds of mobility disability will be greater over time in the VI.
MATERIALS AND METHODS
Study population
The institutional review board of the Johns Hopkins School of Medicine (Baltimore, Maryland) approved this research, and informed consent was obtained for all participants according to the Declaration of Helsinki. The Salisbury Eye Evaluation (SEE) Study is a population-based longitudinal study that began in 1993 and included 2,520 residents of Salisbury, Maryland, aged 65 years and older at baseline. The recruitment and eligibility criteria of the SEE Study have been previously described (12). Clinic visits occurred at baseline and at 2, 6, and 8 years after baseline. Figure 1 shows the number of participants who completed each study visit and the numbers lost to follow-up and death.
Figure 1.
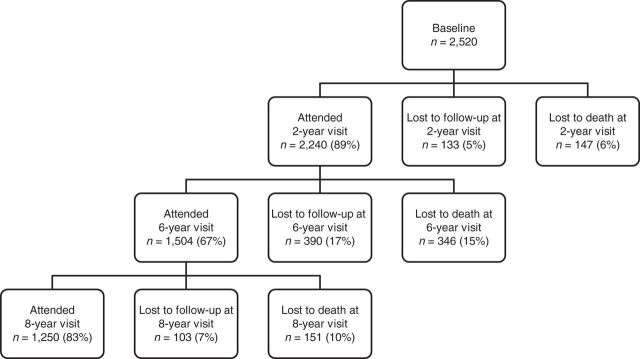
Flow of Salisbury Eye Evaluation Study participants from baseline to the 8-year study visit, Salisbury, Maryland, 1993–2001.
Visual impairment
Distance visual acuity was measured for each eye by using a standard, forced-choice procedure and an Early Treatment for Diabetic Retinopathy Study chart (13). For these analyses, best-corrected visual acuity in the better-seeing eye was used.
Visual fields were measured by using a Humphrey single-intensity (24 dB) full-field (60°) screen (Carl Zeiss Meditec, Inc., Dublin, California). This test is scored as the number of points missed (out of 96 possible points). The visual fields were separated into the central field (56 points), the upper peripheral field (18 points), and the lower peripheral field (22 points). Monocular visual fields were measured, and from these data, binocular visual fields were estimated from the composite of the more sensitive of the visual field locations from each eye (14). The composite binocular visual field was scored as the number of points missed on the visual field examination in each of the 3 areas. The central field measured in the SEE Study corresponds to approximately 20° of visual field.
Visual impairment was defined as best-corrected distance visual acuity worse than 20/40 in the better-seeing eye or as missing all of the points in the upper and lower peripheral fields of the visual field test. This visual acuity cutpoint corresponds to the American Association of Ophthalmology categorization of visual impairment, which defines impairment as best-corrected distance visual acuity worse than 20/40 (15), and the World Health Organization categorization, which defines impairment as having less than 20° of visual field (16). Visual impairment was analyzed as a time-varying covariate, allowing visual impairment status to change at each study visit.
Performance speeds
The primary outcome was speed on the following 3 mobility tests: walking up stairs, walking down stairs, and walking 4 m. These tests have been used in previous studies of physical functioning in older adults (3) and have been previously described in detail (17). Stairs were standardized at a 32° incline. Lighting was standardized, and the test courses were free of obstacles. The times (in seconds) to climb up a set of 7 stairs, to descend the same set of stairs, and to walk 4 m on a flat surface were recorded. These values were then used to calculate speeds in steps/second or m/second. Participants who felt unsafe were allowed to refuse any of the tasks.
Other covariates
Data on age, sex, and self-designated race (white or black) were recorded at baseline. Age was categorized as 65–69, 70–74, 75–79, or ≥80 years. We also examined the following covariates: body mass index (weight (kg)/height (m)2), smoking status, number of comorbid conditions, presence of diabetes, presence of depressive symptoms, and Mini–Mental State Examination score (18). The values of these covariates for an individual were allowed to change at each study visit. Body mass index was categorized into the following 3 groups: underweight (<18.5), normal weight (18.5–<25), and overweight/obese (≥25). Smoking status was assessed via self-report and categorized as never smoker or current/former smoker.
Certain comorbid conditions have been shown to negatively affect mobility (18, 20). Participants were asked questions about comorbidities by using the lead-in, “Has a doctor ever told you that you have …” These conditions included arthritis, hip fracture, back problem, heart attack or myocardial infarction, angina or chest pain, congestive heart failure, intermittent claudication pain in the legs, high blood pressure, emphysema, asthma after age 50 years, stroke, Parkinson's disease, cancer or malignancy, and vertigo or Meniere's disease. The number of conditions was categorized as 0, 1, 2, or 3 or more.
The presence of diabetes was recorded if hemoglobin A1c values were above 7% or if a doctor had ever told the participant that he or she had diabetes. The presence of depressive symptoms was assessed by using the 7-item depressive symptom subscale of the General Health Questionnaire (21, 22). Individuals are categorized as having depressive symptoms if they respond “yes” to 1 or more of the questions about worthlessness, suicidal thoughts, or hopelessness. Cognitive status was determined by using the Mini–Mental State Examination scores, which range from 0 to 30; cognitive impairment is suggested by scores of 23 or less (18).
Statistical analysis
The distribution of potential confounders was compared by visual impairment status at baseline, and 2-sided P values were determined from χ2 tests for categorical covariates or Student's t tests for continuous covariates. The distribution and mean speeds were examined by study visit and were approximately normally distributed.
Linear random-effects models were used to account for the correlation between the repeated measures by using an exchangeable correlation matrix. A separate model was run for each of the following outcomes of interest: speed walking up 7 steps (steps/second), speed walking down 7 steps (steps/second), and speed walking 4 m (m/second). These models included time since baseline, determined the subject-specific mean speed and 95% confidence intervals by using robust variance estimators, and included random-intercept and random-slope terms. We added covariates that were significantly associated with visual impairment status from the contingency table analyses, as well as covariates that have been shown to be associated with both visual impairment and mobility. Akaike information criteria (23) and Bayesian information criteria (24) were used to assess model fit and determine the most parsimonious model. The only covariate removed from our final model was Mini–Mental State Examination score, because it did not improve the fit of our model. An interaction term between visual impairment status and time for each of our 3 models was added to test the hypothesis that the VI had a steeper decline in speeds than the NVI over the study period.
The longitudinal association between visual impairment status and the odds of being classified as having mobility disability based on speeds was also examined. We defined disability as 1 standard deviation below the population mean at baseline for each mobility measurement, which was a criterion used to define disability in previous research (25). This cutpoint corresponded to speeds slower than 0.7 steps/second for walking up stairs, 0.6 steps/second for walking down stairs, and 0.6 m/second for walking 4 m. We used generalized estimating equation models with an exchangeable correlation structure to determine odds ratios comparing the odds of being classified as disabled among the VI compared with the NVI over the SEE Study follow-up period (26). Robust variance estimators were used to determine 95% confidence intervals around these estimates. Similar to the models described above, an interaction term between visual impairment status and time since baseline was added to each of the models to test the hypothesis that the VI had a steeper trajectory of mobility disability than the NVI over the study period.
Cross-sectional logistic regression models were used to check for emmigrative selection bias. These models determined the odds of being lost to follow-up compared with the odds of remaining in the study at each visit and included covariates for visual impairment status, mobility disability based on speeds (1 model for each outcome), and the other covariates in our primary analyses. We included an interaction term between mobility disability and visual impairment status to determine whether there was differential loss to follow-up of VI participants who were classified as having mobility disability.
We conducted 2 sensitivity analyses to determine if our results were robust to the cutpoint used to define mobility disability and our definition of visual impairment. Data were analyzed by using Stata, version 12.1, software (StataCorp LP, College Station, Texas) and SAS software (SAS Institute, Inc., Cary, North Carolina).
RESULTS
Participant characteristics
At baseline, 169 (7%) of SEE Study participants were categorized as VI, and 2,351 (93%) were categorized as NVI. The VI participants were significantly older and, after adjustment for age, were more likely to be black, to have a lower Mini–Mental State Examination score, to have diabetes, and to report depressive symptoms compared with NVI participants (Table 1).
Table 1.
Baseline Characteristics by Visual Impairment Status in the Salisbury Eye Evaluation Study, Salisbury, Maryland, 1993–2001
| Characteristic | Visually Impaired at Baseline (n = 169; 7%) |
Not Visually Impaired at Baseline (n = 2,351; 93%) |
P Valuea | ||
|---|---|---|---|---|---|
| No. | % | No. | % | ||
| Age, years | |||||
| 65–69 | 28 | 16.6 | 752 | 32.0 | |
| 70–74 | 42 | 24.9 | 793 | 33.7 | |
| 75–79 | 38 | 22.5 | 516 | 22.0 | |
| ≥80 | 61 | 36.1 | 290 | 12.3 | <0.001 |
| Women | 103 | 61.0 | 1,355 | 57.6 | 0.40 |
| White | 96 | 56.8 | 1,758 | 74.8 | <0.001 |
| Smoking status | |||||
| Never | 70 | 41.4 | 927 | 39.4 | |
| Current/former | 98 | 58.6 | 1,416 | 60.6 | 0.77 |
| Body mass indexb | |||||
| <18.5 (Underweight) | 7 | 4.1 | 45 | 1.9 | |
| 18.5–24.9 (Normal weight) | 52 | 30.8 | 655 | 27.9 | |
| ≥25 (Overweight/obese) | 110 | 65.1 | 1,651 | 70.2 | 0.16 |
| Mini–Mental State Examination scorec | 25.2 (3.3)d | 27.3 (2.5)d | <0.001 | ||
| Comorbid conditions | |||||
| Depressive symptoms | 30 | 17.8 | 206 | 8.9 | <0.001 |
| Diabetes | 74 | 43.8 | 702 | 29.9 | <0.001 |
| No. of other comorbid conditions | |||||
| 0 | 21 | 12.4 | 246 | 10.5 | |
| 1 | 37 | 21.9 | 565 | 24.0 | |
| 2 | 41 | 24.3 | 679 | 28.9 | |
| ≥3 | 70 | 41.4 | 861 | 36.6 | 0.39 |
a Age-adjusted, 2-sided P values determined by using univariate regression analyses, with the exception of age categories for which the P value was determined by using a χ2 test.
b Weight (kg)/height (m)2.
c Scores range from 0 to 30; cognitive impairment is suggested by scores of 23 or less (18).
d Values are mean (standard deviation).
Visual impairment status and performance speeds
For all outcomes, performance speeds declined at each study visit, and the VI had slower speeds at each time point than did the NVI (Table 2, models 1a, 2a, and 3a). We extended our models to include an interaction between years since baseline and visual impairment status to assess whether speeds declined at different rates in the VI and the NVI (Table 2, models 1b, 2b, and 3b). However, the interaction terms were not significant for any of the 3 speed outcomes, indicating that the change in speed over time was similar for the VI and the NVI over the 8-year period. For example, the interaction term between visual impairment status and speed walking up steps was 0.00 steps/second (95% confidence interval (CI): −0.01, 0.01) (Table 2, model 1b), indicating that the change in speed over time for this task was the same for the VI and the NVI. However, after including this interaction term in the model, the VI still had slower speeds at each time point. For walking down stairs, the VI remained 0.08 steps/second slower than the NVI (95% CI: −0.10, −0.05) (Table 2, model 1b).
Table 2.
Longitudinal Association Between Walking Speeds and Visual Impairment Status in the Salisbury Eye Evaluation Study, Salisbury, Maryland, 1993–2001
| Variable | Stair Climbing Speed (steps/second) |
Stair Descent Speed (steps/second) |
4-m Walking Speed (m/second) |
|||||||||
|---|---|---|---|---|---|---|---|---|---|---|---|---|
| Model 1aa |
Model 1ba |
Model 2aa |
Model 2ba |
Model 3aa |
Model 3ba |
|||||||
| β | 95% CI | β | 95% CI | β | 95% CI | β | 95% CI | β | 95% CI | β | 95% CI | |
| Intercept | 1.18 | 1.16, 1.20 | 1.18 | 1.16, 1.20 | 1.19 | 1.16, 1.22 | 1.20 | 1.17, 1.23 | 1.10 | 1.08, 1.12 | 1.10 | 1.07, 1.11 |
| Change per year since baseline | −0.02 | −0.03, −0.02 | −0.02 | −0.03, −0.02 | −0.03 | −0.03, −0.02 | −0.02 | −0.03, −0.02 | −0.02 | −0.02, −0.01 | −0.02 | −0.02, −0.01 |
| Visual impairment status | ||||||||||||
| Not visually impaired | 0.00 | Referent | 0.00 | Referent | 0.00 | Referent | 0.00 | Referent | 0.00 | Referent | 0.00 | Referent |
| Visually impaired | −0.08 | −0.10, −0.06 | −0.08 | −0.10, −0.05 | −0.11 | −0.14, −0.08 | −0.11 | −0.15, −0.08 | −0.08 | −0.10, −0.06 | −0.08 | −0.10, −0.06 |
| Visual impairment status × years since baseline | ||||||||||||
| Not visually impaired | 0.00 | Referent | 0.00 | Referent | 0.00 | Referent | ||||||
| Visually impaired | 0.00 | −0.01, 0.01 | 0.00 | −0.01, 0.01 | 0.00 | −0.01, 0.01 | ||||||
| Baseline age categories, years | ||||||||||||
| 65–69 | 0.00 | Referent | 0.00 | Referent | 0.00 | Referent | 0.00 | Referent | 0.00 | Referent | 0.00 | Referent |
| 70–74 | −0.06 | −0.07, −0.04 | −0.06 | −0.07, −0.04 | −0.07 | −0.09, −0.06 | −0.07 | −0.09, −0.05 | −0.04 | −0.06, −0.03 | −0.04 | −0.06, −0.03 |
| 75–79 | −0.15 | −0.16, −0.13 | −0.15 | −0.16, −0.13 | −0.18 | −0.20, −0.16 | −0.18 | −0.20, −0.16 | −0.13 | −0.14, −0.11 | −0.13 | −0.14, −0.11 |
| ≥80 | −0.22 | −0.24, −0.20 | −0.22 | −0.24, −0.20 | −0.25 | −0.28, −0.23 | −0.25 | −0.28, −0.23 | −0.19 | −0.20, −0.17 | −0.18 | −0.20, −0.17 |
| Sex | ||||||||||||
| Men | 0.00 | Referent | 0.00 | Referent | 0.00 | Referent | 0.00 | Referent | 0.00 | Referent | 0.00 | Referent |
| Women | −0.09 | −0.10, −0.08 | −0.09 | −0.10, −0.08 | −0.12 | −0.13, −0.10 | −0.12 | −0.13, −0.10 | −0.08 | −0.09, −0.07 | −0.08 | −0.09, −0.07 |
| Race | ||||||||||||
| White | 0.00 | Referent | 0.00 | Referent | 0.00 | Referent | 0.00 | Referent | 0.00 | Referent | 0.00 | Referent |
| Black | −0.13 | −0.14, −0.11 | −0.13 | −0.14, −0.11 | −0.16 | −0.17, −0.14 | −0.15 | −0.17, −0.14 | −0.13 | −0.15, −0.12 | −0.13 | −0.14, −0.12 |
| Smoking status | ||||||||||||
| Never | 0.00 | Referent | 0.00 | Referent | 0.00 | Referent | 0.00 | Referent | 0.00 | Referent | 0.00 | Referent |
| Current/former | −0.01 | −0.02, 0.01 | −0.01 | −0.02, 0.01 | −0.01 | −0.03, 0.002 | −0.01 | −0.03, 0.00 | −0.02 | −0.03, −0.01 | −0.02 | −0.03, −0.01 |
| Body mass indexb | ||||||||||||
| <18.5 (Underweight) | −0.01 | −0.05, 0.03 | −0.01 | −0.05, 0.03 | −0.05 | −0.10, 0.01 | −0.05 | −0.10, 0.00 | −0.06 | −0.10, −0.03 | −0.07 | −0.10, −0.03 |
| 18.5–25 (Normal weight) | 0.00 | Referent | 0.00 | Referent | 0.00 | Referent | 0.00 | Referent | 0.00 | Referent | 0.00 | Referent |
| ≥25 (Overweight/obese) | −0.04 | −0.06, −0.03 | −0.04 | −0.06, −0.03 | −0.05 | −0.06, −0.03 | −0.04 | −0.06, −0.03 | −0.03 | −0.04, −0.02 | −0.3 | −0.04, −0.02 |
| No. of comorbid conditions | ||||||||||||
| 0 | 0.00 | Referent | 0.00 | Referent | 0.00 | Referent | 0.00 | Referent | 0.00 | Referent | 0.00 | Referent |
| 1 | −0.01 | −0.03, 0.00 | −0.01 | −0.03, 0.00 | −0.01 | −0.33, 0.00 | −0.02 | −0.03, 0.00 | −0.01 | −0.02, 0.00 | −0.01 | −0.03, 0.00 |
| 2 | −0.04 | −0.05, −0.02 | −0.04 | −0.05, −0.02 | −0.05 | −0.06, −0.03 | −0.05 | −0.07, −0.03 | −0.03 | −0.05, −0.02 | −0.03 | −0.05, −0.02 |
| ≥3 | −0.10 | −0.11, −0.08 | −0.10 | −0.11, −0.08 | −0.12 | −0.14, −0.10 | −0.12 | −0.14, −0.10 | −0.09 | −0.10, −0.07 | −0.09 | −0.10, −0.7 |
| Depressive symptoms | ||||||||||||
| No | 0.00 | Referent | 0.00 | Referent | 0.00 | Referent | 0.00 | Referent | 0.00 | Referent | 0.00 | Referent |
| Yes | −0.10 | −0.01, −0.08 | −0.10 | −0.11, −0.08 | −0.10 | −0.13, −0.08 | −0.10 | −0.13, −0.08 | −0.09 | −0.10, −0.07 | −0.09 | −0.10, −0.07 |
| Diabetes | ||||||||||||
| No | 0.00 | Referent | 0.00 | Referent | 0.00 | Referent | 0.00 | Referent | 0.00 | Referent | 0.00 | Referent |
| Yes | −0.01 | −0.02, 0.01 | −0.01 | −0.02, 0.01 | −0.01 | −0.02, 0.01 | −0.01 | −0.02, 0.01 | −0.01 | −0.02, 0.00 | −0.01 | −0.02, 0.00 |
Abbreviation: CI, confidence interval.
a Random-effects linear regression was used and included a random intercept and random slope with exchangeable correlation matrix.
b Weight (kg)/height (m)2.
Other factors were significantly related to slower speeds, including age, sex, race, the number of other comorbid conditions, and the presence of depressive symptoms. These results were largely unchanged in the models that included an interaction between visual impairment status and years since baseline.
Visual impairment status and mobility disability
For each year of observation, the odds of being classified as disabled for all 3 tasks increased by approximately 20% (Table 3, models 4a, 5a, and 6a). Additionally, the VI were about twice as likely to be classified as disabled than the NVI over the study period after adjustment for all other covariates. We included an interaction between years since baseline and visual impairment status to determine whether the odds of having mobility disability increased at different rates in the VI and the NVI (Table 3, models 4b, 5b, and 6b). However, this interaction was not significant for any of the mobility disability outcomes, indicating that the difference in the odds of having mobility disability between the VI and the NVI remained the same over the study period.
Table 3.
Longitudinal Association Between the Odds of Being Classified as Disabled Based on Walking Speeds and Visual Impairment Status in the Salisbury Eye Evaluation Study, Salisbury, Maryland, 1993–2001
| Variable | Disability Walking Up 7 Stairs |
Disability Walking Down 7 Stairs |
Disability Walking 4 m |
|||||||||
|---|---|---|---|---|---|---|---|---|---|---|---|---|
| Model 4aa |
Model 4ba |
Model 5aa |
Model 5ba |
Model 6aa |
Model 6ba |
|||||||
| OR | 95% CI | OR | 95% CI | OR | 95% CI | OR | 95% CI | OR | 95% CI | OR | 95% CI | |
| Change per year since baseline | 1.19 | 1.17, 1.22 | 1.20 | 1.17, 1.22 | 1.19 | 1.16, 1.22 | 1.19 | 1.16, 1.22 | 1.20 | 1.17, 1.23 | 1.20 | 1.17, 1.23 |
| Visual impairment status | ||||||||||||
| Not visually impaired | 1.00 | Referent | 1.00 | Referent | 1.00 | Referent | 1.00 | Referent | 1.00 | Referent | 1.00 | Referent |
| Visually impaired | 1.80 | 1.42, 2.26 | 1.69 | 1.22, 2.32 | 2.98 | 1.58, 2.48 | 2.08 | 1.51, 2.85 | 1.65 | 1.31, 2.10 | 1.78 | 1.26, 2.52 |
| Visual impairment status × years since baseline | ||||||||||||
| Not visually impaired | 1.00 | Referent | 1.00 | Referent | 1.00 | Referent | 1.00 | Referent | 1.00 | Referent | 1.00 | Referent |
| Visually impaired | 1.02 | 0.95, 1.08 | 0.99 | 0.93, 1.05 | 0.98 | 0.92, 1.04 | ||||||
| Baseline age categories, years | ||||||||||||
| 65–69 | 1.00 | Referent | 1.00 | Referent | 1.00 | Referent | 1.00 | Referent | 1.00 | Referent | 1.00 | Referent |
| 70–74 | 1.61 | 1.29, 2.02 | 1.61 | 1.29, 2.01 | 1.74 | 1.38, 2.20 | 1.74 | 1.38, 2.20 | 1.57 | 1.22, 2.01 | 1.58 | 1.23, 2.03 |
| 75–79 | 3.69 | 2.89, 4.73 | 3.69 | 2.88, 4.72 | 399 | 3.09, 5.16 | 4.00 | 3.10, 5.17 | 3.83 | 3.00, 5.00 | 3.83 | 2.95, 5.00 |
| ≥80 | 5.79 | 4.33, 7.72 | 5.80 | 4.34, 7.76 | 6.28 | 4.68, 8.42 | 6.26 | 4.67, 8.41 | 6.43 | 4.78, 8.64 | 6.33 | 4.70, 8.53 |
| Sex | ||||||||||||
| Men | 1.00 | Referent | 1.00 | Referent | 1.00 | Referent | 1.00 | Referent | 1.00 | Referent | 1.00 | Referent |
| Women | 2.17 | 1.79, 2.63 | 2.17 | 1.79, 2.63 | 2.08 | 1.71, 2.53 | 2.08 | 1.71, 2.53 | 1.88 | 1.54, 2.31 | 1.86 | 1.52, 2.28 |
| Race | ||||||||||||
| White | 1.00 | Referent | 1.00 | Referent | 1.00 | Referent | 1.00 | Referent | 1.00 | Referent | 1.00 | Referent |
| Black | 3.04 | 2.51, 3.69 | 3.04 | 2.51, 3.69 | 2.78 | 2.28, 3.38 | 2.77 | 2.28, 3.37 | 3.23 | 2.66, 3.93 | 3.24 | 2.66, 3.94 |
| Smoking status | ||||||||||||
| Never | 1.00 | Referent | 1.00 | Referent | 1.00 | Referent | 1.00 | Referent | 1.00 | Referent | 1.00 | Referent |
| Current/former | 0.96 | 0.81, 1.16 | 0.97 | 0.80, 1.16 | 0.99 | 0.82, 1.19 | 0.99 | 0.82, 1.19 | 1.10 | 0.90, 1.34 | 1.09 | 0.90, 1.32 |
| Body mass indexb | ||||||||||||
| <18.5 (Underweight) | 1.33 | 0.81, 2.15 | 1.32 | 0.81, 2.14 | 1.35 | 0.85, 2.12 | 1.35 | 0.85, 2.13 | 1.51 | 0.97, 2.35 | 1.54 | 0.98, 2.40 |
| 18.5–25 (Normal weight) | 1.00 | Referent | 1.00 | Referent | 1.00 | Referent | 1.00 | Referent | 1.00 | Referent | 1.00 | Referent |
| ≥25 (Overweight/ obese) | 1.32 | 1.13, 1.59 | 1.34 | 1.13, 1.59 | 1.35 | 1.14, 1.60 | 1.35 | 1.14, 1.60 | 1.09 | 0.91, 1.30 | 1.09 | 0.91, 1.30 |
| No. of comorbid conditions | ||||||||||||
| 0 | 1.00 | Referent | 1.00 | Referent | 1.00 | Referent | 1.00 | Referent | 1.00 | Referent | 1.00 | Referent |
| 1 | 1.17 | 1.01, 1.35 | 1.16 | 1.01, 1.35 | 1.31 | 1.13, 1.53 | 1.32 | 1.13, 1.53 | 1.14 | 0.96, 1.35 | 1.15 | 0.97, 1.37 |
| 2 | 1.42 | 1.21, 1.67 | 1.42 | 1.21, 1.66 | 1.54 | 1.30, 1.82 | 1.54 | 1.30, 1.82 | 1.58 | 1.32, 1.89 | 1.61 | 1.34, 1.92 |
| ≥3 | 2.11 | 1.75, 2.54 | 2.10 | 1.74, 2.53 | 2.28 | 1.89, 2.75 | 2.28 | 1.89, 2.75 | 2.17 | 1.78, 2.65 | 2.18 | 1.78, 2.67 |
| Depressive symptoms | ||||||||||||
| No | 1.00 | Referent | 1.00 | Referent | 1.00 | Referent | 1.00 | Referent | 1.00 | Referent | 1.00 | Referent |
| Yes | 1.89 | 1.52, 2.35 | 1.89 | 1.52, 2.35 | 1.87 | 1.51, 2.33 | 1.87 | 1.51, 2.33 | 2.06 | 1.65, 2.57 | 2.07 | 1.66, 2.59 |
| Diabetes | ||||||||||||
| No | 1.00 | Referent | 1.00 | Referent | 1.00 | Referent | 1.00 | Referent | 1.00 | Referent | 1.00 | Referent |
| Yes | 1.02 | 0.88, 1.18 | 1.02 | 0.88, 1.17 | 1.03 | 0.89, 1.18 | 1.03 | 0.89, 1.18 | 1.00 | 0.83, 1.15 | 0.97 | 0.2, 1.14 |
Abbreviations: CI, confidence interval; OR, odds ratio.
a Generalized estimating equation models specifying an exchangeable working correlation matrix were used.
b Weight (kg)/height (m)2.
Losses to follow-up
To determine the potential affect of losses to follow-up on our results, we modeled the cross-sectional odds of being lost to follow-up compared with the odds of not being lost to follow-up at each study visit after baseline. From baseline to the 2-year visit, the VI were not more likely than the NVI to be lost to follow-up, although those classified as having disability walking up stairs (ORlost at 2-year visit = 1.9, 95% CI: 1.3, 2.7), walking down stairs (ORlost at 2-year visit = 1.7, 95% CI: 1.2, 2.4), and walking 4 m (ORlost at 2-year visit = 1.7, 95% CI: 1.1, 2.4) were more likely to be lost than those not reporting these difficulties. The interaction terms assessing differential loss to follow-up of VI participants with slowest speeds were not significant for any of the performance-based measurements (data not shown). Models predicting losses to follow-up at the 6-year and 8-year visits had the same inference; the odds of being lost were not significantly different by visual impairment status, and the interaction terms assessing differential loss to follow-up of VI participants with slowest speeds were not significant for any of the performance-based measurements.
Sensitivity analyses
To examine how changing the criteria used to determine mobility disability would affect the results, we shifted the cutpoint for defining mobility disability from 1 standard deviation to speeds below 0.5 standard deviations of the population baseline mean. This meant that disability was redefined as speeds slower than 0.8 steps/second walking up stairs, 0.7 steps/second walking down stairs, and 0.7 m/second walking 4 m. After we shifted the disability cutpoint, the VI were more likely than the NVI to be classified as having mobility disability for all 3 outcomes (ORdisabled walking up steps = 1.7, 95% CI: 1.2, 2.3; ORdisabled walking down steps = 1.7, 95% CI: 1.2, 2.3; and ORdisabled walking 4 m = 1.8, 95% CI: 1.3, 2.4). However, the interactions between visual impairment status and years since baseline were not significant for any of the outcomes (data not shown).
We explored how changing our definition of visual impairment affected our results and shifted this definition to best-corrected distance visual acuity worse than 20/60 in the better-seeing eye. This alternate cutpoint was chosen because it is the visual acuity criterion for visual impairment used by the World Health Organization (16). The inference and resulting speed estimates were largely the same as in our primary analyses and indicated that the VI had significantly slower performance speeds than the NVI (βwalking up steps = −0.10 steps/second, 95% CI: −0.14, −0.06; βwalking down steps = −0.14 steps/second, 95% CI: −0.20, −0.09; and βwalking 4 m = −0.09 m/second, 95% CI: −0.13, −0.05). Additionally, the interactions between the new category of visual impairment status and years since baseline were not statistically significant (data not shown).
DISCUSSION
We found that VI participants in the SEE Study had slower speeds than their NVI counterparts at every study visit; however, there is no evidence that the decline in speeds over time differed between these 2 groups. These results suggest that the difference in walking speeds between the VI and the NVI remained over the study period and did not increase over time. We also found that the VI were more likely than the NVI to be classified as having mobility disability at each study visit. Similar to our analyses of speeds, the change over time in the odds of being classified as having mobility disability was similar between the VI and the NVI.
The results of this study were contrary to our a priori hypothesis that the VI would have greater speed declines and steeper mobility disability trajectories than the NVI over the SEE Study period. We examined the following 2 possible explanations of why we did not observe a difference in mobility trajectories between the VI and the NVI: 1) differential loss to follow-up of the VI with the slowest performance speeds, and 2) sensitivity to the cutpoints of visual impairment and disability.
We posited that speed trajectories in the VI might have been attenuated (i.e., the slope of this trajectory would have been brought closer to the slope of the NVI) if there were a differential loss of these individuals. However, our cross-sectional models determining the odds of being lost to follow-up compared with the odds of remaining in the study at each study visit indicate that the interaction terms assessing differential losses to follow-up of VI participants with slowest speeds were not significant. This suggests that our observed results are likely not due to differential loss to follow-up of the VI participants with slowest speeds over the SEE Study period.
An advantage of the SEE Study is that it provides performance-based mobility measurements that allowed us to assess change in speed over time. However, there are no clinical standards to classify individuals as disabled on the basis of mobility performance. Previous studies have suggested that, for walking on flat surfaces, speeds of 0.6 m/second or slower indicate poor health and functioning (1, 27, 28). In our analyses, we defined walking disability as 1 standard deviation below the baseline population means, which corresponded to 0.6 m/second for the 4-m task. Therefore, our cutpoint likely identified performance values on the stair tests that were abnormal. Our data did not support the hypothesis that the odds of being classified as disabled on the basis of performance speeds would increase at a greater rate over time in the VI compared with the NVI.
We examined the effect of shifting our definition of disability to speeds slower than 0.5 standard deviations below the population mean. These analyses resulted in the same inference for all of the covariates included in our primary models. Similarly, when we changed our definition of visual impairment to distance visual acuity worse than 20/60, we again observed the same inference as in our primary models. These observations indicate that our results are robust to the cutpoint of disability and visual impairment used.
We can offer only potential explanations for why the VI had slower speeds than the NVI at each study visit, but the trajectory of these speeds was similar in these 2 groups. Cesari et al. (29) have shown that comorbidity is associated with worse physical functioning, and speeds were slower as the number of comorbidities increased. In the SEE Study, 41% of the VI and 31% of the NVI had 3 or more comorbid conditions; therefore, it is possible that the mobility trajectories diverged prior to study enrollment and prior to the accumulation of multiple health conditions. Further research to determine this would require a longitudinal study of individuals without comorbid conditions who develop incident visual impairment.
This study found that the largest difference in walking speeds between the VI and the NVI was observed for the stair descent task (−0.11 steps/second) (Table 2). The differences in speeds were similar for both walking up stairs and walking 4 m (−0.08 steps/second and −0.08 m/second, respectively) (Table 2). This may suggest that walking down stairs is the most difficult of the 3 tasks for the VI. Prior research has suggested that slower walking speeds in the VI may be partially driven by the inability to recognize changes in terrain, such as a step or a ramp (29, 30). Additionally, the riser of steps has better contrast than the top surface of steps, meaning that it is easier to see a step's riser than the top of a step (30, 31). When an individual walks down stairs, the step riser is not visible, and this may explain why the biggest difference in speed between the VI and the NVI was observed for this task.
The results from this study imply that walking speeds in the VI remain significantly slower than in the NVI as people age, and that those with visual impairment are more likely than the NVI to be classified as having mobility disability. It is possible that the slowing of walking speed is an instantaneous adaptation at the onset of visual impairment, and that the VI walk slowly in an effort to maintain or improve their perception of mobility safety. This hypothesis makes sense, because the VI have greater fear of falling than do the NVI (32). It is possible that efforts to improve mobility speeds alone may not be effective at improving the perception of mobility disability. Instead, this could suggest that, if the goal is to reduce mobility disability in the VI, rehabilitation efforts should include interventions aimed at improving both mobility speed and mobility safety, such as with the use of mobility aids.
ACKNOWLEDGMENTS
Author affiliations: Dana Center for Preventive Ophthalmology, Wilmer Eye Institute, Johns Hopkins University, Baltimore, Maryland (Bonnielin K. Swenor, Beatriz Muñoz, Sheila K. West).
This study was supported by the National Institute on Aging (grants AG10184 and T32AG000247).
We are grateful to Alison Abraham, Karen Bandeen-Roche, and Pradeep Ramulu for providing technical input on the analyses used in this study.
Conflict of interest: none declared.
REFERENCES
- 1.Studenski S, Perera S, Patel K, et al. Gait speed and survival in older adults. JAMA. 2011;305(1):50–58. doi: 10.1001/jama.2010.1923. [DOI] [PMC free article] [PubMed] [Google Scholar]
- 2.Guralnik JM, Ferrucci L, Pieper CF, et al. Lower extremity function and subsequent disability: consistency across studies, predictive models, and value of gait speed alone compared with the short physical performance battery. J Gerontol A Biol Sci Med Sci. 2000;55(4):M221–M231. doi: 10.1093/gerona/55.4.m221. [DOI] [PubMed] [Google Scholar]
- 3.Fried LP, Bandeen-Roche K, Chaves PH, et al. Preclinical mobility disability predicts incident mobility disability in older women. J Gerontol A Biol Sci Med Sci. 2000;55(1):M43–M52. doi: 10.1093/gerona/55.1.m43. [DOI] [PubMed] [Google Scholar]
- 4.Abellan van Kan G, Rolland Y, Andrieu S, et al. Gait speed at usual pace as a predictor of adverse outcomes in community-dwelling older people an International Academy on Nutrition and Aging (IANA) Task Force. J Nutr Health Aging. 2009;13(10):881–889. doi: 10.1007/s12603-009-0246-z. [DOI] [PubMed] [Google Scholar]
- 5.Oh-Park M, Wang C, Verghese J. Stair negotiation time in community-dwelling older adults: normative values and association with functional decline. Arch Phys Med Rehabil. 2011;92(12):2006–2011. doi: 10.1016/j.apmr.2011.07.193. [DOI] [PMC free article] [PubMed] [Google Scholar]
- 6.Hamel KA, Cavanagh PR. Stair performance in people aged 75 and older. J Am Geriatr Soc. 2004;52(4):563–567. doi: 10.1111/j.1532-5415.2004.52162.x. [DOI] [PubMed] [Google Scholar]
- 7.Shumway-Cook A, Guralnik JM, Phillips CL, et al. Age-associated declines in complex walking task performance: the Walking InCHIANTI toolkit. J Am Geriatr Soc. 2007;55(1):58–65. doi: 10.1111/j.1532-5415.2006.00962.x. [DOI] [PMC free article] [PubMed] [Google Scholar]
- 8.Schrack JA, Simonsick EM, Chaves PH, et al. The role of energetic cost in the age-related slowing of gait speed. J Am Geriatr Soc. 2012;60(10):1811–1816. doi: 10.1111/j.1532-5415.2012.04153.x. [DOI] [PMC free article] [PubMed] [Google Scholar]
- 9.Friedman DS, Freeman E, Munoz B, et al. Glaucoma and mobility performance: the Salisbury Eye Evaluation Project. Ophthalmology. 2007;114(12):2232–2237. doi: 10.1016/j.ophtha.2007.02.001. [DOI] [PubMed] [Google Scholar]
- 10.Turano KA, Broman AT, Bandeen-Roche K, et al. Association of visual field loss and mobility performance in older adults: Salisbury Eye Evaluation Study. Optom Vis Sci. 2004;81(5):298–307. doi: 10.1097/01.opx.0000134903.13651.8e. [DOI] [PubMed] [Google Scholar]
- 11.Patel I, Turano KA, Broman AT, et al. Measures of visual function and percentage of preferred walking speed in older adults: the Salisbury Eye Evaluation Project. Invest Ophthalmol Vis Sci. 2006;47(1):65–71. doi: 10.1167/iovs.05-0582. [DOI] [PubMed] [Google Scholar]
- 12.West SK, Munoz B, Rubin GS, et al. Function and visual impairment in a population-based study of older adults. The SEE project. Salisbury Eye Evaluation. Invest Ophthalmol Vis Sci. 1997;38(1):72–82. [PubMed] [Google Scholar]
- 13.Rubin GS, West SK, Munoz B, et al. A comprehensive assessment of visual impairment in a population of older Americans. The SEE Study. Salisbury Eye Evaluation Project. Invest Ophthalmol Vis Sci. 1997;38(3):557–568. [PubMed] [Google Scholar]
- 14.Nelson-Quigg JM, Cello K, Johnson CA. Predicting binocular visual field sensitivity from monocular visual field results. Invest Ophthalmol Vis Sci. 2000;41(8):2212–2221. [PubMed] [Google Scholar]
- 15.American Academy of Ophthalmology Vision Rehabilitation Committee. Preferred Practice Pattern: Vision Rehabilitation for Adults. San Francisco, CA: American Academy of Ophthalmology; 2007. [Google Scholar]
- 16.World Health Organization. Geneva, Switzerland: World Health Organization; 2010. International Statistical Classification of Diseases and Related Health Problems, Tenth Revision. [Google Scholar]
- 17.West SK, Rubin GS, Munoz B, et al. Assessing functional status: correlation between performance on tasks conducted in a clinic setting and performance on the same task conducted at home. The Salisbury Eye Evaluation Project Team. J Gerontol A Biol Sci Med Sci. 1997;52(4):M209–M217. doi: 10.1093/gerona/52a.4.m209. [DOI] [PubMed] [Google Scholar]
- 18.Folstein MF, Folstein SE, McHugh PR. “Mini-mental state”. A practical method for grading the cognitive state of patients for the clinician. J Psychiatr Res. 1975;12(3):189–198. doi: 10.1016/0022-3956(75)90026-6. [DOI] [PubMed] [Google Scholar]
- 19.Verbrugge LM, Lepkowski JM, Imanaka Y. Comorbidity and its impact on disability. Milbank Q. 1989;67(3-4):450–484. [PubMed] [Google Scholar]
- 20.Fried LP, Bandeen-Roche K, Kasper JD, et al. Association of comorbidity with disability in older women: the Women's Health and Aging Study. J Clin Epidemiol. 1999;52(1):27–37. doi: 10.1016/s0895-4356(98)00124-3. [DOI] [PubMed] [Google Scholar]
- 21.Goldberg DP, Rickels K, Downing R, et al. A comparison of two psychiatric screening tests. Br J Psychiatry. 1976;129:61–67. doi: 10.1192/bjp.129.1.61. [DOI] [PubMed] [Google Scholar]
- 22.Goldberg DP, Hillier VF. A scaled version of the General Health Questionnaire. Psychol Med. 1979;9(1):139–145. doi: 10.1017/s0033291700021644. [DOI] [PubMed] [Google Scholar]
- 23.Akaike H. A new look at the statistical model identification. IEEE Trans Automat Contr. 1974;19(6):716–723. [Google Scholar]
- 24.Schwarz G. Estimating the dimension of a model. Ann Stat. 1978;6(2):461–464. [Google Scholar]
- 25.West SK, Rubin GS, Broman AT, et al. How does visual impairment affect performance on tasks of everyday life? The SEE Project. Salisbury Eye Evaluation. Arch Ophthalmol. 2002;120(6):774–780. doi: 10.1001/archopht.120.6.774. [DOI] [PubMed] [Google Scholar]
- 26.Zeger SL, Liang KY. Longitudinal data analysis for discrete and continuous outcomes. Biometrics. 1986;42(1):121–130. [PubMed] [Google Scholar]
- 27.Cesari M, Kritchevsky SB, Penninx BW, et al. Prognostic value of usual gait speed in well-functioning older people—results from the Health, Aging and Body Composition Study. J Am Geriatr Soc. 2005;53(10):1675–1680. doi: 10.1111/j.1532-5415.2005.53501.x. [DOI] [PubMed] [Google Scholar]
- 28.Studenski S, Perera S, Wallace D, et al. Physical performance measures in the clinical setting. J Am Geriatr Soc. 2003;51(3):314–322. doi: 10.1046/j.1532-5415.2003.51104.x. [DOI] [PubMed] [Google Scholar]
- 29.Cesari M, Onder G, Russo A, et al. Comorbidity and physical function: results from the aging and longevity study in the Sirente geographic area (ilSIRENTE study) Gerontology. 2006;52(1):24–32. doi: 10.1159/000089822. [DOI] [PubMed] [Google Scholar]
- 30.Legge GE, Yu D, Kallie CS, et al. Visual accessibility of ramps and steps. J Vis. 2010;10(11):8. doi: 10.1167/10.11.8. [DOI] [PMC free article] [PubMed] [Google Scholar]
- 31.Bochsler TM, Legge GE, Gage R, et al. Recognition of ramps and steps by people with low vision. Invest Ophthalmol Vis Sci. 2013;54(1):288–294. doi: 10.1167/iovs.12-10461. [DOI] [PMC free article] [PubMed] [Google Scholar]
- 32.Freeman EE, Munoz B, Rubin G, et al. Visual field loss increases the risk of falls in older adults: the Salisbury Eye Evaluation. Invest Ophthalmol Vis Sci. 2007;48(10):4445–4450. doi: 10.1167/iovs.07-0326. [DOI] [PubMed] [Google Scholar]