

Abstract
Objective
To develop a dynamic algorithm that predicts the risk of metastases from any time point after radical prostatectomy (RP).
Patients and methods
The study cohort consisted of 5741 RP patients who were treated from 1990–99.
Patients were grouped into one of four clinical states at follow-up: State1, prostate-specific antigen (PSA) undetectable; State2, PSA 0.15–0.39 ng/mL; State3, PSA ≥ 0.4 ng/mL; and State4, previous androgen deprivation or radiation therapy.
Follow-up epochs (alive and at risk of systemic progression) at 0, 2, 4 and 6 years post-RP, cumulative incidence curves and multistate Cox models were used to assess the risk of metastases over the ensuing 5-year interval.
Gleason score, seminal vesicle and surgical margin involvement, and PSA variables were evaluated as predictors.
Results
Median follow-up was 11.7 years, with 4411, 4256 and 3983 patients followed with PSA at 2, 4 and 6 years, respectively.
In total, 287 metastatic events occurred and the 5-year risk of metastasis was 0.4%, 2.1%, 8.7% and 12.6% for men in States 1, 2, 3 and 4, respectively.
Independent predictors of metastasis by group included seminal vesicle involvement (all groups), Gleason score (groups 1, 3 and 4), current PSA (groups 3 and 4) and maximum past PSA (group 4).
Conclusions
We present a web-based prognostic tool for patients undergoing RP that is valid at many time points after surgery.
Our tool predicts the development of metastases.
Keywords: prostatectomy, prostate cancer, clinical prediction, metastases, outcome assessment
Introduction
Up to one-third of patients undergoing radical prostatectomy (RP) for clinically localized prostate cancer (PCa) develop a biochemical recurrence (BCR) within 10 years [1]. Although many patients with BCR have indolent disease, some ultimately progress to metastases and die from PCa [2,3]. The ability to distinguish patients at risk of metastases and death from those with less aggressive disease is fundamental to patient counselling and salvage therapy selection.
Gleason score, preoperative PSA, seminal vesicle involvement, surgical margin status and preoperative PSA doubling time have been found to predict metastases and PCa mortality in multiple studies [4–10]. Almost all outcome prediction models rely on predictors available at the time of RP and do not utilize follow-up information to adjust predictions. These fixed predictions do not consider changes that occur in each patient’s clinical state over time that alter their outcome risk.
To address the problem of fixed predictions, we developed a dynamic or ‘real-time’ survival model that can estimate a patient’s risk of systemic progression (SP) at any time point after RP. In addition to the information available at RP, our method allows for changing PSA values and the use of secondary therapies. The resulting model has the benefit of time independence and allows for real-time predictions based on the clinical state at current follow-up.
Patients and methods
Study cohort
With Mayo Clinic Institutional Review Board approval, 8290 men in whom RP was performed between 1990 and 1999 were identified from the Mayo Clinic Prostatectomy Registry. Exclusion criteria (more than one possible) included: foreign patients (n = 388), neoadjuvant (n = 746) radiation or androgen deprivation therapy, positive lymph nodes (n = 487), absent preoperative PSA (n = 456) or pathological Gleason score value (n = 256), and research authorization denial (n = 92). Patients who received adjuvant (within 90 days of RP, n = 1,531) radiation or androgen deprivation were also excluded and the possible indications for such treatment were (more than one possible): positive lymph nodes (n = 441), positive surgical margins (n = 1247), seminal vesicle invasion (n = 571) and failure to achieve undetectable PSA with 90 days (n = 171). This left 5741 men available for study.
Pathological evaluation
RP with bilateral pelvic lymphadenectomy was performed in all patients using standardized techniques. The extirpated specimens were evaluated using a limited sampling technique, including frozen sections at surgery and paraffin sections the next day. Staging was carried out in accordance with the 1997 TNM system and grading was performed using the Gleason system. Positive surgical margins were defined by cancer at the inked margin.
Patient follow-up
Patients were evaluated with PSA and physical examination quarterly for year 1, biannually for year 2, and annually thereafter if there was no evidence of PSA recurrence. Patients followed at our institution (53% of cohort) had their PSA level assessed by the Hybritech PSA test (Beckman Coulter, Inc., Fullerton, CA, USA). Patients receiving follow-up outside our institution had either annual mailed blood draw kits for analysis in our laboratory or had testing carried out by their local physician. A PSA ≥ 0.4 ng/mL triggered an evaluation for recurrent cancer with imaging (usually bone scan and abdominopelvic CT scan) and/or prostate fossa biopsy.
Definitions
For the purposes of the present analyses, a follow-up epoch was defined as a postoperative time point at which patient follow-up might occur. We defined eight follow-up epochs: Epoch0 = time of RP, Epoch1 = 1 year post-RP, Epoch2 = 2 years post-RP, …, and Epoch7 = 7 years post-RP. At each follow-up epoch, patients were classified into one of four clinical states based on their most recent PSA level and treatment history: State1 = PSA < 0.15 ng/mL (the lower detection limit of our institution’s assay); State2 = PSA 0.15–0.39 ng/mL; State3 = PSA > 0.4 ng/mL (our definition of BCR) [2,3]; and State4 = previous androgen ablation or pelvic radiation therapy for BCR. These clinical states were defined a priori on clinical grounds. A follow-up epoch cohort comprises a group of men who survived to a specific follow-up epoch without SP (e.g. all men surviving 3 years without systemic metastases would be in the Epoch3 cohort on their third annual anniversary of RP). SP was defined as: (i) the presence of metastases on imaging or (ii) biopsy-proven soft tissue metastases at a location other than the prostatic fossa.
Statistical analysis
To assess outcomes that might occur after a typical follow-up visit, patient cohorts were defined based on those at risk of SP at each follow-up epoch. To be at risk at follow-up epoch, E, a man had to have a follow-up visit within 6 months of E and not have documented SP. Median follow-up from RP was 11.7 years, with 3929 men still at risk at 10 years and 1550 at 14 years. The 5-year risk of SP was estimated for each follow-up epoch cohort using competing risks cumulative incidence curves (death without SP was a competing risk) and a Cox model [11]. Gleason score, seminal vesicle and surgical margin involvement, preoperative PSA, current PSA, maximum PSA during follow-up, and PSA velocity were evaluated as predictors, both within time epoch cohorts and the pooled cohorts. Continuous predictors were analyzed as such in regression models (linear or log-linear terms), although they may be categorized for tabular reporting. Because the effects of follow-up epochs were found to be minimal, we pooled the 2-, 4- and 6-year epoch cohorts for group level regressions and used fixed covariate Cox models. Because patients could be in multiple epoch cohorts, the sandwich variance estimator (aggregated over subjects) was used to account for potential dependencies in the pooled epoch cohort analyses. Nested models were compared using the score model chi-squared based on the sandwich variance. Harrell’s concordance (C)-statistic/index was used to summarize model discrimination for subsequent systemic progression. C is in the range 0–1 and is interpreted similar to the receiveRoperating characteristic curve area, with values approaching 0.5 being consistent with chance discrimination, 0.7–0.8 considered acceptable and above 0.8 considered as excellent. Statistical analyses were performed using SAS, version 9.1 (SAS Institute, Cary, NC, USA). P < 0.05 was considered statistically significant. An online version of our dynamic risk tool is available (http://urology.surgery.duke.edu/nomograms).
Results
Table 1 shows the characteristics of the cohorts of patients who survived to each follow-up epoch. Of note, the proportion of patients with high-risk features remained stable across follow-up epochs. Second, as might be anticipated, the proportion of patients in State1 (undetectable PSA) decreased across epochs, from 79% to 69%, whereas the proportion of patients in the remaining three states increased. In accordance with this, the proportion of patients with previous therapies increased from 5% to 14% across epochs.
Table 1.
Characteristics of the study cohorts by current visit epoch.
| Follow-up cohort by current visit epoch |
||||
|---|---|---|---|---|
| Characteristic |
T = 0 years (n = 5741) |
T = 2 years (n = 4411) |
T = 4 years (n = 4256) |
T = 6 years (n = 3983) |
| Age (years), mean (SD) | 63.7 (6.8) | 65.6 (6.8) | 67.6 (6.8) | 69.5 (6.7) |
| Preoperative PSA (median, IQR) | 6.6 (4.5–10.0) | 6.6 (4.6–10.0) | 6.6 (4.6–9.9) | 6.6 (4.6–9.8) |
| Gleason score, n (%) | ||||
| 2–6 | 4124 (72) | 3173 (72) | 3062 (72) | 2885 (72) |
| 7 | 1408 (25) | 1082 (25) | 1048 (25) | 967 (24) |
| 8–10 | 209 (4) | 156 (4) | 146 (3) | 131 (3) |
| TNM stage, n (%) | ||||
| pT2 | 4443 (77) | 3424 (78) | 3314 (78) | 3093 (78) |
| pT3/4 | 1298 (23) | 987 (22) | 942 (22) | 890 (22) |
| Surgical margins, n (%) | ||||
| Positive | 1605 (28) | 1252 (28) | 1202 (28) | 1139 (29) |
| Negative | 4136 (72) | 3159 (72) | 3054 (72) | 2844 (71) |
| Seminal vesicle invasion, n (%) | ||||
| Positive | 426 (7) | 322 (7) | 297 (7) | 288 (7) |
| Negative | 5315 (93) | 4089 (93) | 3959 (93) | 3695 (93) |
| Adjuvant or salvage therapy within 30 days of current visit, n (%) | ||||
| ADT | NA | 26 (0.6) | 31 (0.7) | 20 (0.5) |
| EBRT | NA | 48 (1.1) | 40 (0.9) | 27 (0.7) |
| Clinical state at current visit, n (%) | ||||
| Group 1: undetectable PSA | NA | 3468 (79) | 3123 (73) | 2756 (69) |
| Group 2: PSA 0.15–0.4 ng/mL | NA | 456 (10) | 366 (9) | 363 (9) |
| Group 3: PSA ≥ 0.4 ng/mL | NA | 255 (6) | 345 (8) | 327 (8) |
| Group 4: previous ADT or EBRT | NA | 232 (5) | 422 (10) | 537 (14) |
| Systemic progression after current visit: (%) | ||||
| Within 5 years | 1.6 | 1.9 | 2.3 | 2.7 |
| Within 6 years | 2.0 | 2.3 | 2.8 | 3.2 |
| Within 7 years | 2.6 | 2.8 | 3.3 | 3.4 |
| Within 8 years | 2.9 | 3.2 | 3.8 | 3.8 |
| Within 9 years | 3.6 | 4.7 | 4.1 | 4.2 |
| Within 10 years | 4.1 | 4.2 | 4.4 | 4.6 |
| Number at risk at year 10 | 3929 | 1983 | 1190 | 494 |
| Systemic progression ever, n (crude %) | 287 (5.0) | 191 (4.3) | 167 (3.9) | 134 (3.4) |
ADT, androgen deprivation therapy; EBRT, external beam radiation therapy; IQR, interquartile range; NA, not applicable; T, time since radical prostatectomy.
When the baseline (Epoch0) cohort is assessed over the first 15 years of follow-up, the hazard rate of SP remains constant at 0.4% per year (range 0.3–0.7%), suggesting that the current epoch has a minimal effect on the risk of SP. Figure 1 demonstrates that the 5-year probability of SP depends slightly on the follow-up epoch (P = 0.057, comparing epochs 2, 3, 4, 5, 6 and 7 years, C = 0.52). For example, patients at Epoch2 have a 5-year risk of SP of 1.9%, whereas patients with at Epoch6 have a 5-year SP risk of 2.7%. This is because it takes time for metastases to develop and for patients to transition through increasingly severe clinical states. Interestingly, the 10-year risk of SP appears lower in later epochs (5, 6 and 7) than in earlier ones because increased age puts patients at a higher risk of competing mortality (Fig. 1). However, when considering the patient’s current clinical state at each follow-up epoch, the time dependency of the systemic progression risk is dramatically reduced (Figs 2A–D), implying that the current clinical state is much more important than time since surgery in predicting SP (Fig. 3). This is highlighted in Table 2, where the 5-year risk of SP is shown to be stable within current clinical states, regardless of follow-up epoch.
Fig. 1.

Cumulative incidence of systemic progression from current visit. Impact of follow-up epoch (years 2, 3, 4, 5, 6 and 7).
Fig. 2.
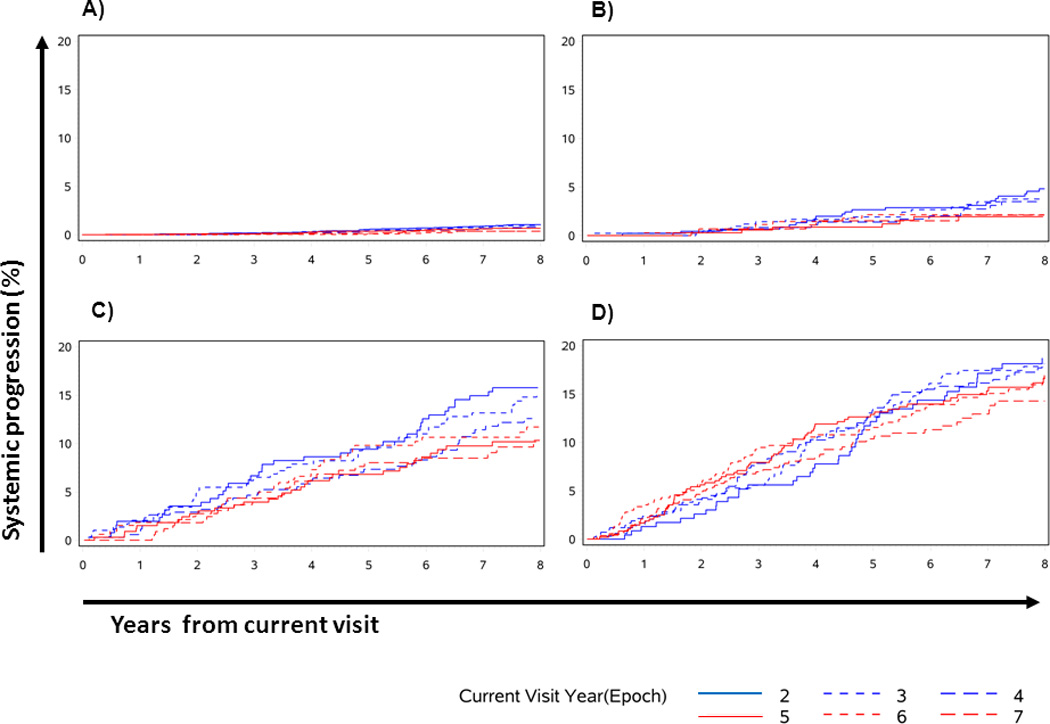
Cumulative incidence of systemic progression after the current visit. Impact of follow-up epoch (years 2, 3, 4, 5, 6 and 7), within each current visit clinical state. (A) Group 1, undetectable PSA. (B) Group 2, PSA 0.15–0.4 ng/mL. (C) Group 3, PSA ≥ 0.4 ng/mL. (D) Group 4, previous androgen deprivation therapy or external beam radiation therapy.
Fig. 3.

Cumulative incidence of systemic progression after the current visit. Impact of clinical state (pooled over follow-up epochs). ADT, androgen deprivation therapy; EBRT, external beam radiation therapy; Undet., undetectable.
Table 2.
The 5-year probability (%) of systemic progression by clinical disease state and current visit epoch.
| Epoch | Clinical status at current visit |
|||||
|---|---|---|---|---|---|---|
| Group 1 (undetectable PSA) |
Group 2 (PSA 0.15–0.4 ng/mL) |
Group 3 (PSA ≥ 0.4 ng/mL) |
Group 4 (previous ADT or EBRT) |
Pooled clinical states (assumed unknown) |
||
| Current visit epoch |
0 years | NA | NA | NA | NA | 1.6 (0.2) |
| 2 years | 0.6 (0.1) | 2.7 (0.8) | 9.4 (1.8) | 12.6 (2.2) | 1.9 (0.2) | |
| 4 years | 0.4 (0.1) | 1.4 (0.6) | 7.3 (1.4) | 13.6 (1.8) | 2.3 (0.2) | |
| 6 years | 0.1 (0.1) | 2.1 (0.8) | 9.8 (1.8) | 11.5 (1.5) | 2.7 (0.3) | |
| Pooled epochs** | 0.4 (0.1) | 2.1 (0.6) | 8.7 (1.3) | 12.6 (1.1) | NA | |
Cumulative incidence estimator, % (SE), with a competing risk of death without previous systemic progression.
Using years 2, 4, and 6.
ADT, androgen deprivation therapy; EBRT, external beam radiation therapy; NA, not applicable.
Given the importance of clinical state over follow-up epoch, Cox proportional hazards modelling was performed within clinical states on data pooled across the follow-up epochs to determine which variables affected outcomes for each clinical state. Current clinical state was highly significant (C = 0.831, P < 0.001). The effect of follow-up year adjusted for clinical state was not statistically significant (P = 0.25), nor did the effect of clinical state vary significantly by year (P = 0.33 for interaction). Univariate and multivariate hazard ratios (HRs) for prespecified models for the pooled time epochs are summarized in Table 3. The C-statistics for the multivariate models suggested modest to acceptable discrimination: 0.701 for State1, 0.669 for State2, 0.666 for State3 and 0.784 for State4. Table 3 shows that the HRs for individual predictors of systemic progression vary by the current clinical state, with the importance of Gleason score and seminal vesicle HRs declining as the clinical state worsens. Interestingly, positive surgical margins appear to be protective from SP in State3, probably because these lead to recurrences that are treated with salvage therapies. PSA-derived variables were highly correlated and, as such, models including PSA velocity were not presented because they did not improve upon models containing current PSA or maximum PSA (data not shown). Simplified models (starting with Gleason score and seminal vesicle involvement and then adding other variables) included current PSA for State3 and, for State4, current PSA (detectable or not) and maximum previous PSA. For State3, models with current PSA perform just as well as those including maximal PSA or both but, for simplicity, we chose a model including only current PSA. Based on the score chi-squared, the performance of these simplified models is almost identical to the full model. The C indices for the simplified models were 0.698 for State1, 0.648 for State2, 0.653 for State3 and 0.776 for State4, indicating that simplification did not result in a major loss of predictive ability. The 5-year observed rates of SP based on simplified model factors are presented in Table 4. State1 progression rates are in the range 0.1–3.2%, State2 in the range 0.7–4.1%, State3 in the range 1.9–20.3% and State4 in the range 1.5–32%. The online nomogram provides the predicted rates of SP based on these simplified models.
Table 3.
Predictors of systemic progression (hazard ratio, HR) within current clinical states, pooled across follow-up epochs.
| Predictor | Clinical status at current visit |
||||
|---|---|---|---|---|---|
| Group 1 (undetectable PSA) |
Group 2 (PSA 0.15–0.4 ng/mL) |
Group 3 (PSA ≥ 0.4 ng/mL) |
Group 4 (previous ADT or EBRT) |
||
| Univariate predictors of systemic progression |
Gleason score | 2.0 (1.5–2.6) | 1.4 (1.0–1.8) | 1.4 (1.1–1.7) | 1.3 (1.1–1.5) |
| Positive seminal vesicals | 4.9 (2.6–9.4) | 3.8 (1.9–7.5) | 2.2 (1.4 -3.4) | 2.1 (1.4–3.1) | |
| Positive surgical margins | 1.1 (0.6–2.0) | 1.3 (0.7–2.5) | 0.6 (0.4–1.0) | 0.6 (0.4–0.9) | |
| Preoperative PSA (log2) | 1.3 (1.1–1.6) | 1.1 (0.8–1.4) | 1.0 (0.9–1.3) | 1.0 (0.8–1.2) | |
| Current PSA (log2) | 1.4 (0.7–3.0) | 1.3 (1.2–1.5) | 4.2 (3.1–5.8)* | ||
| Maximum PSA (log2) | 1.4 (1.2–1.6) | 1.4 (1.3–1.6) | |||
| Previous androgen deprivation | 1.5 (1.0–2.2) | ||||
| Multivariate predictors of systemic progression |
Gleason score | 1.9 (1.4–2.5) | 1.3 (0.9–1.8) | 1.2 (1.0–1.5) | 1.2 (1.0–1.4) |
| Positive seminal vesicals | 3.3 (1.6–6.8) | 3.4 (1.6–7.1) | 1.7 (1.1–2.8) | 1.6 (1.0–2.6) | |
| Positive surgical margins | 0.8 (0.5–1.5) | 1.2 (0.6–2.3) | 0.7 (0.4–1.0) | 0.7 (0.4–1.0) | |
| Preoperative PSA (log2) | 1.1 (0.9–1.4) | 0.9 (0.7–1.2) | 1.0 (0.8–1.2) | 0.9 (0.7–1.1) | |
| Current PSA (log2) | 1.4 (0.6–3.0) | 0.8 (0.6–1.0) | 3.7 (2.7–5.1)* | ||
| Maximum PSA (log2) | 1.6 (1.3–2.0) | 1.3 (1.2–1.5) | |||
| Previous androgen deprivation | 1.3 (0.9–2.0) | ||||
For group 4, this is the HR for current PSA ≥ 0.15 ng/mL because 64% were undetectable (< 0.15 ng/mL).
ADT, androgen deprivation therapy; EBRT, external beam radiation therapy.
Table 4.
The 5-year systemic progression rates by current status group and combinations of multivariate predictors.
| Current status group |
Gleason score |
Seminal Vesicle |
Current PSA (ng/mL) |
Maximum post-RP PSA (ng/mL) |
5-year systemic progression (%)* |
|---|---|---|---|---|---|
| 1 = Undetectable PSA | 2–6 | Negative | 0.1 | ||
| 2–6 | Positive | 0.4 | |||
| 7+ | Negative | 0.9 | |||
| 7+ | Positive | 3.2 | |||
| 2 = PSA 0.15–0.4 ng/mL | 2–6 | Negative | 0.7 | ||
| 2–6 | Positive | 2.2 | |||
| 7+ | Negative | 4.1 | |||
| 7+ | Positive | 2.9 | |||
| 3 = PSA ≥ 0.4 ng/mL | 2–6 | And negative | ≤ 0.5 | 1.9 | |
| 2–6 | And negative | 0.51–0.99 | 5.1 | ||
| 2–6 | And negative | 1.00–1.99 | 5.5 | ||
| 2–6 | And negative | 2.00+ | 11.1 | ||
| 7+ | Or positive | ≤ 0.5 | 5.8 | ||
| 7+ | Or positive | 0.51–0.99 | 10.9 | ||
| 7+ | Or positive | 1.00–1.99 | 9.7 | ||
| 7+ | Or positive | 2.00+ | 20.3 | ||
| 4 = Previous ADT or EBRT | 2–6 | And negative | < 0.15 | < 1 | 1.5 |
| 2–6 | And negative | < 0.15 | 1+ | 6.9 | |
| 2–6 | And negative | ≥ 0.15 | < 1 | 7.0 | |
| 2–6 | And negative | ≥ 0.15 | 1+ | 24.1 | |
| 7+ | Or positive | < 0.15 | < 1 | 3.9 | |
| 7+ | Or positive | < 0.15 | 1+ | 8.7 | |
| 7+ | Or positive | ≥ 0.15 | < 1 | 14.7 | |
| 7+ | Or positive | ≥ 0.15 | 1+ | 31.6 |
Observed cumulative incidence based on pooled cohort using risk factors derived from the simplified Cox models.
ADT, androgen deprivation therapy; EBRT, external beam radiation therapy; RP, radical prostatectomy.
Discussion
Despite having localized PCa, almost one-third of patients undergoing RP will experience a BCR [1]. Although many of these BCRs pose no threat to longevity, some lead to metastases and require further therapy [3]. The development of metastases represents a significant step in the natural history of PCa because very few patients with metastases will survive their disease [12,13]. Although having pretreatment risk assessment tools is important, a risk calculation would be much more valuable if it was valid at any time point after RP.
In the present, study we developed a real-time risk prediction system valid at any time point after surgery. The key feature of our prediction system is that patients are first stratified into one of four clinical states based on their current PSA and treatment history: (i) PSA undetectable; (ii) PSA detectable but low (0.15–0.4 ng/mL); (iii) biochemical failure (PSA > 0.4 ng/mL); and (iv) previously receiving adjuvant/salvage androgen deprivation or radiation therapy. These clinical states are highly associated with subsequent metastases (C = 0.83). Within each clinical state, a distinct and limited set of predictors is available to further stratify patients into risk groups, albeit with somewhat less discrimination (C = 0.65–0.78). The 5-year risk of SP can be dramatically different between risk groups, in the range from < 1% to > 20%. Table 4 shows a significant overlap in the risk of systemic progression between clinical states and also shows that other variables can sharpen predictions. Although simple, the models achieve a high degree of prognostic separation, which is of clinically use when additional therapies are being considered. For example, our prediction tool could be used to predict the 5-year risk of metastases for a patient with a low-level PSA recurrence. Based on this probability, the clinician may choose to start adjuvant therapy or not. Although our tool appears to predict metastasis events accurately for patients at our institution, its performance when applied to other patient populations is not yet known and therefore external validation studies are needed. Additionally, we have not tested the ability of our tool for use as a treatment selection aid and thus we cannot comment on its ability to identify those patients who will benefit from further treatment.
The Memorial Sloan-Kettering nomograms [4,5], the University of California, San Francisco Cancer of the Prostate Risk Assessment score [8], the Center for Prostate Disease Research scores [6,9], the Mayo Clinic Gleason, PSA, seminal vesicle and margin score [7] and the D’Amico risk groupings [10] are examples of post-RP prognostic tools. These tools all take the time of RP as the time point from which predictions are made and were initially built to predict PSA recurrences, which is an endpoint that is not always clinically relevant [2,14]. An exception is the Memorial Sloan-Kettering nomogram [5], which uses the PSA recurrence-free interval, but not the actual current PSA level, to predict the 10-year (from RP) risk of PSA failure.
The principle disadvantage of our tool is that the time constancy of its construction may be confusing. However, we are confident that clinicians will appreciate the ability to render accurate predictions at any point along the timeline after RP. We limited analyses to the follow-up range of the study (overall mean follow-up was 12 years, which is equivalent to 5 years of follow-up from Epoch7) because, as current age increases, the risk of systemic progression decreases. The multivariate models should be externally validated.
In conclusion, we present a dynamic prognostic tool that assesses the probability of systemic progression after RP by incorporating the patient’s current clinical disease status. This tool is valid across postoperative time points and can therefore be used at least in the first 7 years after RP to predict outcomes occurring 5 years later.
Acknowledgements
The study was supported in part by the Mayo Clinic Prostate Cancer SPORE grant from the National Cancer Institute (CA91956-08).
Abbreviation
- BCR
biochemical recurrence
- HR
hazard ratio
- PCa
prostate cancer
- RP
radical prostatectomy
- SP
systemic progression
Footnotes
This study was presented at the American Urological Association Annual Meeting May 2007 in Anaheim (CA, USA).
References
- 1.Amling CL, Blute ML, Bergstralh EJ, Seay TM, Slezak J, Zincke H. Long-term hazard of progression after radical prostatectomy for clinically localized prostate cancer: continued risk of biochemical failure after 5 years. J Urol. 2000;164:101–105. [PubMed] [Google Scholar]
- 2.Amling CL, Bergstralh EJ, Blute ML, Slezak JM, Zincke H. Defining prostate specific antigen progression after radical prostatectomy: what is the most appropriate cut point? J Urol. 2001;165:1146–1151. [PubMed] [Google Scholar]
- 3.Stephenson AJ, Kattan MW, Eastham JA, et al. Defining biochemical recurrence of prostate cancer after radical prostatectomy: a proposal for a standardized definition. J Clin Oncol. 2006;24:3973–3978. doi: 10.1200/JCO.2005.04.0756. [DOI] [PubMed] [Google Scholar]
- 4.Kattan MW, Wheeler TM, Scardino PT. Postoperative nomogram for disease recurrence after radical prostatectomy for prostate cancer. J Clin Oncol. 1999;17:1499–1507. doi: 10.1200/JCO.1999.17.5.1499. [DOI] [PubMed] [Google Scholar]
- 5.Stephenson AJ, Scardino PT, Eastham JA, et al. Postoperative nomogram predicting the 10-year probability of prostate cancer recurrence after radical prostatectomy. J Clin Oncol. 2005;23:7005–7012. doi: 10.1200/JCO.2005.01.867. [DOI] [PMC free article] [PubMed] [Google Scholar]
- 6.Bauer JJ, Connelly RR, Seterhenn IA, et al. Biostatistical modeling using traditional preoperative and pathological prognostic variables in the selection of men at high risk for disease recurrence after radical prostatectomy for prostate cancer. J Urol. 1998;159:929–933. [PubMed] [Google Scholar]
- 7.Blute ML, Bergstralh EJ, Iocca A, Scherer B, Zincke H. Use of Gleason score, prostate specific antigen, seminal vesicle and margin status to predict biochemical failure after radical prostatectomy. J Urol. 2001;165:119–125. doi: 10.1097/00005392-200101000-00030. [DOI] [PubMed] [Google Scholar]
- 8.Cooperberg MR, Pasta DJ, Elkin EP, et al. The University of California, San Francisco Cancer of the Prostate Risk Assessment score: a straightforward and reliable preoperative predictor of disease recurrence after radical prostatectomy. J Urol. 2005;173:1938–1942. doi: 10.1097/01.ju.0000158155.33890.e7. [DOI] [PMC free article] [PubMed] [Google Scholar]
- 9.Moul JW, Connelly RR, Lubeck DP, et al. Predicting risk of prostate specific antigen recurrence after radical prostatectomy with the Center for Prostate Disease Research and Cancer of the Prostate Strategic Urologic Research Endeavor databases. J Urol. 2001;166:1322–1327. [PubMed] [Google Scholar]
- 10.D'Amico AV, Whittington R, Malkowicz SB, et al. A multivariate analysis of clinical and pathological factors that predict for prostate specific antigen failure after radical prostatectomy for prostate cancer. J Urol. 1995;154:131–138. [PubMed] [Google Scholar]
- 11.Kalbfleisch JD, Prentice RS. The Statistical Analysis of Failure Time Data. 2nd edn. Hoboken, NJ: John Wiley & Sons; 2002. [Google Scholar]
- 12.Tannock IF, de Wit R, Berry WR, et al. Docetaxel plus prednisone or mitoxantrone plus prednisone for advanced prostate cancer. N Engl J Med. 2004;351:1502–1512. doi: 10.1056/NEJMoa040720. [DOI] [PubMed] [Google Scholar]
- 13.Eisenberger MA, Blumenstein BA, Crawford ED, et al. Bilateral orchiectomy with or without flutamide for metastatic prostate cancer. N Engl J Med. 1998;339:1036–1042. doi: 10.1056/NEJM199810083391504. [DOI] [PubMed] [Google Scholar]
- 14.Collette L. Prostate-specific antigen (PSA) as a surrogate end point for survival in prostate cancer clinical trials. Eur Urol. 2008;53:6–9. doi: 10.1016/j.eururo.2007.08.041. [DOI] [PubMed] [Google Scholar]