Abstract
This study describes cocultures of arterial smooth muscle cells (SMC) and endothelial cells (EC) and the influences of their heterotypic interactions on hydraulic conductivity (Lp), an important transport property. A unique feature of these cocultures is that ECs were first grown to confluence and then SMCs were inoculated. Bovine aortic smooth muscle cells (BASMCs) and bovine aortic endothelial cells (BAECs) were cocultured on Transwell Permeable Supports, and then exposed to a pressure-driven transmural flow. Lp across each culture was measured using a bubble tracking apparatus that determined water flux (Jv). Our results indicate that arterial Lp is significantly modulated by EC-SMC proximity, and serum content in culture. The Lp of cocultures was also compared to the predictions of a resistances-in-series model to distinguish the contributions of heterotypic interactions between SMCs and ECs. Conditions that lead to significantly reduced coculture Lp, compared to BAEC monoculture controls, have been uncovered and the lowest Lp in the literature for an in-vitro system are reported. In addition, VE-cadherin immunostaining of intact BAEC monolayers in each culture configuration reveals that EC-SMC proximity on a porous membrane has a dramatic influence on EC morphology patterns. The cocultures with the lowest Lp have ECs with significantly elongated morphology. Confocal imaging indicates that there are no direct EC-SMC contacts in coculture.
Keywords: Endothelial Cells, Smooth Muscle Cells, Porous Membrane, Coculture, Hydraulic Conductivity
Introduction
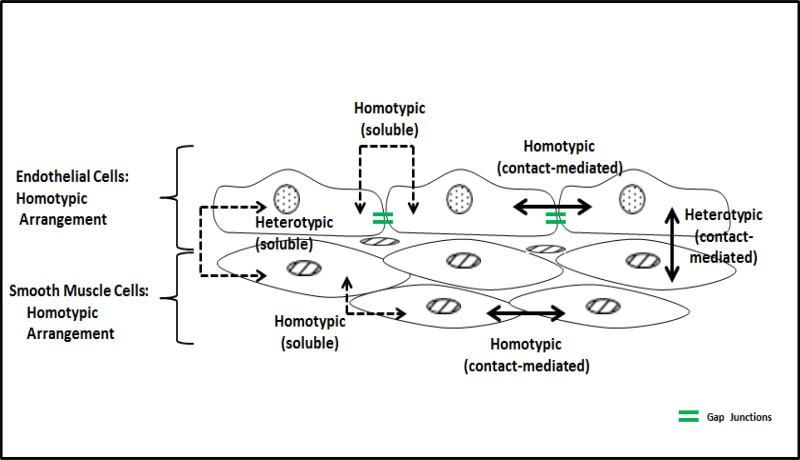
Tissues allow for both homotypic and heterotypic cellular interactions and, depending on the proximity of cells, communication may occur through soluble and contact-mediated pathways (Figure 1). Local mechanical and chemical signaling mechanisms are essential for maintaining a tissue's structure and function. Intimal endothelial cells (ECs) and medial smooth muscle cells (SMCs) are neighboring cells in the arterial wall. Their homotypic interactions include contact-inhibited endothelial growth21, gap junction communication17,21 and smooth muscle contraction in response to stretch14,29, while smooth muscle relaxation induced by endothelial nitric oxide is a classic heterotypic interaction34. This study examines, for the first time, whether heterotypic interactions of arterial ECs and SMCs influence arterial wall transport properties, specifically hydraulic conductivity (Lp). We focus on co-cultures where the ECs are plated first, followed by the SMCs.
Figure 1.
Homotypic and heterotypic arrangements of BAECs and BASMCs showing combinations of soluble (dashed arrows) and contact-mediated (continuous arrows) signal pathways for cell interactions. Double-sided arrows indicate that cell signaling is also bidirectional.
In-vivo, the order in which ECs and SMCs are established in the vessel wall, and the proximity between ECs and SMCs, varies with the events that are taking place in the localized region of the vasculature. For example, during arteriogenesis, a heterotypic tissue structure develops as SMCs are recruited to form a dense sub-endothelial medial region near a preexisting intact endothelium 4,9,41,47. In healthy arterial walls, the porous internal elastic lamina lies between the intimal endothelium and a relatively dense medial region of SMCs20. Endothelial cells and SMCs can then establish direct heterotypic contacts through the pores of the internal elastic lamina (IEL)12,22,40. In the present co-culture study we use a porous membrane separating ECs and SMCs to simulate the IEL.
Previous work with coculture systems11,18 has clearly demonstrated that ECs can influence SMC function. Coculturing bovine aortic endothelial cells (BAECs) and bovine aortic smooth muscle cells (BASMCs) on opposing sides of a porous membrane (bilayer coculture), as well as through shared media alone (conditioned-media coculture), was shown18 to cause significant changes in SMC proliferation rates, density, transmembrane projections, and protein synthesis compared to SMC monocultures.
Bilayer coculturing of ECs and SMCs, with a laminar fluid shear stress apparatus, also elicited changes in EC gene expression8. Endothelial cell gene expression for adhesion molecules was inhibited when the coculture flow apparatus was used to expose ECs to laminar fluid shear stress. In static (no-flow) conditions, however, SMCs induced EC gene expression for adhesion molecules and lowered EC gene expression for nitric oxide synthase. Incorporating a porous membrane interface between ECs and SMCs in both static and laminar fluid shear stressed conditions was essential to induce those changes in ECs.
Varying both serum content and culture time in bilayer cocultures and monocultures were also shown to cause changes in human aortic SMC cytokine secretions39. Cytokine secretions from cocultured SMCs were found to be significantly different from monocultured SMCs when supplied with higher fetal bovine serum concentrations and cultured for longer periods of time. Those findings illustrated that serum supplemented and time-dependent arterial coculturing methods stimulate heterotypic activities. Also, in directly cocultured porcine arterial ECs and SMCs (without an intervening porous membrane), proximity, serum content, and culture time were all demonstrated to be precursors in the chain of events regulating indicators of thrombogenicity33.
There has been only one previous study of transport in arterial-like coculture models. In porous bilayer cocultures of human umbilical vein ECs and murine smooth muscle-like 10T ½ cells, the diffusive permeability of 70 kDa biotin-dextran was shown to be lower when compared to monoculture controls of ECs and 10T ½ cells26. Similar coculture constructs pairing brain ECs and astrocytes have been exploited in blood-brain barrier transport measurements28. To date, however, it is unclear how arterial EC-SMC coculture configurations may influence arterial transport.
Hydraulic conductivity of BAECs grown on Transwell Permeable Supports and supplied with 10% fetal bovine serum in culture media has been measured in previous studies5,7,13,15,24,45 conducted in our laboratory, and there has been a quantitative consistency in these measurements over the last 20 years44. The present study determines Lp for various monoculture and coculture configurations of BAECs and BASMCs. Our results identify that the proximity of BASMCs to BAECs on the porous membrane, along with serum content in monocultures and cocultures, modulates arterial Lp. Arterial cocultures that mimic the arrangement of ECs and SMCs in a healthy arterial wall feature an intact monolayer of ECs with an elongated morphology pattern, and lead to the lowest Lp values reported for an in-vitro arterial model.
Materials and Methods
Materials
Transwell polyester permeable supports were purchased from Corning, Inc., NY. These membranes are characterized by a pore diameter of 0.4 μm, pore densityof 4.0e6 pores/cm2, and membrane thickness of 10 μm. T-75 Tissue Culture Flasks were purchased from Becton Dickinson, NJ. A T-25 Flask of primary BAECs was purchased form VEC Technologies, Inc, NY. A cryopreserved ampule of primary BASMCs was purchased from Cell Applications, Inc., CA. Fibronectin (FN) 0.1% from bovine plasma; Triton X-100; Trypsin-EDTA; Penicillin Streptomycin (PS); 200mM L-Glutamine (LG); 30% Albumin solution from Bovine Serum (BSA); and Phenol Red Minimum Essential Medium (MEM) were purchased from Sigma-Aldrich, Inc., MO. Fetal Bovine Serum (FBS) Defined and Paraformaldehyde (PFA) were purchased from Thermo Fischer Scientific, Inc. Phenol Red Free Minimum Essential Medium (PRF-MEM) and Calcium and Magnesium Free Phosphate Buffered Saline (CMF-PBS) were purchased from Mediatech, Inc., VA. VE-Cadherin Primary Antibody (PAb), and Anti-rabbit IgG (H+L), F(ab’)2 Fragment (Alexa Fluor 488 Conjugate) Secondary Antibody (SAb) were purchased from Cell Signaling Technology Inc. MA.
Defined Cell Culture Media
Serum-free MEM (SF-MEM) consisted of MEM with 1% LG, and 1% PS. 10% FBS MEM (10FB-MEM) consisted of MEM with 10% FBS, 1% LG, and 1% PS. 2.5% FBS MEM (2.5FB-MEM) was made by combining 1 part 10FB-MEM with 3 parts SF-MEM. 10FB-MEM was used for flask cultures and both 10 and 2.5FB-MEM were used for Transwell cultures. Experimental MEM (E-MEM) consisted of PRF-MEM with 1 % BSA, 1% LG, and 1% PS, and was used when calculating Lp. We used the lower serum concentration of 2.5% to suppress heterotypic interactions between cell types as observed in a previous study 38. We used 10% serum in most of our previous studies of endothelial Lp 5,7,13.
Cell Culture in Flasks
A primary BAEC culture was expanded up to passage 2 subcultures in T-75 tissue culture flasks and then cryopreserved in 1 mL cryovials at a concentration of 1.0e6 cells/mL. A primary BASMC culture was expanded to passage 3 subcultures in T-75 tissue culture flasks and then cryopreserved in 1 mL cryovials at a concentration of 7.5e5 cells/mL.
Cryopreserved vials of either passage 2 primary BAEC cultures or passage 3 primary BASMC cultures were thawed for 2 minutes in a 37°C waterbath and the cell suspensions were transferred to separate sterile T-75 tissue culture flasks with 14 mL of 10FB-MEM and incubated for 30 minutes. That media was then aspirated and replaced with 15 mL of 10FB-MEM and the cultures were incubated until grown to be 80% confluent. Each culture was then passed with cell suspensions being split equally into three new sterile tissue culture flasks and grown in 10FB-MEM until 80% confluent. BAEC and BASMC cultures were each passed three times and finally passage 5 BAECs and passage 6 BASMCs were inoculated on Transwell inserts or companion wells in specific monoculture and coculture arrangements and supplied with 10FB-MEM or 2.5FB-MEM.
Cell Culture with Transwell Permeable Supports
Transwell insert membranes
Transwell inserts containing a 10 μm thick polyester (PET) membrane with a total growth area of 1.12 cm2 were used. While the PET membrane is almost 10X thicker than a normal internal elastic lamina1, the 0.4 μm diameter membrane pores and membrane pore density of 4.0e6 pores/cm2 fall within the normal ranges found in internal elastic lamina41. Prior to seeding cells on either the apical or basal side of the membrane, 224 μL of FN diluted to 30 μg/mL with MEM was pipetted on the appropriate region. FN-coated Transwell inserts in companion plates were incubated for 2 hours and then excess FN was removed.
Cell culture media for Transwell Permeable Supports
To culture cells with 10FB-MEM, 1.5 mL and 0.5 mL of that media were placed in the companion well and Transwell insert, respectively. To culture cells with 2.5FB-MEM, 1.5 mL of SF-MEM was placed in the companion well and 0.5 mL of 10FB-MEM was placed in the Transwell insert.
BAEC and BASMC plating densities, locations, and culture times
BAEC and BASMC cultures were inoculated with a 1:1 plating density ratio of 1.25e5 cells/cm2. BAECs in monoculture and coculture were always the most apical culture on the Transwell membrane. BASMCs in monoculture or coculture were either inoculated on the basal side of the Transwell membrane or on the bottom surface of the companion well. The total BAEC culture time in all monoculture and coculture arrangements was 5 days, and the total BASMC culture time in all culture arrangements was 2 days.
Monoculture and coculture notations
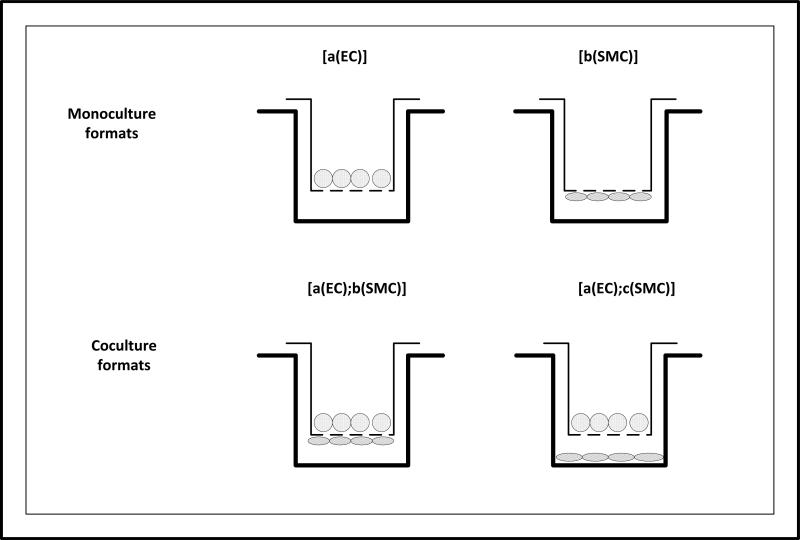
The apical and basal locations of the Transwell membrane will be denoted as (a) and (b), respectively, and the bottom surface of the companion well is denoted as (c). BAEC and BASMC culture inoculums are abbreviated as (EC) and (SMC), respectively. Monoculture formats are described by [Location (Inoculum)]. Coculture formats are described by [Location (First Inoculum); Location (Second Inoculum)]. These monoculture and coculture notations are presented in Figure 2.
Figure 2.
Schematic of BAEC and BASMC monoculture and coculture formats on Transwell membranes and companion wells. The horizontal dashed line indicates the location of the porous Transwell membrane. The black band indicates the location of BAEC cultures. The grey band indicates the location of BASMC cultures. Monoculture formats include [a(EC)], and [b(SMC)]. Coculture formats include [a(EC);b(SMC)], and [a(EC);c(SMC)].
EC and SMC monocultures and cocultures
[a(EC)] monocultures
An EC culture was inoculated on the apical side of a Transwell membrane that was pre-coated with FN. The culture was supplied with either 10FB-MEM or 2.5FB-MEM and incubated for 5 days.
[b(SMC)] monocultures
An SMC culture was inoculated on the basal side of an FN-coated membrane while the insert was inverted. The inverted insert was incubated for 30 minutes while SMCs settled and attached to the membrane. The insert with basal SMC culture was then placed upright, supplied with either 10FB-MEM or 2.5FB-MEM, and incubated for 2 days.
EC-SMC cocultures
i) [a(EC);b(SMC)] membrane coculture
An EC culture was inoculated on the apical side of an FN-coated membrane, supplied with either 10FB-MEM or 2.5FB-MEM, and incubated for 3 days. The insert was then inverted and an SMC culture was inoculated on the basal side of the membrane, which was pre-coated with FN. The inverted insert was incubated for 30 minutes to allow for SMC settling and attachment to the membrane. The membrane coculture was then placed upright, supplied with either 10FB-MEM or 2.5FB-MEM, respectively, and incubated for 2 days.
ii) [a(EC);c(SMC)] shared media coculture
An EC culture was inoculated on the apical side of an FN-coated membrane, supplied with either 10FB-MEM or 2.5FB-MEM, and incubated for 3 days. An SMC culture was then inoculated in a separate companion well and allowed to settle and attach to this surface during a 30 minute incubation period. The insert with the EC culture was then paired with the companion well containing the SMC culture. The coculture was supplied with either 10FB-MEM or 2.5FB-MEM, respectively, and incubated for 2 days. These cocultures were dissociated on day 5 to measure endothelial Lp.
Calculating Lp of Transwell cultures
Fluid flux (Jv) across Transwell insert cultures was measured in pairs with a bubble tracking apparatus and those measurements were then used to calculate Lp. Both the bubble tracking apparatus and the equations for calculating Lp have been previously described10 and are briefly explained here. Following the prescribed monoculture and coculture times, the Transwell insert was transferred to the bubble tracking apparatus. E-MEM was added above and below the Transwell insert to eliminate the development of an osmotic pressure gradient. The Lp was calculated by Equation 1 with ΔP = 10 cmH2O. Each measurement was repeated 6 times.
| (Eqn. 1) |
Monoculture resistances-in-series models of coculture Lp
Hydraulic conductivity measurements for EC and SMC monocultures were combined to provide a resistances-in-series model of the coculture systems that was compared with coculture Lp measurements. Deviations between model and experimental values of Lp could be attributed to heterotypic interactions. Monoculture Lp values were first inverted to represent hydraulic resistances (Equations 2 and 3),which were then summed up in series (Equation 4). Note that since the PET membrane was included as a substrate in each monoculture, its hydraulic resistance (R[PET]) was duplicated during series summation. Therefore, a value for the hydraulic resistance of one porous membrane, R[PET] = 1.196e4 cmH2O/cm/s (Lp[PET] = 8.361e-5 cm/s/cmH2O), was subtracted from the combination of monoculture resistances in order to account for the single PET membrane present in the actual coculture.
| (Eqn. 2) |
| (Eqn. 3) |
| (Eqn. 4) |
Immunofluorescence
Immunofluorescence solutions
Paraformaldehyde fixative was diluted with CMF-PBS to 1% PFA and filtered through a 0.45 μm syringe filter on the day of use. Triton X-100 was diluted with CMF-PBS to a 0.2% Triton X-100 permeabilizing solution. Blocking buffer consisted of BSA and Triton X-100 diluted in CMF-PBS to 10% BSA and 0.1% Triton X-100. Primary antibody (PAb) was diluted 15:1000 in blocking buffer. Secondary antibody (SAb) was diluted 2:1000 in blocking buffer.
Immunofluorescence of VE-cadherin in Transwell cultures
CMF-PBS was immediately removed after being added for each rinse. All solutions were added to the insert first and then, when required, to the companion well. Vacuum aspirations were performed without touching the membrane. The volume of CMF-PBS for each rinse was 0.5 mL/insert and 1 mL/companion well. All steps were carried out at room temperature (RT) and in a laminar flow hood.
First, remaining cell culture media was aspirated. The culture was quickly rinsed once and, immediately, 0.5 mL of fixative was added to the apical side of the insert. Fixative was removed after 10 minutes; the culture was rinsed once and 0.5 mL of permeabilizing solution was added to the apical side of the insert and left for 10 minutes. The culture was rinsed once and 0.5 mL of blocking buffer was added to the apical side of the insert and left for 60 minutes. After one rinse, 200 μL of diluted PAb was added the apical side of the insert and incubated at RT for 3 hours. The PAb was removed and the culture was rinsed five times.
Then, in a dark environment, 200 μL of diluted SAb was added to the apical side of the insert and incubated at RT for 60 minutes, followed by removal of SAb and four rinses. 0.5 mL of rinse solution was added to the apical side of the insert that was transferred to a clean glass slide set on a Nikon TE 2000 microscope stage equipped with epi-fluorescence and MetaVue Imaging Software (Universal Imaging Corp. PA). The culture was imaged in the center field and then in four peripheral fields with a 10x objective. Five more similar fields were imaged with a 20x objective.
Cell Tracker Green Staining and Confocal Imaging
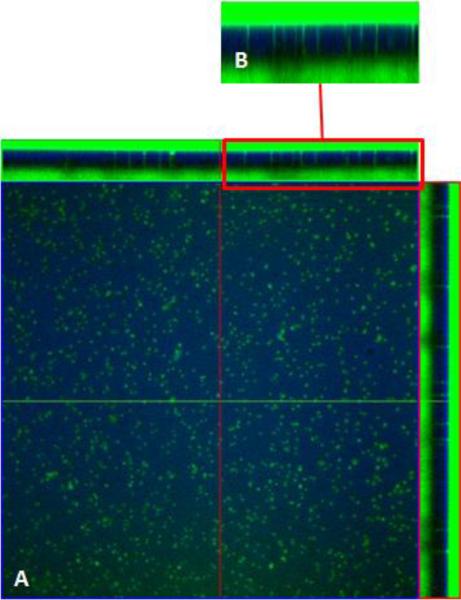
Co-cultured BAECs and SMCs were briefly washed with PRF serum-free medium. The Transwell inserts were then inverted and the SMCs were incubated in PRF serum free media containing 5μM of Celltracker green for 15 min. The excess media was first aspirated , before incubating the BAECs for 15 minutes with cell tracker green. The co-cultured cells were quickly washed with PBS before incubation in growth media containing 10 % FBS, 1% penicillin and streptomycin for 30 min at 37°C. After incubation the inserts were flushed for 15 minutes (3x, 5 min each) by adding 1ml and .5ml of PBS to the apical and basal side of the inserts respectively, to remove any free dye from the filter pores. They were then fixed in 3.7% fixative for 10 minutes. The cultures were washed twice, and mounted on glass coverslips for imaging. Positive controls were prepared using blank filters incubated with Celltracker green and fixed as indicated above. Confocal z-stacks of the cell tracker green stained co-cultures were obtained on a LSM 510 or LSM 710 confocal laser scanning system, using the Plan-Neofluar 40×/1.3 Oil DIC objective and analyzed using the Zeiss LSM software.
Morphometric Analysis
EC shape factors
The shape factors of ECs in VE-cadherin immunostained monocultures and cocultures were calculated using the MetaVue software. Briefly, a trace region tool was used to outline individual ECs. MetaVue's Region Statistics of the outline generated calibrated pixel areas and perimeters for each cell. The shape factors for ECs were then calculated with the formula (4π*area)/(perimeter)2, where values ranged between zero and one; a value of one is a perfect circle and a value near zero is a flattened or elongated object.
Statistical analysis
Hydraulic conductivity measurements and shape factors are presented as the mean +/− the standard error of the mean (SEM). Each coculture experiment was normalized against its paired EC monoculture experiment to account for the variations in Lp from plate to plate of the cultures. When comaparing normalized coculture experiments to controls (EC monocultures) a one sample t-test on the null hypothesis was performed , i.e. we tested whether the average normalized values were different from 1. This approach has been used in other studies 37,42. A two sample t-test was performed when comparisons were made between different coculture formats . Comparisons were considered statistically significant if p < 0.05. Where multiple comparisons were made the bonferroni correction was used.
Results
EC and SMC monoculture Lp
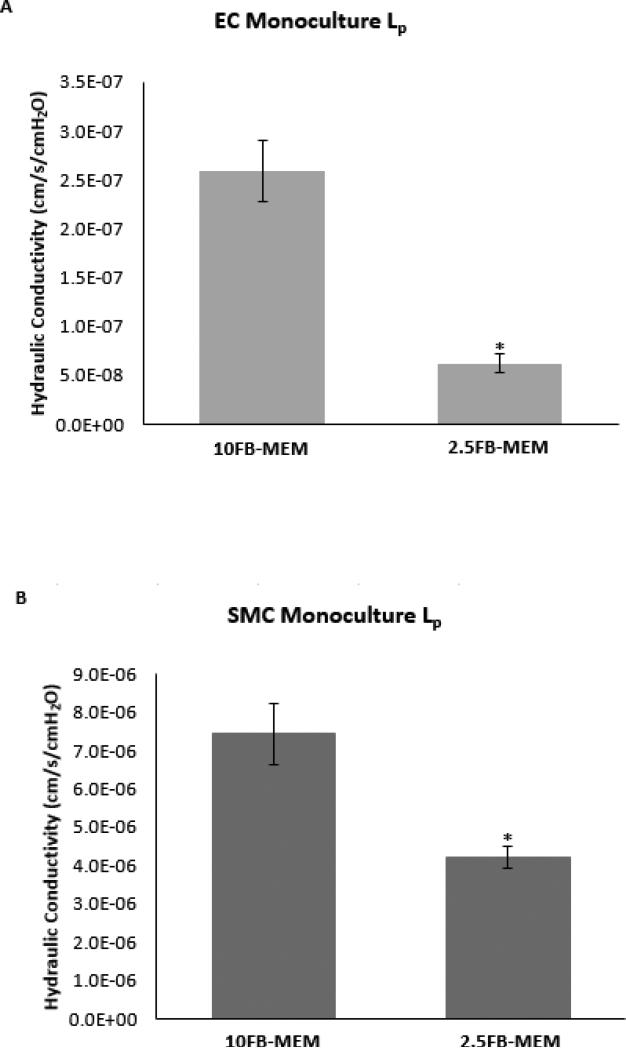
Note that all of the Lp values reported for monocultures and cocultures include the PET membrane. The Lp measurements of [a(EC)] monocultures grown in 10FB-MEM were paired with Lp measurements of [a(EC)] monocultures grown in 2.5FB-MEM and are presented in Figure 3A. [a(EC)] monocultures grown in 2.5FB-MEM had a significantly lower Lp than monocultures grown in 10FB-MEM. The Lp measurements of [b(SMC)] monocultures grown in10FB-MEM were paired with the Lp measurements of [b(SMC)] monocultures grown in 2.5FB-MEM and are presented in (Figure 3B), respectively. These measurements show that [b(SMC)] monoculture Lp was significantly lower when grown in 2.5FB-MEM. Note that [b(SMC)] Lp was more than 10 fold higher than [a(EC)] Lp.
Figure 3.
Hydraulic conductivity of 5 day apical EC ([a(EC)]) (A) and 2 day basal SMC ([b(SMC)]) (B). Monocultures were supplied with 10FB-MEM or 2.5FB-MEM. Data are presented as mean +/− SEM. * - p < 0.05 compared to 10FB-MEM; n = 6. (B): Data are presented as mean +/− SEM. * - p < 0.05 compared to 10FB-MEM; n = 6.
EC-SMC coculture Lp
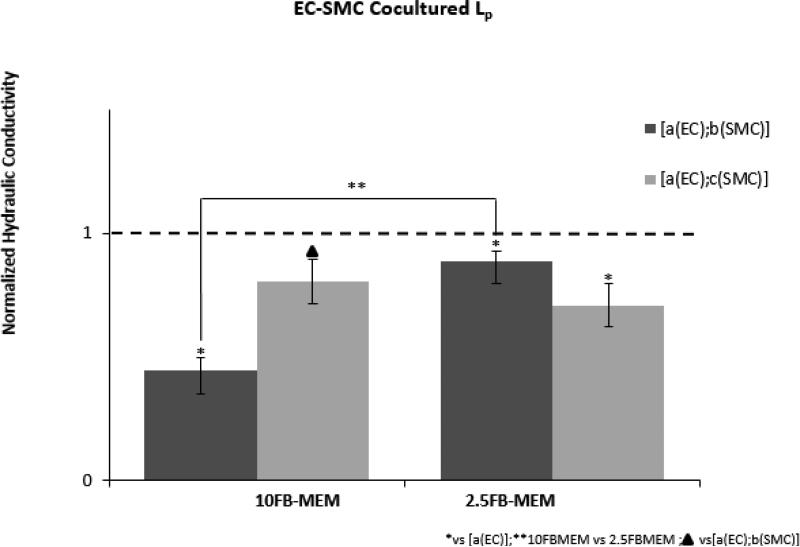
The Lp measurements of each coculture grown in either 10FB-MEM or 2.5FB-MEM were paired with the corresponding Lp measurements of [a(EC)] monocultures. The Lp of each coculture was normalized to the paired Lp of the monoculture. The normalized mean Lp values of cocultures grown in 10FB-MEM or 2.5FB-MEM are presented in (Figure 4). For cocultures grown in 10FB-MEM, Lp of [a(EC);b(SMC)] was significantly lower than either [a(EC)] Lp and [a(EC);c(SMC)] Lp. In addition, Lp of [a(EC);b(SMC)] grown in 10FB-MEM was significantly lower than the same coculture format grown in 2.5FB-MEM. Both coculture formats grown in 2.5FB-MEM had Lp values that were significantly lower than [a(EC)] Lp, but not significantly different from each other.
Figure 4.
Hydraulic conductivity of each coculture [a(EC);b(SMC)] and [a(EC);c(SMC)] normalized to the mean Lp of paired endothelial monocultures [a(EC)]. Each culture format was supplied with 2.5FB-MEM and 10FM-MEM . Statistical significance (p < 0.05) of coculture Lp normalized to paired endothelial Lp was denoted (* vs [a(EC)]). (**10FB-MEM vs 2.5FB-MEM[a(EC);b(SMC)]). (▲ vs [a(EC);b(SMC)]). All experiments were n = 6.
Monoculture resistances-in-series models of coculture Lp
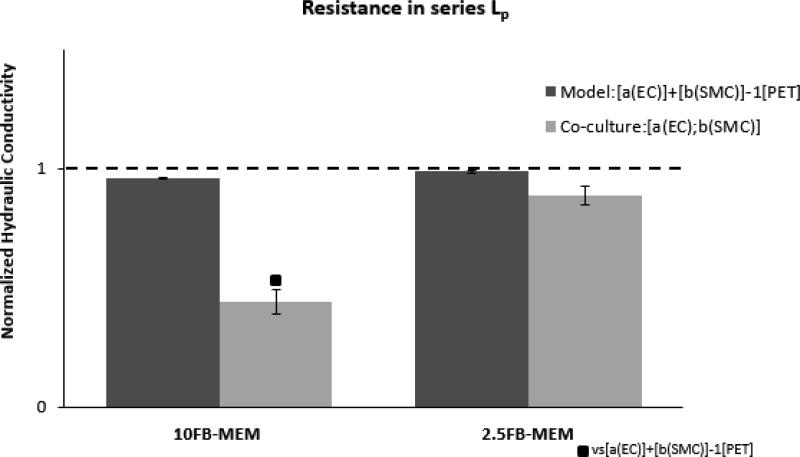
Resistances-in-series models of coculture Lp (Equation 4) representative of each membrane coculture configuration were normalized to paired endothelial monoculture Lp. The resistances-in-series Lp values were plotted next to the Lp measurements of the cocultures for both10FB-MEM and 2.5 FB-MEM (Figure 5) in order to distinguish heterotypic interactions in the cocultures. Resistances-in-series Lp was significantly higher than the [a(EC);b(SMC)] coculture Lp for 10FB-MEM, but resistances-in-series Lp was not significantly different from coculture Lp for 2.5FB-MEM.
Figure 5.
Hydraulic conductivity of membrane coculture [a(EC);b(SMC)], and resistances-in-series model predictions [a(EC)] + [b(SMC)] normalized to the mean Lp of paired endothelial monocultures [a(EC)]. Each culture was supplied with 10FB-MEM or 2.5FB-MEM. Statistical significance (p < 0.05) of membrane coculture Lp compared to resistances-in-series Lp was denoted by (■ vs [a(EC)] + [b(SMC)]). All experiments were n = 6.
Immunostaining of VE-cadherin
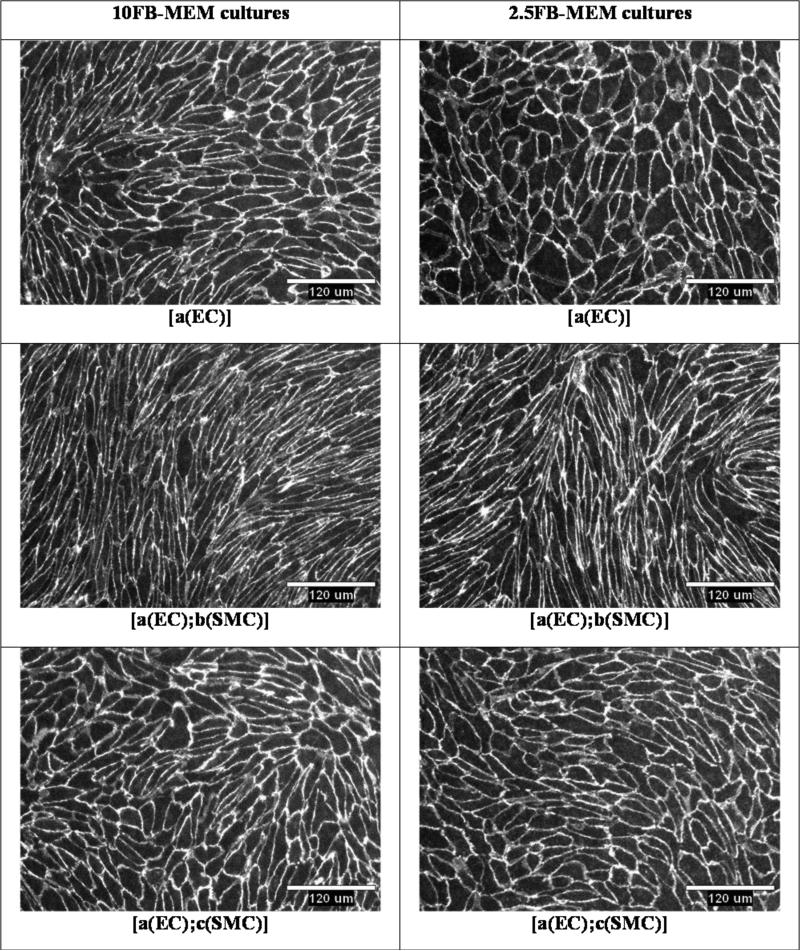
Endothelial cell VE-cadherin was immunostained for each coculture and EC monoculture. Center field 10x objective images for each coculture and EC monoculture grown in 10FB-MEM or 2.5FB-MEM are presented in Figure 6. VE-cadherin was highly expressed in each culture format and was localized at the cell border as expected. Endothelial cells imaged in coculture [a(EC);b(SMC)] appeared more elongated when compared to any of the other cultures.
Figure 6.
Representative images of VE-cadherin immunostaining in EC monocultures and cocultures supplied with either 10FB-MEM or 2.5FB-MEM. 10x objective. Scale bar 120 um.
Analysis of EC and SMC processes across PET membrane
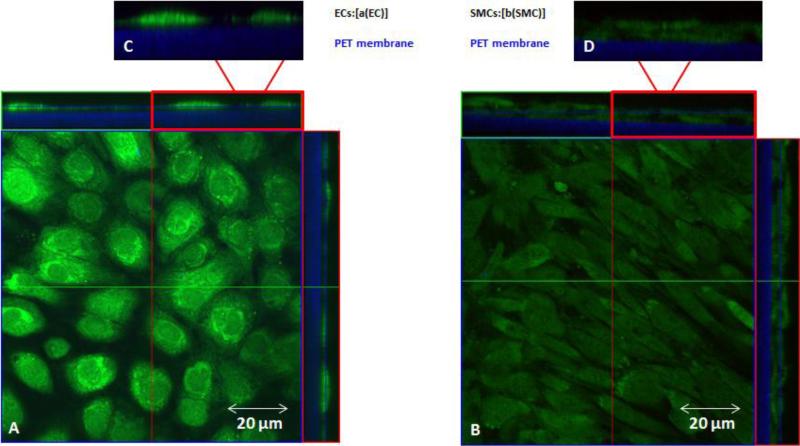
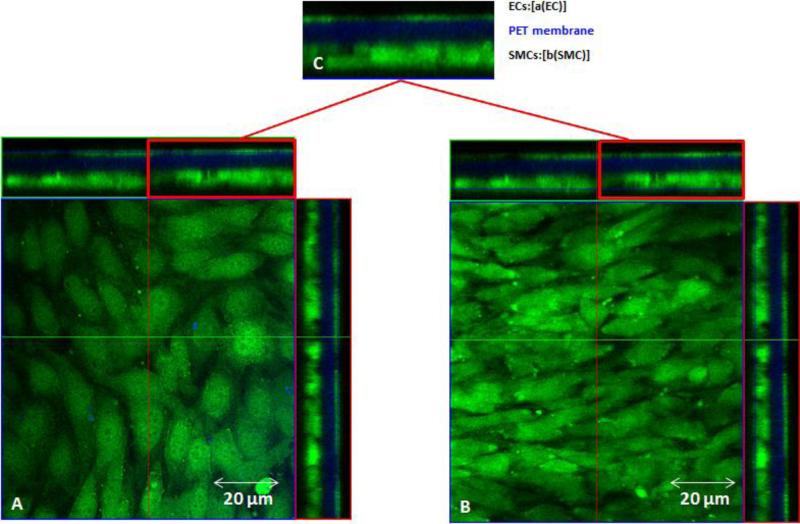
ECs and SMCs were stained with cell tracker green for monocultures and EC/SMC cocultures grown in 10FB-MEM. Cell tracker green staining of 10FB-MEM BAEC and BASMC monocultures (Figure 7) and cocultures (Figure 8), showed no evidence of processes extending across the membrane from ECs or SMCs in any of the formats. See Figure 9 for the positive control.
Figure 7.
Confocal images of cell tracker green localization in BAEC and BASMC monocultures grown in 10FB-MEM on PET membrane. The central portion of each panel is an en face view of the BAEC A, (left panel) and BASMCs ,B (right panel), shown from the Z-axis ,C-D (top,left and right) are cross sectional views in the Z-plane of each panel, and the PET membrane (blue). Note that there is no Celltracker green in the membrane region.
Figure 8.
Confocal images of cell tracker green localization in BAEC and BASMC cocultures (green) grown in 10FB-MEM on PET membrane (blue). The central portion of each panel is an en face view of the BAEC s , A (left panel) and BASMCs ,B ( right panel), shown from the Z-axis, C(top)is a cross sectional view in the Z-plane of each panel; BAECs on the apical side and BASMCs on the basal side (green) of the PET membrane (blue). Note that there is no Celltracker green in the membrane region.
Figure 9.
Celltracker green was incubated on blank PET membranes as a positive control. Confocal images of cell tracker green localization on blank PET membrane (blue). The central portion of the panel is an en face view of the PET filter ,A, shown from the Z-axis, B(top)is a cross sectional view in the Z-plane of each panel; Celltracker green on the apical and basal side (green) of the PET membrane (blue). Note that pores are filled with Celltracker green.
EC morphometry
The sample mean, standard deviation (SD), and SEM for random samples of 10 EC shape factors from each culture format are presented in Table 1. The mean shape factor for ECs in the [a(EC);b(SMC)] coculture was much closer to zero, compared to any other culture, indicating that these ECs were the most elongated. In addition, the EC shape factors in that coculture were significantly lower in comparison to shape factors for ECs in the 10FB-MEM [a(EC)] monoculture.
Table 1.
Sample means, SDs, and SEMs for EC shape factors (n = 10) for each culture format.
| Culture Format | ||||||
|---|---|---|---|---|---|---|
| [a(EC)] | [a(EC);b(SMC)] | [a(EC);c(SMC)] | ||||
| Media(MEM) | 10FB | 2.5FB | 10FB | 2.5FB | 10FB | 2.5FB |
| Sample mean (n=10) | 0.5291 | 0.5865 | 0.2378* | 0.2497* | 0.5574 | 0.5450 |
| Sample SD (+/−) | 0.0847 | 0.1179 | 0.0547 | 0.0472 | 0.1333 | 0.1399 |
| Sample SEM (+/−) | 0.0268 | 0.0373 | 0.0173 | 0.0149 | 0.0422 | 0.0442 |
p < 0.05 compared to [a(EC)] 10FB-MEM; n = 10.
Discussion
Serum concentration modulates EC Lp
The influence of serum concentration on EC Lp response was determined by first growing EC monocultures in either 2.5FB-MEM or 10FB-MEM for 5 days and then measuring Lp. Hydraulic conductivity of [a(EC)] in 2.5FB-MEM was significantly lower than the Lp of [a(EC)] in 10FB-MEM (Figure 3A) by a factor of 4. It is known that serum (protein) – free media increases permeability/hydraulic conductivity 36, and that some protein/serum is needed to maintain barrier function 2,27,30. However, above a certain minimum level of serum, low serum levels result in decreased EC motility and turnover that are associated with lower permeability/hydraulic conductivity, 6,16. It has also been shown in other studies that factors in serum weaken the intercellular junctions of endothelial and epithelial cells 10,32 and these factors may also play a part in the increased Lp at higher serum concentration.
Hydraulic conductivity of [b(SMC)] grown in 2.5FB-MEM was found to be significantly lower than [b(SMC)] grown in 10FB-MEM (Figure 3B), but still 1-2 orders of magnitude higher than Lp of [a(EC)]. To our knowledge, this is the first study to describe the serum effect on Lp.
Arterial cocultures exhibit a range of Lp
In healthy arteries, the intimal and medial regions, which consist of an endothelial monolayer and dense multilayered SMCs, respectively, share the same porous internal elastic lamina20. Our coculture [a(EC);b(SMC)] best mimics this organization. The total culture time of ECs in monocultures and cocultures was 5 days, and the total culture time of SMCs in monocultures and cocultures was 2 days. Using the 10 μm thick porous membrane to separate ECs and SMCs in the [a(EC);b(SMC)] coculture (Figure 2) brings both cell types into close proximity, compared to the [a(EC);c(SMC)] coculture, which distances ECs from SMCs by a 1 mm layer of media (Figure 2) ensuring only soluble component interaction. Pairwise comparisons of coculture Lp normalized to paired [a(EC)] Lp (Figure 4, left and right) reveal that the [a(EC);b(SMC)] Lp was significantly lower than [a(EC)] Lp for both the 10FB-MEM and 2.5FB-MEM cases. The Lp value of 5.507e-8 +/− 4.080e-10 cm/s/cmH2O for the 2.5FB-MEM [a(EC);b(SMC)] coculture (Figure 4, right), which included the porous membrane, is the lowest value reported in the literature for an in-vitro model. This value is also the same order of magnitude as Lp in intact arteries19,38,46.
A lower [a(EC);b(SMC)] Lp, compared to [a(EC)] Lp, suggests that directing vascular SMCs to form a medial region in the presence of an existing endothelial monolayer, as in arteriogenesis, is one of the localized approaches to improving arterial wall barrier function. The significant differences in arterial coculture Lp, compared to EC monocultures, also suggests their potential application in generating unique tissue-engineered blood vessels that have physiological transport barrier properties.
Coculturing in shared media influences EC Lp
Coculture configuration [a(EC);c(SMC)] differs from in-vivo vascular wall anatomy and restricts heterotypic interactions to those mediated by soluble components. In 2.5FB-MEM, ECs that were cultured in shared media had a significantly reduced Lp compared to EC monocultures (Figure 4, right). That trend was preserved in 10FB-MEM shared media cultures although statistical significance was not achieved (Figure 4, left). Also, the Lp of ECs derived from shared media cocultures was significantly higher in comparison to the porous membrane interface coculture, [a(EC);b(SMC)], in 10FB-MEM conditions (Figure 4, left). However, this trend was not preserved in low serum concentrations (Figure 4, right ) where there was no significant difference. The significant changes in endothelial Lp resulting from shared media coculturing methods indicate that heterotypic soluble interactions and serum concentration regulate Lp.
Comparison of coculture to monoculture resistances-in-series modeled Lp
Resistances-in-series modeled Lp values were derived from series combinations of monoculture hydraulic resistances, and were nearly identical to the values of [a(EC)] Lp for ECs alone for both serum levels (Figure 5). These models emphasize that in the absence of heterotypic interactions, the EC component provides the dominant hydraulic resistance to water flux, compared to the membrane and SMC components. In 10FB-MEM conditions, the significant reduction in Lp for coculture [a(EC);b(SMC)], compared to resistances-in-series model prediction, reveals the presence of heterotypic interactions (Figure 5, left). In 2.5FB-MEM, the coculture Lp was also lower than the resistances-in-series model prediction, but not quite significant (p = 0.0553) (Figure 5, right). Comparisons presented in Figure 5 clearly demonstrate that the degree of heterotypic regulation of Lp is dependent on the serum concentration in the growth media. This is consistent with earlier studies that showed enhanced heterotypic interactions in higher serum25. Reductions in Lp in co-culture, as we have observed, would be expected when a growth factor or cytokine is reduced in concentration since growth factors are generally associated with increases in permeability. Our observations are consistent with a previous study in which ECs were directly cultured on top of preexisting SMCs23and it was shown that the protein levels of the growth factor PDGF-BB were significantly lower when compared to control groups ( EC and SMC monocultures). PDGF-BB is known to degrade tight junctions and impair the EC transport barrier48.
Since the [a(EC);b(SMC)] coculture configuration most closely represents the arrangement between ECs and SMCs in an intact arterial wall, it is tempting to conclude that this heterotypic configuration enhances the transport barrier for normal blood vessels. The specific mechanism of the heterotypic interactions that lead to a reduction in Lp for the [a(EC);b(SMC)] coculture remains to be investigated. We have considered whether direct cellular contact between EC and SMC plays a role.
Processes involved in EC and SMC interactions
Cell tracker green staining of 10FB-MEM BAEC and BASMC monocultures (Figure 7) and cocultures (Figure 8), showed no evidence of processes within the pore structure from either ECs or SMCs. On the other hand, electron micrographs of small arteries have identified EC and SMC process invasions in pores of the intervening internal elastic lamina, which also extended to form intact endo-myothelial and myo-endothelial junctions40. Differences between our observations in culture and those in small arteries may be related to the much thinner internal elastic lamina (order 1 μm) compared to our PET membrane thickness (10 μm), and to differences in materials. The pore density and diameter of the PET membranes, however, are similar to those of arterial IEL 25,43. However, in a bilayer coculture study18, electron micrographs also revealed intact myo-endothelial junctions, formed by SMCs extending their cell processes through 0.4 μm diameter pores and across a 13 μm thick membrane to make intimate contact with ECs. That coculture closely resembled the heterotypic cell arrangement in our [a(EC);b(SMC)] coculture, the main difference being the time of co-culture – ours being 5 days compared to 7 or 14 days in that study.
Coculture arrangements regulate patterns in EC morphology
Contact-inhibited formation of EC monolayers is a characteristic homotypic function. A 10x microscope objective was used to image wide fields of view and we observed uniformly intact EC monolayers in every culture configuration (Figure 6). Figure 6, and Table 1 show that the shape of ECs in the shared media coculture, [a(EC);c(SMC)], is similar to that in the [a(EC)] monoculture. However, the ECs in the porous membrane interface coculture, [a(EC);b(SMC)], in 10FB-MEM and 2.5FB-MEM conditions, were unique because they displayed a more elongated morphology in comparison to all other cell culture arrangements (Figure 6). Endothelial cell shape factor comparisons shown in Table 1, confirmed that the ECs in [a(EC);b(SMC)] conditions were in fact significantly elongated. The differences in shape factor between [a(EC)] and [a(EC);b(SMC)] may be due to differences in some growth factor that is altered in co-culture such as the increased VEGF observed in a previous study23 .
An increase in the intercellular junction perimeter per unit of surface area that is apparent in Figure 6 for the elongated pattern of ECs in [a(EC);b(SMC)] arterial cocultures suggests a greater junctional area for water transport that would lead to increased Jv if junction integrity or other factors were not altered. Yet the [a(EC);b(SMC)] coculture displayed a significantly lower Lp than the [a(EC)] monoculture (Figure 4). Therefore, within the [a(EC);b(SMC)] coculture, heterotypic interactions induce enhanced intercellular junction integrity.
Various coculturing methods have been developed to capture more in-vivo-like tissue features, in comparison to monoculture cases. For example, elongated EC shapes were noticed when they were cultured directly above a matrix of collagen type I gel that was embedded with SMCs49. Previous studies23 have also shown that coculturing techniques modulate a variety of protein secretions from both ECs and SMCs. It was demonstrated that directly coculturing ECs on top of preexisting SMCs led to different VEGF, PDGF-BB, TGF-β and bFGF secretions from both ECs and SMCs23. The proximity and inoculation order of SMCs and ECs in that study23 differed from our [a(EC);b(SMC)] coculture (Figure 2) and did not include basal culture media and a porous membrane allowing for water flux.
Coculturing methods in another study39, which incorporated an intervening porous membrane between ECs and SMCs, induced changes in endothelial secretions of IL-1 and MCP-1. Smooth muscle cells were also characterized as being either ‘more’ or ‘less secretory’ as a result of changes in serum content in culture media39. The distance between ECs and SMCs in that coculture was most similar to what is found in coculture format [a(EC);b(SMC)] (Figure 2), however, both the coculture inoculation order and the culture time varied from our present study, and a transmural water flux was not present.
While the co-culture models of this study simulate several aspects of a an artery or an artery construct, there are several physiological features that were not investigated. We used a static model without flow over the EC surface as used in most culture studies of the EC transport barrier. There have been in vitro transport studies using ECs exposed to arterial levels of fluid shear stress that show a permeability or Lp response to shear stress44. Additional studies will be required to determine shear effects on co-culture transport properties. As described above, the porous polymer membrane, while capturing the pore size and the pore area fraction of the IEL, does not match the thickness or compliance or chemical composition of the IEL. We did, however, simulate arterial transvascular flow as required for measurements of Lp, and the Jv values utilized (order 10−6 cm/s) are in the range of physiological transvascular 43 flows.
Concluding remarks
Serum level in cultures had a significant influence on Lp. Lowering the serum concentration by four fold resulted in a proportionate reduction in [a(EC)] Lp, which was the largest serum-dependent shift in Lp that we observed. Also, [a(EC);b(SMC)] coculture, which mimics the EC-SMC arrangement in a healthy arterial wall, led to a significantly lower Lp than ECs alone. Since soluble factors produced in [a(EC);c(SMC)] did not reduce Lp to the same level as [a(EC);b(SMC)], and we did not see any evidence of extended processes in the pores that might have increased the resistance to Jv or provided direct contact between ECs and SMCs, it seems likely that increased transport rates and concentrations of soluble mediators induced by reduced transport distances (10 μm for [a(EC);b(SMC)] compared to 1 cm for [a(EC);c(SMC)]) are key factors distinguishing the two cases.
Overall, we have demonstrated that Lp magnitude is a direct result of EC and SMC coculture arrangements. In particular, we have produced an arterial coculture system, [a(EC);b(SMC)], that includes an intervening porous membrane and mimics the arrangement of ECs and SMCs in a healthy arterial wall. This coculture produced a pattern of significantly elongated ECs, and the lowest in-vitro Lp values yet reported in the literature.
Acknowledgements
This work was supported by National Heart, Lung, and Blood Institute Grant HL57093.
References
- 1.Aiello VD, Gutierrez PS, Chaves MJ, Lopes AA, Higuchi ML, et al. Morphology of the internal elastic lamina in arteries from pulmonary hypertensive patients: a confocal laser microscopy study. Mod Pathol. 2003;16:411–416. doi: 10.1097/01.MP.0000067685.57858.D7. [DOI] [PubMed] [Google Scholar]
- 2.Alexander JS, Patton WF, Christman BW, Cuiper LL, Haselton FR. Platelet-derived lysophosphatidic acid decreases endothelial permeability in vitro. Am J Physiol. 1998;274:H115–122. doi: 10.1152/ajpheart.1998.274.1.H115. [DOI] [PubMed] [Google Scholar]
- 3.Bird B.R. WES, Lightfoot EN. Transport Phenomena. John Wiley & Sons Inc.; New York: Shell momentum balances and velocity distributions in laminar flow. pp. 53–55, 2007. [Google Scholar]
- 4.Buschmann I, Schaper W. Arteriogenesis Versus Angiogenesis: Two Mechanisms of Vessel Growth. News Physiol Sci. 1999;14:121–125. doi: 10.1152/physiologyonline.1999.14.3.121. [DOI] [PubMed] [Google Scholar]
- 5.Cancel LM, Fitting A, Tarbell JM. In vitro study of LDL transport under pressurized (convective) conditions. Am J Physiol Heart Circ Physiol. 2007;293:H126–132. doi: 10.1152/ajpheart.01188.2006. [DOI] [PubMed] [Google Scholar]
- 6.Castellot JJ, Jr., Karnovsky MJ, Spiegelman BM. Potent stimulation of vascular endothelial cell growth by differentiated 3T3 adipocytes. Proc Natl Acad Sci U S A. 1980;77:6007–6011. doi: 10.1073/pnas.77.10.6007. [DOI] [PMC free article] [PubMed] [Google Scholar]
- 7.Chang YS, Yaccino JA, Lakshminarayanan S, Frangos JA, Tarbell JM. Shear-induced increase in hydraulic conductivity in endothelial cells is mediated by a nitric oxide-dependent mechanism. Arterioscler Thromb Vasc Biol. 2000;20:35–42. [PubMed] [Google Scholar]
- 8.Chiu JJ, Chen LJ, Lee PL, Lee CI, Lo LW, et al. Shear stress inhibits adhesion molecule expression in vascular endothelial cells induced by coculture with smooth muscle cells. Blood. 2003;101:2667–2674. doi: 10.1182/blood-2002-08-2560. [DOI] [PubMed] [Google Scholar]
- 9.Conway EM, Collen D, Carmeliet P. Molecular mechanisms of blood vessel growth. Cardiovasc Res. 2001;49:507–521. doi: 10.1016/s0008-6363(00)00281-9. [DOI] [PubMed] [Google Scholar]
- 10.Conyers G, Milks L, Conklyn M, Showell H, Cramer E. A factor in serum lowers resistance and opens tight junctions of MDCK cells. Am J Physiol. 1990;259:C577–585. doi: 10.1152/ajpcell.1990.259.4.C577. [DOI] [PubMed] [Google Scholar]
- 11.Davies PF, Truskey GA, Warren HB, O'Connor SE, Eisenhaure BH. Metabolic cooperation between vascular endothelial cells and smooth muscle cells in co-culture: changes in low density lipoprotein metabolism. J Cell Biol. 1985;101:871–879. doi: 10.1083/jcb.101.3.871. [DOI] [PMC free article] [PubMed] [Google Scholar]
- 12.De Wit C, Boettcher M, Schmidt VJ. Signaling across myoendothelial gap junctions--fact or fiction? Cell Commun Adhes. 2008;15:231–245. doi: 10.1080/15419060802440260. [DOI] [PubMed] [Google Scholar]
- 13.DeMaio L, Tarbell JM, Scaduto RC, Jr., Gardner TW, Antonetti DA. A transmural pressure gradient induces mechanical and biological adaptive responses in endothelial cells. Am J Physiol Heart Circ Physiol. 2004;286:H731–741. doi: 10.1152/ajpheart.00427.2003. [DOI] [PubMed] [Google Scholar]
- 14.Dora KA. Cell-cell communication in the vessel wall. Vasc Med. 2001;6:43–50. [PubMed] [Google Scholar]
- 15.Dull RO, Jo H, Sill H, Hollis TM, Tarbell JM. The effect of varying albumin concentration and hydrostatic pressure on hydraulic conductivity and albumin permeability of cultured endothelial monolayers. Microvasc Res. 1991;41:390–407. doi: 10.1016/0026-2862(91)90037-c. [DOI] [PubMed] [Google Scholar]
- 16.Duthu GS, Smith JR. In vitro proliferation and lifespan of bovine aorta endothelial cells: effect of culture conditions and fibroblast growth factor. J Cell Physiol. 1980;103:385–392. doi: 10.1002/jcp.1041030303. [DOI] [PubMed] [Google Scholar]
- 17.Fagotto F, Gumbiner BM. Cell contact-dependent signaling. Dev Biol. 1996;180:445–454. doi: 10.1006/dbio.1996.0318. [DOI] [PubMed] [Google Scholar]
- 18.Fillinger MF, Sampson LN, Cronenwett JL, Powell RJ, Wagner RJ. Coculture of endothelial cells and smooth muscle cells in bilayer and conditioned media models. J Surg Res. 1997;67:169–178. doi: 10.1006/jsre.1996.4978. [DOI] [PubMed] [Google Scholar]
- 19.Gaballa MA, Raya TE, Simon BR, Goldman S. Arterial mechanics in spontaneously hypertensive rats. Mechanical properties, hydraulic conductivity, and two-phase (solid/fluid) finite element models. Circ Res. 1992;71:145–158. doi: 10.1161/01.res.71.1.145. [DOI] [PubMed] [Google Scholar]
- 20.Gartner LP. Color Textbook of Histology. Saunders Co; Philadelphia: 2001. Circulatory System. pp. 251–256. aJLHSC. [Google Scholar]
- 21.Grazia Lampugnani M, Zanetti A, Corada M, Takahashi T, Balconi G, et al. Contact inhibition of VEGF-induced proliferation requires vascular endothelial cadherin, beta-catenin, and the phosphatase DEP-1/CD148. J Cell Biol. 2003;161:793–804. doi: 10.1083/jcb.200209019. [DOI] [PMC free article] [PubMed] [Google Scholar]
- 22.Heberlein KR, Straub AC, Isakson BE. The myoendothelial junction: breaking through the matrix? Microcirculation. 2009;16:307–322. doi: 10.1080/10739680902744404. [DOI] [PMC free article] [PubMed] [Google Scholar]
- 23.Heydarkhan-Hagvall S, Helenius G, Johansson BR, Li JY, Mattsson E, et al. Co-culture of endothelial cells and smooth muscle cells affects gene expression of angiogenic factors. J Cell Biochem. 2003;89:1250–1259. doi: 10.1002/jcb.10583. [DOI] [PubMed] [Google Scholar]
- 24.Hillsley MV, Tarbell JM. Oscillatory shear alters endothelial hydraulic conductivity and nitric oxide levels. Biochem Biophys Res Commun. 2002;293:1466–1471. doi: 10.1016/S0006-291X(02)00410-2. [DOI] [PubMed] [Google Scholar]
- 25.Huang Y, Jan KM, Rumschitzki D, Weinbaum S. Structural changes in rat aortic intima due to transmural pressure. J Biomech Eng. 1998;120:476–483. doi: 10.1115/1.2798017. [DOI] [PubMed] [Google Scholar]
- 26.Kurzen H, Manns S, Dandekar G, Schmidt T, Pratzel S, et al. Tightening of endothelial cell contacts: a physiologic response to cocultures with smooth-muscle-like 10T1/2 cells. J Invest Dermatol. 2002;119:143–153. doi: 10.1046/j.1523-1747.2002.01792.x. [DOI] [PubMed] [Google Scholar]
- 27.Langeler EG, van Hinsbergh VW. Characterization of an in vitro model to study the permeability of human arterial endothelial cell monolayers. Thrombosis and haemostasis. 1988;60:240–246. [PubMed] [Google Scholar]
- 28.Li G, Simon MJ, Cancel LM, Shi ZD, Ji X, et al. Permeability of endothelial and astrocyte cocultures: in vitro blood-brain barrier models for drug delivery studies. Ann Biomed Eng. 2010;38:2499–2511. doi: 10.1007/s10439-010-0023-5. [DOI] [PMC free article] [PubMed] [Google Scholar]
- 29.Mekata F. Current spread in the smooth muscle of the rabbit aorta. J Physiol. 1974;242:143–155. doi: 10.1113/jphysiol.1974.sp010698. [DOI] [PMC free article] [PubMed] [Google Scholar]
- 30.Minnear FL, Patil S, Bell D, Gainor JP, Morton CA. Platelet lipid(s) bound to albumin increases endothelial electrical resistance: mimicked by LPA. Am J Physiol Lung Cell Mol Physiol. 2001;281:L1337–1344. doi: 10.1152/ajplung.2001.281.6.L1337. [DOI] [PubMed] [Google Scholar]
- 31.Mortell KH, Marmorstein AD, Cramer EB. Fetal bovine serum and other sera used in tissue culture increase epithelial permeability. In Vitro Cell Dev Biol. 1993;29A:235–238. doi: 10.1007/BF02634190. [DOI] [PubMed] [Google Scholar]
- 32.Nitz T, Eisenblätter T, Psathaki K, Galla H-J. Serum-derived factors weaken the barrier properties of cultured porcine brain capillary endothelial cells in vitro. Brain Research. 2003;981:30–40. doi: 10.1016/s0006-8993(03)02834-8. [DOI] [PubMed] [Google Scholar]
- 33.Pang Z, Niklason LE, Truskey Porcine endothelial cells cocultured with smooth muscle cells became procoagulant in vitro. Tissue Eng Part A. 2010;16:1835–1844. doi: 10.1089/ten.tea.2009.0448. [DOI] [PMC free article] [PubMed] [Google Scholar]
- 34.Perez-Zoghbi JF, Bai Y, Sanderson MJ. Nitric oxide induces airway smooth muscle cell relaxation by decreasing the frequency of agonist-induced Ca2+ oscillations. J Gen Physiol. 2010;135:247–259. doi: 10.1085/jgp.200910365. [DOI] [PMC free article] [PubMed] [Google Scholar]
- 35.Pnueli D. Fluid Mechanics. Cambridge University Press; New York: 1992. Exact solutions of the Navier-Stokes equations. pp. 193–196. aCG. [Google Scholar]
- 36.Powers MR, Blumenstock FA, Cooper JA, Malik AB. Role of albumin arginyl sites in albumin-induced reduction of endothelial hydraulic conductivity. J Cell Physiol. 1989;141:558–564. doi: 10.1002/jcp.1041410314. [DOI] [PubMed] [Google Scholar]
- 37.Qazi H, Palomino R, Shi ZD, Munn LL, Tarbell JM. Cancer cell glycocalyx mediates mechanotransduction and flow-regulated invasion. Integr Biol (Camb) 2013 doi: 10.1039/c3ib40057c. [DOI] [PMC free article] [PubMed] [Google Scholar]
- 38.Renkin EM, Curry FE. Endothelial permeability: pathways and modulations. Ann N Y Acad Sci. 1982;401:248–259. doi: 10.1111/j.1749-6632.1982.tb25724.x. [DOI] [PubMed] [Google Scholar]
- 39.Rose SL, Babensee JE. Complimentary endothelial cell/smooth muscle cell co-culture systems with alternate smooth muscle cell phenotypes. Ann Biomed Eng. 2007;35:1382–1390. doi: 10.1007/s10439-007-9311-0. [DOI] [PubMed] [Google Scholar]
- 40.Ryan US, Ryan JW, Whitaker C. How do kinins affect vascular tone? Adv Exp Med Biol. 1979;120A:375–391. doi: 10.1007/978-1-4757-0926-1_35. [DOI] [PubMed] [Google Scholar]
- 41.Schaper W, Buschmann I. Arteriogenesis, the good and bad of it. Cardiovasc Res. 1999;43:835–837. doi: 10.1016/s0008-6363(99)00191-1. [DOI] [PubMed] [Google Scholar]
- 42.Shields JD, Fleury ME, Yong C, Tomei AA, Randolph GJ, et al. Autologous chemotaxis as a mechanism of tumor cell homing to lymphatics via interstitial flow and autocrine CCR7 signaling. Cancer Cell. 2007;11:526–538. doi: 10.1016/j.ccr.2007.04.020. [DOI] [PubMed] [Google Scholar]
- 43.Tada S, Tarbell JM. Interstitial flow through the internal elastic lamina affects shear stress on arterial smooth muscle cells. Am J Physiol Heart Circ Physiol. 2000;278:H1589–1597. doi: 10.1152/ajpheart.2000.278.5.H1589. [DOI] [PubMed] [Google Scholar]
- 44.Tarbell JM. Shear stress and the endothelial transport barrier. Cardiovasc Res. 2010;87:320–330. doi: 10.1093/cvr/cvq146. [DOI] [PMC free article] [PubMed] [Google Scholar]
- 45.Tarbell JM, Demaio L, Zaw MM. Effect of pressure on hydraulic conductivity of endothelial monolayers: role of endothelial cleft shear stress. J Appl Physiol. 1999;87:261–268. doi: 10.1152/jappl.1999.87.1.261. [DOI] [PubMed] [Google Scholar]
- 46.Tarbell JM, Lever MJ, Caro CG. The effect of varying albumin concentration of the hydraulic conductivity of the rabbit common carotid artery. Microvasc Res. 1988;35:204–220. doi: 10.1016/0026-2862(88)90063-5. [DOI] [PubMed] [Google Scholar]
- 47.van Oostrom MC, van Oostrom O, Quax PH, Verhaar MC, Hoefer IE. Insights into mechanisms behind arteriogenesis: what does the future hold? J Leukoc Biol. 2008;84:1379–1391. doi: 10.1189/jlb.0508281. [DOI] [PubMed] [Google Scholar]
- 48.Wen H, Lu Y, Yao H, Buch S. Morphine induces expression of platelet-derived growth factor in human brain microvascular endothelial cells: implication for vascular permeability. PLoS One. 2011;6:e21707. doi: 10.1371/journal.pone.0021707. [DOI] [PMC free article] [PubMed] [Google Scholar]
- 49.Ziegler T, Alexander RW, Nerem RM. An endothelial cell-smooth muscle cell co-culture model for use in the investigation of flow effects on vascular biology. Ann Biomed Eng. 1995;23:216–225. doi: 10.1007/BF02584424. [DOI] [PubMed] [Google Scholar]


