

Abstract
Dihydropyrimidine dehydrogenase (DPD, encoded by DPYD) is the rate-limiting enzyme in the uracil catabolic pathway and has a pivotal role in the pharmacokinetics of the commonly prescribed anti-cancer drug 5-fluorouracil (5-FU). Deficiency of DPD, whether due to inadequate expression or deleterious variants in DPYD, has been linked to severe toxic responses to 5-FU. Little is known about the mechanisms governing DPD expression in the liver. In this report, we show increased accumulation of RNA induced silencing complex (RISC) proteins on DPYD mRNA in cells overexpressing the highly homologous microRNAs miR-27a and miR-27b. These microRNAs were shown to repress DPD expression through two conserved recognition sites in DPYD. The IC50 of 5-FU for HCT116 cells over-expressing miR-27a or miR-27b was 4.4 μM (both), significantly lower than that for cells expressing a non-targeting (scramble) control microRNA (14.3 μM; P=3.3×10⁻⁵ and P=1.5×10⁻⁷, respectively). Mouse liver DPD enzyme activity was inversely correlated with expression levels of miR-27a (R2=0.49, P=0.0012) and miR-27b (R2=0.29, P=0.022). A common variant in the hairpin loop region of hsa-mir-27a (rs895819) was also shown to be associated with elevated expression of the miR-27a in a panel of cell lines (P=0.029) and in a transgenic overexpression model (P=0.0011). Furthermore, rs895819 was associated with reduced DPD enzyme activity (P=0.028) in a cohort of 40 healthy volunteers. Taken together, these results suggest that miR-27a and miR-27b expression may be pharmacologically relevant modulators of DPD enzyme function in the liver. Furthermore, our data suggest that rs895819 may be a potential risk allele for 5-FU sensitivity.
Keywords: miR-27a, human, miR-27b, human, microRNA, dihydropyrimidine dehydrogenase
INTRODUCTION
The pyrimidine analog 5-flourouracil (5-FU), and its prodrug capecitabine, are commonly administered for the management of several solid tumors, most notably colorectal cancer. Adverse reactions to 5-FU are relatively frequent, with grade 3 or higher toxicity occurring in up to 34% of recipients (1). Dihydropyrimidine dehydrogenase (DPD) is the rate-limiting enzyme in the uracil catabolic pathway, which is responsible for converting 80–90% of administered 5-FU to the inactive metabolite 5-dihydrofluorouracil (2). Certain genetic variations in DPYD have been shown to impair DPD enzyme function (3) and significantly increase the risk of fluoropyrimidine toxicity by increasing exposure to 5-FU over time (4). DPYD variations are important contributors to 5-FU toxicity risk, although they are thought to only account for approximately 30% of cases of severe toxicity to 5-FU (5).
Intra-individual differences in DPD expression, potentially due to epigenetic factors, have also been suggested to contribute to variable 5-FU sensitivity and variable 5-FU efficacy. 5-FU chemo-resistance has been shown to be associated with high tumor expression of DPD in various cancers, including colorectal (6), gastric (7), lung (8), and oral (9) cancers. Strong correlations have been noted between DPD protein expression and enzymatic activity in human lymphocytes (10), and correlations between DPYD mRNA expression and DPD activity have been reported in liver specimens (11). However, a number of studies have identified discrepancies between DPYD mRNA expression, DPD protein expression, and DPD enzymatic activity (for example (12, 13)), suggesting that DPD expression may be regulated at the post-transcriptional level. Promoter methylation has been proposed as a potential regulatory mechanism for DPD expression; (14, 15) however, more recent clinical studies failed to establish an association with toxicity (16). Recent data have suggested that microRNAs may post-transcriptionally regulate DPD expression in lung tumors, (17) although the contributions to 5-FU sensitivity and resistance have not been evaluated.
The objectives of the present study were to determine the physiological relevance of miR-27a- and miR-27b-mediated regulation of DPD to 5-FU toxicity and resistance. This study additionally investigated the functional impact of the hsa-mir-27a hairpin region single nucleotide polymorphism (SNP) rs895819 on expression of mature miR-27a and, consequently, DPD enzymatic activity in human circulating cells. Based on computational predictions, we hypothesized that miR-27a and miR-27b post-transcriptionally repressed DPD through two recognition sequences located directly upstream and downstream of the DPYD termination codon. The results presented in this manuscript provide direct physiological evidence that miR-27a and miR-27b are important contributors to cellular sensitivity to 5-FU.
MATERIALS AND METHODS
Cells
Low passage HEK293T/c17 (culture CRL-11268), HCT116 (culture CCL-247), and HT-29 (culture HTB-38) cells were obtained from ATCC (Manassas, VA) and maintained at 37° C in a humidified incubator with an atmosphere of 5% CO2. Cells were cultured using Dulbecco’s modified Eagle’s medium (Mediatech, Manassas, VA) supplemented with 10% fetal bovine serum (Denville Scientific, Metuchen, NJ), 100 IU ml−1 penicillin (Mediatech), and 100 μg ml−1 streptomycin (Mediatech). Lymphoblastoid cell lines from unrelated individuals were obtained from the Coriell Institute for Medical Research (Camden, NJ) and were maintained in RPMI medium (Mediatech) supplemented with 10% fetal bovine serum, 100 IU ml−1 penicillin, and 100 μg ml−1 streptomycin. Cell identities of all lines were confirmed and monitored as previously reported (3). Aliquots of low passage cells were cryo-preserved within two weeks of receipt. Cells were cultured for no more than 10 total passages or two months. All cell lines were periodically monitored for mycoplasma using Hoechst staining (Sigma-Aldrich, St. Louis, MO). Culture identity and health were monitored by microscopy and by comparing the population doubling times to baseline values determined at time of receipt. Additional authentication of cell lines beyond that described above was not performed.
Vector construction
To generate microRNA expression vectors, annealed oligonucleotides (Integrated DNA Technologies, Coralville, Iowa) were cloned into the pLKO.1-TRC vector (18), which was obtained from Addgene (plasmid #8453; Cambridge, MA). Control vectors pCMV-GFP (plasmid 11153; (19)) and pLKO.1-scramble (plasmid 17920; (20)), and lentiviral packaging vectors pMD2.G (plasmid 12259) and psPAX (plasmid 12260), were obtained from Addgene. Plasmid sequences were confirmed at the Mayo Clinic Advanced Genomics Technology Center (Rochester, MN).
Lentiviral production
Lentiviral particles were produced by co-transfection of HEK293T/c17 cells with expression and packaging vectors using TransIT-LT1 (Mirrus Bio, Madison, WI) at the ratios recommended by Addgene. 24 hours following transfection, media was removed, cells rinsed with PBS, and fresh media added back to plates. Virus-containing supernatants were collected at 48 and 72 hours after transfection and pooled. To remove cellular debris, supernatants were centrifuged at 600 × g and passed through a 0.45 μm PES membrane filter (EMD Millipore, Billerica, MA). All transductions were conducted in the presence of 8 μg ml−1 final concentration polybrene (EMD Millipore). Transduction with viral supernatants for pCMV-GFP, prepared in parallel with experimental samples, was used to assess transduction efficiency.
Western blotting
Protein lysates were separated on a 10% SDS-PAGE gel and transferred to PVDF-FL membrane (EMD Millipore). Membranes were blocked using Odyssey blocking buffer (LI-COR, Lincoln, NE). Blots were probed with primary antibodies against DPD and alpha-tubulin (both AbCam, Cambridge, MA) and subsequent secondary IRDye800 conjugated goat anti-mouse and IRDye 680 conjugated goat anti-rabbit (both LI-COR). Blots were scanned and band intensities quantified using the Image Studio 3.1 and LI-COR Odyssey Infrared Imaging system according to manufacturer’s instructions.
Measurement of DPYD gene expression
Total RNA was extracted using Trizol and the Nucleospin miRNA Purification Kit. Reverse transcription reactions were completed using Transcriptor Reverse Transcriptase with oligo-d(T) primers, according to manufacturer’s directions. Quantitative PCR was carried out using PrimeTime qPCR primer/probe assays (Integrated DNA Technologies) in LightCycler 480 Probes Master enzyme mix (Roche Applied Science, Indianapolis, IN). Human DPYD and GAPDH were amplified and detected using PrimeTime assay numbers Hs.PT.56a.40723155 and Hs.PT.39a.22214836, respectively. Amplification efficiencies for both assays were greater than 95% (data not shown). As such, the 2−ΔΔCT method, where Δ Δ CT = [CTDPYD − CTGAPDH]sample − [CTDPYD − CTGAPDH]scr, was used to measure DPYD expression for cells overexpressing miR-27a and miR-27b (“sample” in the above equation) normalized to expression for cells overexpressing the non-targeting control (“scr” in the above equation) at each time point assayed. Methods and reagents used to measure gene expression in mouse tissues are detailed in the relevant subsection below.
Cell viability assays
Cell viability in the presence of 5-FU was measured in HCT116 cells following transduction of lentiviral particles using CellTiter-Blue (Promega, Madison, WI) as previously reported (3).
Luciferase reporter system
HCT116 RNA was reverse transcribed using the Transcriptor High Fidelity cDNA Synthesis Kit (Roche Applied Science) using oligo-d(T) primers. The 3′ 56 nucleotides of the open reading frame and the 3′UTR of DPYD were amplified by PCR (Phusion High-Fidelity DNA Polymerase, New England Biolabs, Ipswich, MA) using primers 5′-CAACACCTTATGAACCAAAGAGAGGC-3′ and 5′-ATGCTTTATGATATTTTATTTG-3′ and cloned into the pTK-Gluc vector (New England Biolabs). Mutations were introduced into the predicted microRNA seed-binding sites using the Phusion Site-Directed Mutagenesis Kit (New England Biolabs). Independent clonal cell lines stably expressing each of the reporter constructs were selected using G418 (Mediatech) following transfection of linearized plasmid. MicroRNA mimics and inhibitors were obtained from Qiagen (Valencia, CA) and transfected using HiPerFect (Qiagen) per manufacturer’s instructions. AllStars Hs Cell Death siRNA (Qiagen) was used as a transfection control and to establish residual luciferase activity at time of reading. Luciferase levels were measured after 48 hours using the BioLux Gaussia Luciferase Flex Assay Kit (New England Biolabs). Luciferase activity is reported relative to that for the scramble control. P values were determined using a two-tailed unpaired Student’s t-test.
Mouse lines and tissue preparation
Remnant liver tissues from FVB/NTac female mice (lines obtained from Taconic, Hudson, NY) that were greater than 8 weeks old were kindly provided by Dr. Paul F. Lambert, Ph.D. at the University of Wisconsin. Tissue collection was conducted in accordance with protocols approved by the IACUC of the University of Wisconsin. Following resection from mice, livers were immediately snap frozen and stored at −80° C until use. For enzyme activity quantitation, specimens were lysed using a Bullet Blender Storm (Next Advance, Averill Park, NY) with an equivalent tissue-volume of 0.1 mm diameter glass beads in buffer consisting of 35 mM potassium phosphate at pH 7.4, 2.5 mM MgCl2, 0.035% 2-mercaptoethanol, and Complete EDTA-free protease inhibitor cocktail (Roche Applied Science). Lysates were cleared by centrifugation and total protein concentration determined using the Pierce 660 nm Protein Assay (Thermo Fisher Scientific, Rockford, IL). DPD enzyme activity was measured using the HPLC-based assay previously reported by our lab (3).
For total RNA isolation, liver tissues were lysed in Trizol (Life Technologies, Carlsbad, CA) with an equivalent tissue-volume of 0.1 mm diameter glass beads using the Bullet Blender Storm. Total RNA was purified using the Nucleospin miRNA Purification Kit (Macherey-Nagel, Bethlehem, PA), and reverse transcription reactions were performed using the Universal cDNA Synthesis Kit II (Exiqon, Foster City, CA). Quantitative PCR was carried out using TaqMan Gene Expression Assays (Life Technologies) primer and probes in LightCycler 480 Probes Master enzyme mix (Roche Applied Science). Mouse DPYD and GAPDH were amplified and detected using assay numbers Mm00468111_m1 and Mm99999915_g1, respectively, and calculation of normalized relative DPYD expression was performed as described for human DPYD above. MicroRNA expression was measured for mouse tissues similarly as for cell lines as described below.
MicroRNA expression
Total RNA from cell lines was harvested using Trizol followed purification using the Nucleospin miRNA Purification Kit. RNA was DNase treated using Ambion Turbo DNase Treatment and Removal reagents (Life Technologies) per manufacturer’s instructions. RNA from mice was purified as described above. Reverse transcription reactions were performed using the Universal cDNA Synthesis Kit II (Exiqon). MicroRNA expression was assayed by quantitative PCR using locked nucleic acid (LNA)-based primers specific to each microRNA. Primers were ordered from Exiqon to amplify miR-27a (product number 204764), miR-27b (product number 205915), and RNU5G (product number 203908). Reactions were carried out using LightCycler 480 SYBR Green I Master on a LightCycler480 (Roche Applied Science) using cycling parameters recommended by manufacturer. Amplification products were confirmed by melt curve analysis. Relative expression of miR-27a and miR-27b relative to RNU5G was determined using the 2−ΔΔCT method as described above.
RNA-induced silencing complex immunoprecipitation
The RNA-induced silencing complex (RISC) immunoprecipitation (IP) protocol was adapted from that of Keene et al (21). Briefly, HCT116 cells were transduced as described above and lysed in polysome lysis buffer (21). A mixture of Protein A and Protein G PureProteome magnetic beads (EMD Millipore) were pre-coated with anti-pan AGO antibody (clone 2A8, EMD Millipore) and subsequently mixed with pre-cleared lysate. Following washes, beads were resuspended in NT2 buffer (21) supplemented with Proteinase K (Roche Applied Science). Total RNA was extracted using Trizol and the Nucleospin miRNA Purification Kit. Reverse transcription reactions were completed using Transcriptor Reverse Transcriptase using a mixture of oligo-d(T) and random hexamer primers, according to manufacturer’s directions. Quantitative PCR for DPYD was carried out using PrimeTime qPCR primer/probe assay Hs.PT.56a.40723155 (Integrated DNA Technologies) in LightCycler 480 Probes Master enzyme mix.
Human volunteer study
DNA from 53 African American volunteers collected previously at University of Alabama at Birmingham was genotyped for rs895819 using a TaqMan genotyping assay available from Life Technologies. DPYD genotypes and DPD enzyme activity have been previously reported for all individuals used in this study (22), which was approved by the Institutional Review Boards of the University of Alabama at Birmingham (IRB# F020610007 and X000830002) and subsequently at Mayo Clinic (IRB# 09-007080). Inclusion in the present study was contingent on the availability of adequate DNA for genotyping and the lack of known variants associated with DPD deficiency, including DPYD:IVS14+1G>A (rs3918290), p.I560S (rs55886062), p.D949V (rs67376798), or p.Y186C (rs115232898). Statistical tests were performed using PLINK version 1.07 (23) and the R Environment for Statistical Computing version 3.0.1 (R Foundation for Statistical Computing, Vienna, Austria).
Bioinformatics
Potential microRNA binding sites were predicted using the software package PicTar (24). RNA:microRNA duplex structures were predicted, and MFE values were calculated using the RNAhybrid software program (25). The RNAfold software program, as implemented in the Vienna RNA Package version 2.0 (26), was used to predict minimum free energy and centroid (weighted average of possible conformations) pre-microRNA hairpin structures.
Statistical tests
All data analyses and transformations were performed using JMP version 9.0.3 (SAS Institute Inc.), unless otherwise noted. Additional tests and software algorithms used are described in relevant sections above.
RESULTS
In silico modeling predicts two binding sites for miR-27a and miR-27b in DPYD
MicroRNA target specificity is largely determined by the approximately 7-nucleotide region at the 5′ end of the microRNA termed the seed region. Candidate microRNA target sites in the 3′ UTR of DPYD (NM_000110) were predicted using PicTar (24). A conserved seed-region binding site for miR-27a and miR-27b was detected in the 3′ UTR, located 21 to 27 nucleotides downstream of the stop codon (Fig 1A). A manual search of the mRNA revealed an additional conserved seed-region site located 14 to 20 nucleotides upstream of the 3′ UTR in the open reading frame (ORF). The sequence of miR-27a is highly conserved in mammals (Fig 1B) and has a calculated minimum free energy (MFE) of −17.6 kcal mol−1 when bound to the ORF binding site (Fig 1C) and an MFE of −22.7 kcal mol−1 when bound to the UTR binding site (Fig 1D). MiR-27b is likewise highly conserved (Fig 1E), and shows a favorable calculated MFE when bound to the ORF (−18.4 kcal mol−1, Fig 1F) and the UTR (−29.4 kcal mol−1, Fig 1G) predicted sites.
Figure 1. Identification of candidate miR-27a and miR-27b binding sites in the DPYD gene.

A, alignment of mammalian DPYD (NM_000110) sequences for Homo sapiens, Pan troglodytes, Mus musculus, and Canis familiaris. The stop codon is indicated by red lettering. Predicted seed binding sequences are indicated by blue lettering, and predicted flanking microRNA binding sequences are indicated by green lettering. Fully conserved nucleotides are indicated by an asterisk below the alignment. The position of the predicted seed binding regions is reported above the alignment relative to the first nucleotide of the 3′ UTR with coordinates reported relative to the Homo sapiens sequence. B, conservation of mature miR-27a sequences. The minimum free energy (MFE) structures of miR-27a complexed to the predicted ORF (C) and UTR (D) binding sites of Homo sapiens DPYD were predicted using RNAhybrid (25). E, sequence conservation of mature miR-27b. Predicted structures of miR-27b bound to the ORF (F) and UTR (G) binding sites.
Endogenous DPD expression is reduced by miR-27a and miR-27b overexpression
DPD expression was measured in HCT116 colorectal carcinoma cells after transduction with lentiviral particles encoding miR-27a, miR-27b, or a non-targeting (scramble) control. 72 hours following transduction, we noted robust reductions of endogenous DPD expression for cells over-expressing either miR-27a or miR-27b relative to the non-target control (Fig 2A). Quantitation of pooled results from replicate experiments showed that cells over-expressing miR-27a had a 31% reduction in DPD expression compared to control (P=0.027), and that DPD expression was repressed by 51% in miR-27b over-expressing cells (P=0.018, Fig 2B). Similar results were noted when experiments were repeated using HT29 colorectal adenocarcinoma cells (data not shown). This reduction in protein level is accompanied by reduced mRNA expression (Fig 2C), suggesting that repression of expression occurs, at least in part, through targeted degradation of DPYD.
Figure 2. MiR-27a and miR-27b downregulate DPD expression and sensitize cells to 5-FU.

A, DPD and alpha-tubulin expression were measured following transduction of HCT116 cells with lentiviral particles encoding miR-27a (27a), miR-27b (27b), or a non-targeting control microRNA (scr). A representative blot is presented. B, mean DPD protein expression +/− SD for three independent replicate experiments is presented. C, expression of DPYD mRNA relative to GAPDH was measured at the indicated time points by quantitative RT-PCR. Transduction of HCT116 cells was performed as in Figure 1A. Results are presented relative to non-targeting (scr) control. A representative experiment is presented. D, the mean inhibitory concentration (IC50) for 5-FU was determined for HCT116 cells transduced as in Figure 1A. Results for each of four individual biological replicate are presented as an “x.” Mean IC50 values are represented by horizontal bars; whiskers represent standard deviations.
MiR-27a and miR-27b expression sensitizes cells to 5-FU
To determine if the level of DPD repression was adequate to affect cellular sensitivity to 5-FU, the IC50 for the drug was determined in HCT116 cells over-expressing miR-27a, miR-27b, or a non-targeting (scramble) control (Fig 2D). The IC50 for 5-FU in cells expressing miR-27a or miR-27b were 4.4 μmol L−1 and 4.4 μmol L−1, significantly lower than that for the non-targeting control, 14.3 μmol L−1 (P=3.3×10⁻⁵ and P=1.5×10⁻⁷, respectively).
Argonaute-mediated interaction between DPYD and miR-27a/miR-27b
To determine if miR-27a and miR-27b repressed DPD expression via recruitment of RISC components to the DPYD transcript, lysates from cells overexpessing miR-27a, miR-27b, or the non-targeting (scramble) control were immunoprecipitated using anti-pan AGO antibodies. The relative amounts of RISC-associated DPYD were measured using quantitative RT-PCR. A schematic of the RISC-IP procedure is presented in Figure 3A.
Figure 3. Increased association of RISC proteins with DPYD in cells overexpressing miR-27a and miR-27b.
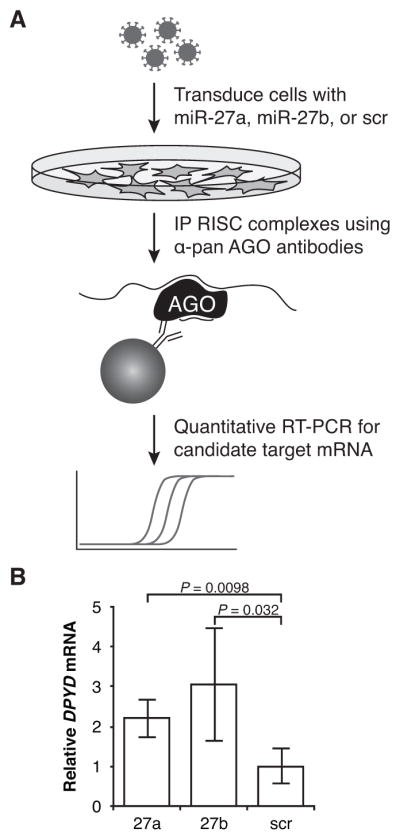
A, the schematic of the RNA immunoprecipitation protocol is presented. B, relative DPYD mRNA in immunoprecipitates was measured using quantitative RT-PCR for HCT116 cells transduced with lentiviral particles encoding miR-27a (27a), miR-27b (27b), or a non-targeting control microRNA (scr). Four independent replicate experiments were performed; data were normalized between experiments by dividing by the mean relative expression within a given replicate.
Cells overexpressing miR-27a showed a 2.2-fold increase in RISC-associated DPYD relative to cells expressing the non-targeting control (P=0.0098, Fig 3B); a 3.0-fold increase over control was noted for cells overexpressing miR-27b (P=0.032). Nonspecific antibody-independent binding of DPYD to protein A/G substrate was undetectable, and total RNA yields were <0.4% of those from experimental samples (data not shown). These data suggest that miR-27a and miR-27b can mediate the targeting of AGO-containing RISC complexes to DPYD to regulate expression of DPD.
Both putative binding sites are targets of miR-27a and miR-27b
To determine which of the predicted binding sites are functional targets for miR-27a and miR-27b, we generated luciferase reporter constructs containing the 3′ UTR of DPYD with an additional 56 bases of upstream ORF sequence, which contained the second predicted binding site (Fig 4A). To confirm specificity for the identified binding sites, mutations were introduced into the predicted ORF binding site, the predicted UTR binding site, and both binding sites (Fig 4B). Independent clonal HCT116 cell lines stably expressing each of the luciferase reporter constructs were selected and transfected with RNA mimics of miR-27a, miR-27b, or a non-targeting control microRNA with no homology to known protein coding genes. Mutation of both binding sites led to a significant increase in luciferase activity following transfection with miR-27a mimics (P=1.9 × 10⁻⁴, Fig 4C), suggesting that the sites may be targets of miR-27a-mediated repression. Mutations at either single binding site also caused a significant, but less severe, increase in luciferase activity following miR-27a transfection (P=0.048 and P=0.0051). Compared to cells expressing the reporter with both sites mutated, those with single site mutations had significantly lower luciferase activity (P=0.0095 and P=0.035). Similar trends were noted for cells transfected with miR-27b (Fig 4C), in which mutation of both binding sites significantly increased luciferase activity (P=1.6 × 10⁻⁵), and mutation of either single site resulted in an intermediate increase in activity (P=0.026 and P=0.0030) that was significantly lower than the double site mutation (P=0.0039 and P=0.0060). No significant differences in luciferase expression were noted between the single site mutations following transfection with either microRNA, suggesting that both sites may participate in repression.
Figure 4. MiR-27a and miR-27b recognize both predicted target sites in DPYD.

A, the 3′ UTR and 56 nucleotides of upstream coding ORF sequence of DPYD were cloned into expression vectors directly downstream of the Gaussia luciferase gene. The locations of the predicted miR-27a and miR-27b binding sites are indicated as solid black bars below the diagram. B, expression vectors harboring mutations in the predicted microRNA binding sites were generated. Dark marks on the diagram indicate that mutations were introduced into that particular site. Stable clonal HCT116 cell lines expressing each of the indicated vectors were generated. Three clonal lines each were generated expressing the single-site mutations (dark gray and light gray). Four clonal lines were generated to express the un-mutated construct (black) and the double-site disruptions (white). C Relative luciferase activity was determined following transfection with RNA mimics of miR-27a, miR-27b, and a non-targeting control microRNA. Results were normalized to the non-targeting control. Each cell line was transfected and relative luciferase activity measured in triplicate. The mean relative luciferase activity of clonal lines is presented +/− SD. P values were calculated using the two-tailed unpaired Student’s t test assuming normal distribution. Constructs showing significantly lower luciferase activity compared to clones expressing the double-mutations construct (P<0.05) are indicated with an asterisk; those showing significantly higher luciferase activity than clones expressing the un-mutated construct (P<0.05) are indicated with a dagger.
Correlation between DPD activity and microRNA expression in liver
Following administration, the majority of 5-FU catabolism occurs in the liver. To determine if miR-27a and miR-27b levels correlated with DPD function ex vivo, liver RNA and protein were purified from 18 mice. DPD protein activity was assayed for each protein lysate by measuring the reduction of radiolabeled 5-FU to DHFU, and expression of miR-27a, miR-27b, and DPYD were measured using quantitative RT-PCR. DPD enzyme activity was negatively correlated with expression of miR-27a (P=0.0012, Fig 5A) and miR-27b (P=0.022, Fig 5B). Negative correlations with DPYD expression were also noted for miR-27a (P=0.0023, Fig 5C) and miR-27b (P=6.4 × 10⁻⁴, Fig 5D). As expected, positive correlations were noted between DPYD expression and DPD activity (P=0.019, Fig 5E) and between miR-27a and miR-27b expression (P=6.4 × 10⁻⁸, Fig 5F). These results provide evidence that miR-27a and miR-27b regulate liver DPD and are involved in 5-FU catabolism in vivo.
Figure 5. MiR-27a/miR-27b expression correlates with reduced DPD enzyme activity and reduced DPYD expression in liver tissue.

Liver specimens were obtained from 18 euthanized mice and immediately flash frozen in liquid nitrogen. Expression of DPYD, miR-27a, and miR-27b were determined by quantitative RT-PCR. DPD enzyme activity was inversely correlated with both miR-27a (A) and miR-27b (B) expression. DPYD expression was also inversely correlated with both miR-27a (C) and miR-27b (D) expression. DPD enzyme activity and DPYD expression were positively correlated (E); miR-27a and miR-27b expression were also positively correlated (F). MiR-27a and miR-27b expression values are reported relative to RNU5G. DPYD expression is reported relative to GAPDH. For all calculations, values were normalized to the mean and are presented as standard deviations from the mean for the analyte reported on each axis (Z-score normalization). The solid black line represents a linear regression of the data, and the dotted gray line is the 95% confidence interval of the regressed line.
Effect of rs895819 on miR-27a expression
The rs895819 polymorphism, located within the coding region for the hsa-mir-27a hairpin, is relatively common with a global minor allele frequency of 35% as estimated using 1000 Genomes data (27). To determine the impact of this SNP on the stability of the hairpin structure, we modeled the minimum free energy and centroid structures (weighted average of possible structural conformations) for hsa-mir-27a with and without the rs895819 variant using RNAfold (26). The larger hairpin structure shown on the left-hand side of Figure 6A contains the rs895819 variant, which results in a loop region that is two bases larger than the “wildtype” hairpin shown on the right-hand side. Larger hairpin loop regions of many microRNA precursors, including hsa-mir-27a, have been previously shown to be more effectively processed, prompting our hypothesis that expression of miR-27a would be higher in the presence of rs895819 due to more effective microRNA maturation (28). To test this hypothesis we measured miR-27a expression in lymphoblastoid cell lines that had been genotyped for rs895819 (Fig 6B). Cells homozygous for the SNP (C allele) had approximately 50% higher miR-27a expression compared to those homozygous for the wildtype T allele (P=0.029). Intermediate expression was noted for heterozygous cell lines.
Figure 6. The hsa-mir-27a hairpin SNP rs895819 leads to increased expression of mature miR-27a.

A, hsa-mir-27a centroid structures corresponding to the T and variant C alleles of rs895819 (A and G, in the hairpin structures were modeled using RNAFold (26). A color scale representing the probability of basepairing for each residue is presented. B, expression of mature miR-27a was determined by quantitative RT-PCR for 94 lymphoblastoid cell lines that were genotyped for rs895819. Results are reported relative to the control RNU5G. Horizontal bars indicate mean expression and boxes indicate the standard error of the mean. The 95% confidence interval is presented as error bars. C, expression vectors encoding wildtype hsa-mir-27a (T allele, WT), rs895819 (C allele, VAR), and a non-targeting control microRNA (SCR) were transfected into HEK293T/c17 cells and expression of mature miR-27a measured by quantitative RT-PCR. Three independent biological replicates were performed. Data for each replicate was normalized using the Z-score method, and pooled data was rescaled relative to SCR and WT. D, healthy volunteers for which DPD enzyme function had been previously quantified (22) were genotyped for the rs895819 variant. DPD enzyme activity (presented as pmol 5-FU reduced min-1 per mg of total protein) following correction for covariates (age, sex, and DPYD-p.C29R status) is presented for non-carriers (WT) and carriers of rs895819. Mean, standard error, and 95% confidence are presented as in B. P values for all experiments were calculated using the two-tailed Student’s t test.
To confirm that the noted expression differences were not an artifact of the varied genetic background of the lymphoblastoid lines, expression constructs encoding the wildtype and variant alleles were expressed in HEK293T/c17 cells. MiR-27a expression was 57% higher in cells expressing the variant construct encoding the G allele (corresponding to the C genotype for rs895819) compared to those expressing the wildtype A allele (P=0.0011; Fig 6C).
To determine if the effect of rs895819 on miR-27a expression was adequate to affect DPD enzyme activity in carriers of the SNP, we genotyped for the variant in a cohort of individuals in which we previously measured DPD enzyme activity in peripheral blood mononuclear cells (22). A multivariate analysis using a general linear model was used to test for association between rs895819 and altered DPD enzyme activity. Age, sex, and the DPYD SNP p.C29R (rs1801265), which previously showed evidence for contributing to increased DPD enzyme activity in circulating cells (22), were treated as covariates. A dominant model for rs895819, in which both heterozygous and homozygous carriers of the variant were grouped, was assumed for these analyses. Following correction for covariates, carriers of rs895819 showed significantly less enzyme activity than non-carriers (P=0.028, Fig 6D). This finding suggests that rs895819 may contribute to 5-FU response.
DISCUSSION
As the rate-limiting enzyme of the uracil catabolic pathway, DPD plays a critical role in determining the pharmacokinetics of 5-FU. Other than genetic variants in DPYD, the mechanisms that regulate DPD enzyme activity in the liver, and by extension 5-FU cytotoxicity, are poorly understood. In this study, we addressed this limitation and provide physiologically relevant evidence that DPD is post-transcriptionally controlled by two highly homologous microRNAs, miR-27a and miR-27b.
Previous reports have suggested that miR-27a may contribute to 5-FU resistance in tumors, potentially through indirect regulation of the drug efflux protein multidrug resistance protein 1 (MDR1, encoded by ABCB1) (29–31); however, the role of MDR1 in 5-FU transport is unclear (32). In the present manuscript, we provide evidence that AGO proteins, catalytic components of the RNA induced silencing complex (RISC), accumulate in greater numbers on DPYD mRNA in cells that overexpress miR-27a and miR-27b (Fig 3) leading to repression of DPD (Fig 2A–B) and increased sensitivity to 5-FU (Fig 2D). These data are supported by luciferase reporter studies presented in Figure 4. Deletion of either predicted miR-27a/miR-27b recognition site in DPYD significantly increased luciferase expression, suggesting that both sites may be targets of RISC-mediated repression (Fig 4C). Overall, these data suggest that DPYD is a direct downstream target of miR-27a and miR-27b, and that expression levels of either microRNA may thus directly affect tumor response to 5-FU. Additional studies are needed to clarify the contributions to 5-FU sensitivity of other pathways downstream of miR-27a and miR-27b.
As the primary site of 5-FU inactivation, 80–90% of administered 5-FU is inactivated by DPD in the liver (2). As such, alteration in liver DPD activity can have profound effects on 5-FU pharmacokinetics, which could potentially lead to decreased drug efficacy due to elevated catabolism (high DPD expression) or clinical toxicity due to impaired catabolism (low DPD expression). In the present study, we provide evidence that liver DPD expression may be regulated in part by miR-27a and miR-27b (Fig 5A–B). These correlations are consistent with those previously reported for miR-27a and 5-FU sensitivity in cellular models of hepatocellular carcinoma (31). In our study, inverse correlations were also noted between DPYD mRNA expression and miR-27a/miR-27b expression (Fig 5C–D), and DPYD mRNA expression was reduced following overexpression of either miR-27a or miR-27b (Fig 2C). These data are consistent with miR-27a/miR-27b targeting RISC proteins to DPYD, leading to mRNA degradation as a means to repress DPD expression (33).
Lastly, we present evidence that a variant within the hsa-mir-27a hairpin-coding region (rs895819) can alter miR-27a expression and subsequently DPD enzyme levels (Fig 6). Studies of the relevance of rs895819 to various cancers have yielded unclear, and at times conflicting, results. The variant C allele has been shown to be protective against certain types of breast cancer (34–36), to be both a risk (37) and protective (38) allele in gastric cancer, and unassociated with risk in colorectal cancer (39). While the variant was originally hypothesized to impair maturation of miR-27a (34), it was later shown to correlate with increased expression (37). This result is consistent with the increase in miR-27a expression we noted in both lymphoblastoid lines (Fig 6B) and by direct evaluation of function using an isogenic system of expression (Fig 6C). We additionally showed that DPD activity was significantly lower in rs895819 carriers than in non-carriers (Fig 6D). Further studies are underway to determine if the reduction (and the SNP) associate with clinical 5-FU toxicity.
Overall, these findings demonstrate that DPYD may be a direct functional target of RISC-mediated repression by miR-27a and miR-27b. The results presented in this manuscript provide evidence that regulation of DPD by miR-27a/miR-27b may be physiologically relevant to both tumor resistance and clinical toxicity to 5-FU-based chemotherapy.
Acknowledgments
Financial information: This study was funded by NIH grants CA62164 (R.B. Diasio) and CA116964 (R.B. Diasio) and a grant from the Mayo Clinic Center for Individualized Medicine (S.M. Offer). Mayo Clinic Cancer Center shared resources used for this study were funded by an NCI Cancer Center Support Grant 5P30 CA15083-37.
The authors would like to thank Paul Lambert Ph.D and Amy Liem of the McArdle Laboratory for Cancer Research at the University of Wisconsin – Madison for providing mouse liver samples. We thank David Root (Broad Institute of Harvard and MIT, Cambridge, MA) for the use of the PLKO.1-TRC cloning vector. The authors also wish to thank the Mayo Clinic Advanced Genomics Technology Center for sequencing services and the Mayo Clinic Center for Translational Science Activities for statistical support. These facilities are supported in part by the Mayo Clinic Cancer Center, which is funded by an NCI Cancer Center Support Grant 5P30 CA15083-37. This study was funded by NIH grants CA62164 and CA116964 (both R.B.D.). S.M.O. was funded in part by a grant from the Mayo Clinic Center for Individualized Medicine.
Footnotes
Conflict of interest statement: The authors disclose no potential conflicts of interest.
References
- 1.Toxicity of fluorouracil in patients with advanced colorectal cancer: effect of administration schedule and prognostic factors. Meta-Analysis Group In Cancer. J Clin Oncol. 1998;16:3537–41. doi: 10.1200/JCO.1998.16.11.3537. [DOI] [PubMed] [Google Scholar]
- 2.Johnson MR, Diasio RB. Importance of dihydropyrimidine dehydrogenase (DPD) deficiency in patients exhibiting toxicity following treatment with 5-fluorouracil. Adv Enzyme Regul. 2001;41:151–7. doi: 10.1016/s0065-2571(00)00011-x. [DOI] [PubMed] [Google Scholar]
- 3.Offer SM, Wegner NJ, Fossum C, Wang K, Diasio RB. Phenotypic profiling of DPYD variations relevant to 5-fluorouracil sensitivity using real-time cellular analysis and in vitro measurement of enzyme activity. Cancer Res. 2013;73:1958–68. doi: 10.1158/0008-5472.CAN-12-3858. [DOI] [PMC free article] [PubMed] [Google Scholar]
- 4.Caudle KE, Thorn CF, Klein TE, Swen JJ, McLeod HL, Diasio RB, et al. Clinical pharmacogenetics implementation consortium guidelines for dihydropyrimidine dehydrogenase genotype and fluoropyrimidine dosing. Clinical pharmacology and therapeutics. 2013;94:640–5. doi: 10.1038/clpt.2013.172. [DOI] [PMC free article] [PubMed] [Google Scholar]
- 5.Yen JL, McLeod HL. Should DPD analysis be required prior to prescribing fluoropyrimidines? Eur J Cancer. 2007;43:1011–6. doi: 10.1016/j.ejca.2007.01.030. [DOI] [PubMed] [Google Scholar]
- 6.Salonga D, Danenberg KD, Johnson M, Metzger R, Groshen S, Tsao-Wei DD, et al. Colorectal tumors responding to 5-fluorouracil have low gene expression levels of dihydropyrimidine dehydrogenase, thymidylate synthase, and thymidine phosphorylase. Clin Cancer Res. 2000;6:1322–7. [PubMed] [Google Scholar]
- 7.Ishikawa Y, Kubota T, Otani Y, Watanabe M, Teramoto T, Kumai K, et al. Thymidylate synthetase and dihydropyrimidine dehydrogenase levels in gastric cancer. Anticancer research. 1999;19:5635–40. [PubMed] [Google Scholar]
- 8.Huang CL, Yokomise H, Kobayashi S, Fukushima M, Hitomi S, Wada H. Intratumoral expression of thymidylate synthase and dihydropyrimidine dehydrogenase in non-small cell lung cancer patients treated with 5-FU-based chemotherapy. Int J Oncol. 2000;17:47–54. [PubMed] [Google Scholar]
- 9.Kobayashi H, Koike T, Nakatsuka A, Kurita H, Sagara J, Taniguchi S, et al. Dihydropyrimidine dehydrogenase expression predicts survival outcome and chemosensitivity to 5-fluorouracil in patients with oral squamous cell carcinoma. Oral oncology. 2005;41:38–47. doi: 10.1016/j.oraloncology.2004.06.003. [DOI] [PubMed] [Google Scholar]
- 10.Fernandez-Salguero P, Gonzalez FJ, Etienne MC, Milano G, Kimura S. Correlation between catalytic activity and protein content for the polymorphically expressed dihydropyrimidine dehydrogenase in human lymphocytes. Biochemical pharmacology. 1995;50:1015–20. doi: 10.1016/0006-2952(95)00231-n. [DOI] [PubMed] [Google Scholar]
- 11.Johnson MR, Wang K, Smith JB, Heslin MJ, Diasio RB. Quantitation of dihydropyrimidine dehydrogenase expression by real-time reverse transcription polymerase chain reaction. Anal Biochem. 2000;278:175–84. doi: 10.1006/abio.1999.4461. [DOI] [PubMed] [Google Scholar]
- 12.Miyamoto S, Ochiai A, Boku N, Ohtsu A, Tahara M, Yoshida S, et al. Discrepancies between the gene expression, protein expression, and enzymatic activity of thymidylate synthase and dihydropyrimidine dehydrogenase in human gastrointestinal cancers and adjacent normal mucosa. Int J Oncol. 2001;18:705–13. doi: 10.3892/ijo.18.4.705. [DOI] [PubMed] [Google Scholar]
- 13.Johnston SJ, Ridge SA, Cassidy J, McLeod HL. Regulation of dihydropyrimidine dehydrogenase in colorectal cancer. Clin Cancer Res. 1999;5:2566–70. [PubMed] [Google Scholar]
- 14.Ezzeldin HH, Lee AM, Mattison LK, Diasio RB. Methylation of the DPYD promoter: an alternative mechanism for dihydropyrimidine dehydrogenase deficiency in cancer patients. Clin Cancer Res. 2005;11:8699–705. doi: 10.1158/1078-0432.CCR-05-1520. [DOI] [PubMed] [Google Scholar]
- 15.Noguchi T, Tanimoto K, Shimokuni T, Ukon K, Tsujimoto H, Fukushima M, et al. Aberrant methylation of DPYD promoter, DPYD expression, and cellular sensitivity to 5-fluorouracil in cancer cells. Clin Cancer Res. 2004;10:7100–7. doi: 10.1158/1078-0432.CCR-04-0337. [DOI] [PubMed] [Google Scholar]
- 16.Savva-Bordalo J, Ramalho-Carvalho J, Pinheiro M, Costa VL, Rodrigues A, Dias PC, et al. Promoter methylation and large intragenic rearrangements of DPYD are not implicated in severe toxicity to 5-fluorouracil-based chemotherapy in gastrointestinal cancer patients. BMC cancer. 2010;10:470. doi: 10.1186/1471-2407-10-470. [DOI] [PMC free article] [PubMed] [Google Scholar]
- 17.Hirota T, Date Y, Nishibatake Y, Takane H, Fukuoka Y, Taniguchi Y, et al. Dihydropyrimidine dehydrogenase (DPD) expression is negatively regulated by certain microRNAs in human lung tissues. Lung cancer. 2012;77:16–23. doi: 10.1016/j.lungcan.2011.12.018. [DOI] [PubMed] [Google Scholar]
- 18.Moffat J, Grueneberg DA, Yang X, Kim SY, Kloepfer AM, Hinkle G, et al. A lentiviral RNAi library for human and mouse genes applied to an arrayed viral high-content screen. Cell. 2006;124:1283–98. doi: 10.1016/j.cell.2006.01.040. [DOI] [PubMed] [Google Scholar]
- 19.Matsuda T, Cepko CL. Electroporation and RNA interference in the rodent retina in vivo and in vitro. Proc Natl Acad Sci U S A. 2004;101:16–22. doi: 10.1073/pnas.2235688100. [DOI] [PMC free article] [PubMed] [Google Scholar]
- 20.Saharia A, Guittat L, Crocker S, Lim A, Steffen M, Kulkarni S, et al. Flap endonuclease 1 contributes to telomere stability. Curr Biol. 2008;18:496–500. doi: 10.1016/j.cub.2008.02.071. [DOI] [PMC free article] [PubMed] [Google Scholar]
- 21.Keene JD, Komisarow JM, Friedersdorf MB. RIP-Chip: the isolation and identification of mRNAs, microRNAs and protein components of ribonucleoprotein complexes from cell extracts. Nature protocols. 2006;1:302–7. doi: 10.1038/nprot.2006.47. [DOI] [PubMed] [Google Scholar]
- 22.Offer SM, Lee AM, Mattison LK, Fossum C, Wegner NJ, Diasio RB. A DPYD Variant (Y186C) in Individuals of African Ancestry Is Associated With Reduced DPD Enzyme Activity. Clinical pharmacology and therapeutics. 2013;94:158–66. doi: 10.1038/clpt.2013.69. [DOI] [PMC free article] [PubMed] [Google Scholar]
- 23.Purcell S, Neale B, Todd-Brown K, Thomas L, Ferreira MA, Bender D, et al. PLINK: a tool set for whole-genome association and population-based linkage analyses. Am J Hum Genet. 2007;81:559–75. doi: 10.1086/519795. [DOI] [PMC free article] [PubMed] [Google Scholar]
- 24.Krek A, Grun D, Poy MN, Wolf R, Rosenberg L, Epstein EJ, et al. Combinatorial microRNA target predictions. Nat Genet. 2005;37:495–500. doi: 10.1038/ng1536. [DOI] [PubMed] [Google Scholar]
- 25.Rehmsmeier M, Steffen P, Hochsmann M, Giegerich R. Fast and effective prediction of microRNA/target duplexes. RNA. 2004;10:1507–17. doi: 10.1261/rna.5248604. [DOI] [PMC free article] [PubMed] [Google Scholar]
- 26.Lorenz R, Bernhart SH, Honer Zu Siederdissen C, Tafer H, Flamm C, Stadler PF, et al. ViennaRNA Package 2.0. Algorithms Mol Biol. 2011;6:26. doi: 10.1186/1748-7188-6-26. [DOI] [PMC free article] [PubMed] [Google Scholar]
- 27.The 1000 Genomes Browser. Hinxton, Cambridgeshire (UK): The European Bioinformatics Institute (EBI); (1000 Genomes release 13). [cited 2013 April 25]; Available from: http://browser.1000genomes.org/index.html. [Google Scholar]
- 28.Zeng Y, Yi R, Cullen BR. Recognition and cleavage of primary microRNA precursors by the nuclear processing enzyme Drosha. EMBO J. 2005;24:138–48. doi: 10.1038/sj.emboj.7600491. [DOI] [PMC free article] [PubMed] [Google Scholar]
- 29.Noratto GD, Jutooru I, Safe S, Angel-Morales G, Mertens-Talcott SU. The drug resistance suppression induced by curcuminoids in colon cancer SW-480 cells is mediated by reactive oxygen species-induced disruption of the microRNA-27a-ZBTB10-Sp axis. Molecular nutrition & food research. 2013;57:1638–48. doi: 10.1002/mnfr.201200609. [DOI] [PubMed] [Google Scholar]
- 30.Sreevalsan S, Safe S. The Cannabinoid WIN 55,212–2 Decreases Specificity Protein (Sp) Transcription Factors and the Oncogenic Cap Protein eIF4E in Colon Cancer Cells. Mol Cancer Ther. 2013 doi: 10.1158/1535-7163.MCT-13-0486. [DOI] [PMC free article] [PubMed] [Google Scholar]
- 31.Chen Z, Ma T, Huang C, Zhang L, Lv X, Xu T, et al. MiR-27a modulates the MDR1/P-glycoprotein expression by inhibiting FZD7/beta-catenin pathway in hepatocellular carcinoma cells. Cellular signalling. 2013;25:2693–701. doi: 10.1016/j.cellsig.2013.08.032. [DOI] [PubMed] [Google Scholar]
- 32.Oshikata A, Matsushita T, Ueoka R. Enhancement of drug efflux activity via MDR1 protein by spheroid culture of human hepatic cancer cells. Journal of bioscience and bioengineering. 2011;111:590–3. doi: 10.1016/j.jbiosc.2011.01.006. [DOI] [PubMed] [Google Scholar]
- 33.Thomson DW, Bracken CP, Goodall GJ. Experimental strategies for microRNA target identification. Nucleic Acids Res. 2011;39:6845–53. doi: 10.1093/nar/gkr330. [DOI] [PMC free article] [PubMed] [Google Scholar]
- 34.Yang R, Schlehe B, Hemminki K, Sutter C, Bugert P, Wappenschmidt B, et al. A genetic variant in the pre-miR-27a oncogene is associated with a reduced familial breast cancer risk. Breast cancer research and treatment. 2010;121:693–702. doi: 10.1007/s10549-009-0633-5. [DOI] [PubMed] [Google Scholar]
- 35.Kontorovich T, Levy A, Korostishevsky M, Nir U, Friedman E. Single nucleotide polymorphisms in miRNA binding sites and miRNA genes as breast/ovarian cancer risk modifiers in Jewish high-risk women. Int J Cancer. 2010;127:589–97. doi: 10.1002/ijc.25065. [DOI] [PubMed] [Google Scholar]
- 36.Zhang N, Huo Q, Wang X, Chen X, Long L, Jiang L, et al. A genetic variant in pre-miR-27a is associated with a reduced breast cancer risk in younger Chinese population. Gene. 2013;529:125–30. doi: 10.1016/j.gene.2013.07.041. [DOI] [PubMed] [Google Scholar]
- 37.Sun Q, Gu H, Zeng Y, Xia Y, Wang Y, Jing Y, et al. Hsa-mir-27a genetic variant contributes to gastric cancer susceptibility through affecting miR-27a and target gene expression. Cancer Sci. 2010;101:2241–7. doi: 10.1111/j.1349-7006.2010.01667.x. [DOI] [PMC free article] [PubMed] [Google Scholar]
- 38.Zhou Y, Du WD, Chen G, Ruan J, Xu S, Zhou FS, et al. Association analysis of genetic variants in microRNA networks and gastric cancer risk in a Chinese Han population. Journal of cancer research and clinical oncology. 2012;138:939–45. doi: 10.1007/s00432-012-1164-8. [DOI] [PubMed] [Google Scholar]
- 39.Hezova R, Kovarikova A, Bienertova-Vasku J, Sachlova M, Redova M, Vasku A, et al. Evaluation of SNPs in miR-196-a2, miR-27a and miR-146a as risk factors of colorectal cancer. World journal of gastroenterology : WJG. 2012;18:2827–31. doi: 10.3748/wjg.v18.i22.2827. [DOI] [PMC free article] [PubMed] [Google Scholar]