

Abstract
Background
When activated by the sympathetic nervous system, brown adipose tissue (BAT) increases energy expenditure to produce heat. Augmenting BAT mass or increasing BAT activation could potentially be used to decrease obesity. Noninvasive methods to detect and monitor BAT mass are needed. Contrast ultrasound can estimate BAT blood flow and is able to measure the perfused volume of an organ and thus its mass. The objective of this study was to evaluate whether contrast ultrasound could characterize BAT mass in two mouse models of obesity: wild-type mice fed a high-fat diet and mutant db/db mice.
Methods
Contrast ultrasound of BAT (Definity 2 μL/min; 14-MHz linear probe) was performed before and after stimulation of BAT with norepinephrine (NE). BAT replenishment curves were obtained, and blood flow was estimated by the product of the curve’s plateau and slope. Additionally, consecutive two-dimensional images of perfused BAT were acquired at 1-mm intervals after stimulation with NE and used to assess BAT volume and mass.
Results
BAT blood flow increased after NE infusion in all mice studied. Blood flow response to NE was similar in wild-type mice fed either a low-fat diet or a high-fat diet. BAT blood flow was lower in db/db mice than in wild-type mice (P = .02). Contrast ultrasound–derived BAT mass was correlated with BAT mass obtained at necropsy (R2 = 0.83, P < .001). BAT mass was higher in mice fed a high-fat diet than in those fed a low-fat diet.
Conclusions
Contrast ultrasound can be used to estimate BAT mass in mice when BAT vascularization is not significantly impaired. This noninvasive technique may potentially allow the serial evaluation of therapies designed to augment BAT mass.
Keywords: Brown adipose tissue, Imaging, Obesity, Contrast ultrasound, db/db mice
Obesity affects >500 million adults and is accompanied by increased morbidity and mortality.1 Weight gain results from an imbalance between energy intake and expenditure. As efforts to decrease energy intake by diet or other treatments are met with limited weight loss2 and potentially large side effects,3-7 increasing energy expenditure has become an attractive potential therapeutic target for weight loss.
When activated by the sympathetic nervous system, brown adipose tissue (BAT) increases energy expenditure by using fatty acids and glucose to produce heat. The thermogenic process is mediated by the mitochondrial uncoupling protein 1 (UCP1),8 which allows protons produced by lipolysis and glycolysis to reenter the mitochondrial matrix, while generating heat instead of adenosine triphosphate.
The presence of BAT has been reported for decades in rodents (mainly between the scapulae and in smaller depots in the cervical, perivascular, and perirenal regions9) and human infants. The interest in BAT physiology, however, considerably increased after recent reports demonstrated the presence of functional BAT detected by 18F-fluorodeoxyglucose (FDG) positron emission tomography (PET) in adult humans.10-12 Although the clinical role of BAT has not been thoroughly elucidated, it has been calculated that 50 g of maximally activated BAT could consume 20% of an adult human’s daily energy intake13; extensive research is under way to develop therapies that increase the mass and/or activity of BAT as a potential weight loss therapy.
One obstacle in research targeted toward BAT is the lack of noninvasive in vivo technique to delineate its mass. Such a technique would allow serial measurements of BAT mass, useful in particular in the investigation of potential BAT-based therapies. Activation of BAT is associated with a marked increase in its local blood flow.14,15 Taking advantage of the dense vascularization of BAT, we recently validated contrast ultrasound (CU) as a novel method to estimate BAT blood flow in vivo in mice.16
The present study relied on the fact that CU may be used to measure the perfused volume of an organ, which is correlated with its mass.17 Our first objective was to investigate whether CU could be used to assess BAT mass in mice.
Interestingly, in humans, the response of BAT to stimulation by cold (assessed by FDG PET) is inversely correlated with body mass index in older adults,11,12 suggesting that obese older adults may have impaired BAT activation or decreased BAT mass. This relationship does not seem to be present in younger adults.12
The models in mice attempt to reproduce some of the features of human obesity. High-fat diet (HFD) feeding represents a model of environmental modifications and is associated with mild obesity. In contrast, db/db mice have a genetic mutation that inactivates the leptin receptor and develop severe obesity and diabetes. In the present study, the BAT in these two obesity models was characterized using ultrasound. It was anticipated that both models would allow investigation of the ability of CU to characterize the mass and function of BAT, as these phenotypically different conditions may be associated with distinct BAT mass and functionality.
METHODS
All animal studies were approved by the Subcommittee on Research Animal Care of the Massachusetts General Hospital (Boston, MA). Four-month-old to 5-month-old male C57BL/6J (wild-type [WT]) and C57BKS.Cg-Dock7m+/+Leprdb/J (db/db) mice obtained from Jackson Laboratory (Bar Harbor, ME) were studied. The db/db mice (n = 6) and WT mice (n = 6) were fed a standard diet (11.8% kcal from fat; Prolab Isopro RMH 3000 5P75, LabDiet, Richmond, IN). In a separate experiment, male WT mice were fed either a low-fat diet (LFD; n = 7) (10% kcal from fat; D12450B, Research Diets, New Brunswick, NJ) or an HFD (n = 8) (60% kcal from fat; D12492, Research Diets). Both the LFD and the HFD were started at 2 months of age and maintained for 2 months. Five mice of each group were used for blood flow measurements, but all mice were used for mass measurement. It has been reported that gender does have an effect on BAT function (female gender appears to be accompanied by an increase in BAT function), for reasons that have not yet been totally elucidated.18-20 Therefore, only male mice were studied, so as not to increase the variability of the experiments.
CU
Mice were weighed and anesthetized with an intraperitoneal injection of ketamine (100 mg/kg) and xylazine (10 mg/kg).21,22 Tracheal intubation was performed, and volume-controlled ventilation was initiated at a respiratory rate of 110 to 120 breaths/min and a tidal volume of 10 μL/g. For the assessment of db/db mice, the right jugular vein was catheterized using a fluid-filled PE-10 catheter. A less invasive approach using tail vein catheterization (with a 31-gauge needle) and lower concentrations of ketamine (80 mg/kg) and xylazine (8 mg/kg) was used for the study of HFD-fed mice.
Mice were placed in the prone position. Body core temperature was monitored and kept constant at 37°C (DC Temperature Control System; FHC, Bowdoin, ME). Perflutren lipid microbubbles (Definity; Lantheus Medical Imaging, Inc., North Billerica, MA) were diluted (1:10 in sterile 0.9% saline solution) and continuously infused intravenously at a rate of 20 μL/min into the right jugular vein or the tail vein.
Estimation of BAT Mass by CU
Acquisition
Mice were placed on a mobile platform while a 14-MHz ultrasound linear transducer (Acuson Sequoia C512; Siemens Medical Solutions USA, Inc., Mountain View, CA) was maintained in a fixed position above the interscapular area using a clamp (Figure 1A). Interscapular BATwas identified by localization of anatomic landmarks (scapulae, Sulzer’s vein).9 To better delineate the perfused volume of BAT, norepinephrine (NE; Bedford Laboratories, Bedford, OH) was infused intravenously at 1 μg/kg/min to stimulate BAT. Microbubbles were infused simultaneously. BAT was scanned (CPS mode; frame rate, 30 Hz; mechanical index, 0.24) by moving the platform in 1-mm intervals parallel to the long axis of the mouse spine. Scanning of BAT was performed while the microbubbles were infused continuously. Each view was acquired for 1 sec and stored immediately. The transducer was then moved and the next view acquired.
Figure 1.
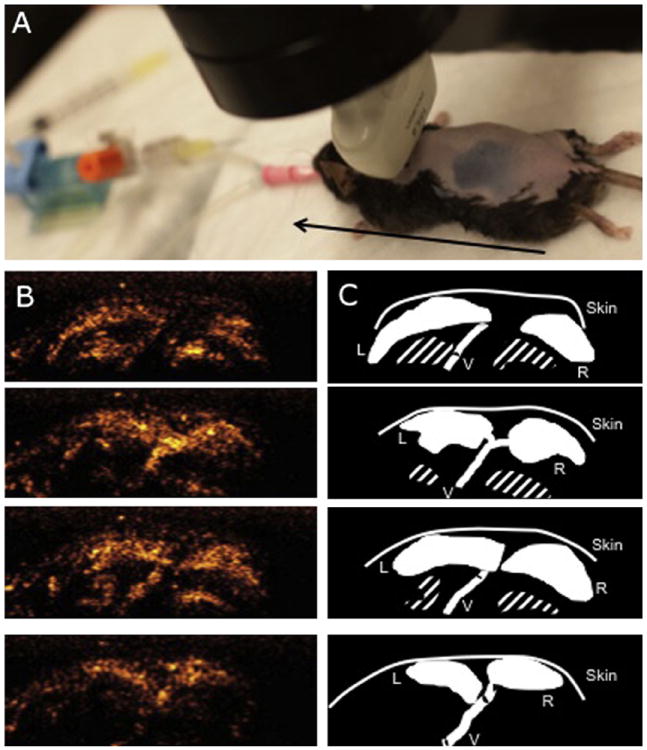
BAT mass calculated by CU. (A) Photograph of the ultrasound probe positioning during acquisitions of BAT images for the volume reconstruction. The black arrow represents the axis along which the mobile platform was moved. (B) Four images of BAT acquired by CU at 1-mm intervals. Acquisition was performed in a craniocaudal direction after stimulation of BAT by NE. The white bar represents 2.5 mm. (C) Schematic diagrams of the images in (B). The BAT area was traced manually on each image, and the three-dimensional perfusion volume was calculated using Simpson’s rule. The volume was then multiplied by the specific density of BAT to calculate BAT mass. The striped area indicates the ribs and intercostal vessels. L, Left BAT lobe; R, right BAT lobe; V, Sulzer’s vein.
Analysis
The perimeter of each BAT lobe was traced, and the area (in square millimeters) was measured for each platform position (9–14 positions for each lobe; Figures 1B and 1C). The volume (in cubic millimeters) of each lobe was calculated using Simpson’s rule. The mass was then calculated by multiplying the volume by the specific density of BAT (0.98).23
Estimation of BAT Blood Flow by CU
Acquisition
CU was performed before and 10 min after the start of a continuous infusion of 1 μg/kg/min NE. For each acquisition, images centered on the BATwere acquired with the same settings as described above, before and for 10 sec after a burst of 10 high-energy frames (mechanical index, 1.8). The right kidney and the right quadriceps femoris muscle were also imaged. Two sets of images were obtained, both at baseline and after NE stimulation.
Analysis
Regions of interest were manually positioned in the BAT, kidney cortex, and quadriceps femoris muscle, as previously described.16 The average signal intensity within the region of interest was automatically measured for each frame (syngo ACQ; Siemens Medical Solutions USA, Inc.). The relationship of the signal intensity over time after bubble destruction was obtained in each region of interest and fitted to an exponential function: y = A × (1 − e−βt), where y is the signal intensity, A is the plateau intensity, and β is the initial slope of the replenishment curve. Blood flow was estimated by calculating the product of A and β.24
Histology and Immunohistochemistry
After CU was completed, mice were euthanized, and the BAT was carefully dissected and weighed. BAT resection was performed using a dissecting microscope. BAT was distinguished from surrounding muscles and white adipose tissue on the basis of the color and the consistency of the tissues. BAT was embedded in paraffin and 5-μm-thick slides were obtained at 1-mm intervals and stained using hematoxylin and eosin.
UCP1 expression in BAT was localized by immunohistochemistry using rabbit anti-UCP1 antibody (1:100, ab10983; Abcam, Cambridge, MA) and goat antirabbit immunoglobulin G antibody (1:200, Sigma 41176; Sigma-Aldrich, St. Louis, MO). Samples were then incubated in a working solution of horseradish peroxidase conjugate (250 μL), and 0.03% diaminobenzidine (250 μL) was applied to the surface of the slide. Samples were counterstained in hematoxylin, dehydrated with sequential ethanol and xylene immersion, and mounted with DPX mountant for histology (Sigma-Aldrich).
Capillary density was measured by incubating BAT sections of WT and db/db mice with biotinylated Griffonia simplicifolia lectin I and staining them with the Vectastain ABC immunoperoxidase system (Vector Laboratories, Burlingame, CA). The number of capillaries was then counted per square millimeter. Five fields were analyzed for each mouse (n = 3 mice in each group) at a magnification of 400×.
Statistical Analysis
Statistical analysis of the results was performed using the JMP statistical software package (SAS Institute Inc., Cary, NC). All values are expressed as mean ± SEM.
Ultrasound-estimated BAT mass was correlated with the BAT mass measured at necropsy using simple regression. Ultrasound-estimated BAT mass was compared in LFD-fed and HFD-fed mice using an unpaired Student’s t test. For comparison of the response of BAT blood flow to NE in LFD-fed and HFD-fed WT mice and in db/db and WT mice, the results were analyzed using two-way analysis of variance for repeated measurements. If the interaction of NE and diet or strain was significant, unpaired Student’s t tests were used to compare ultrasound parameters between groups at the same time point. P values < .05 were considered significant.
The interobserver reliability of CU-estimated mass measurements was performed by two independent observers (M.C. and L.E.) in seven randomly chosen mice (four mice in the HFD group and three mice in the LFD group). To measure intraobserver reliability, a single observer (L.E.) repeated the measurements on the same loops several weeks after the first measurement set. Intraobserver and interobserver variability was calculated as the difference between the two observations divided by the means of the observations and expressed as both absolute numbers and percentages. To estimate the variability between the curves obtained in each mouse, a pooled standard deviation for each of the measurements is also reported.
RESULTS
Intraobserver and Interobserver Variability
The intraobserver variability for CU-estimated mass measurements as assessed by the mean ± SD of the error was 19.1 ± 19.9 mg (10.0 ± 8.9%) (Figure 2A). The interobserver variability for CU-estimated mass measurements was 17.9 ± 22.2 mg (10.8 ± 10.7%) (Figure 2B).
Figure 2.
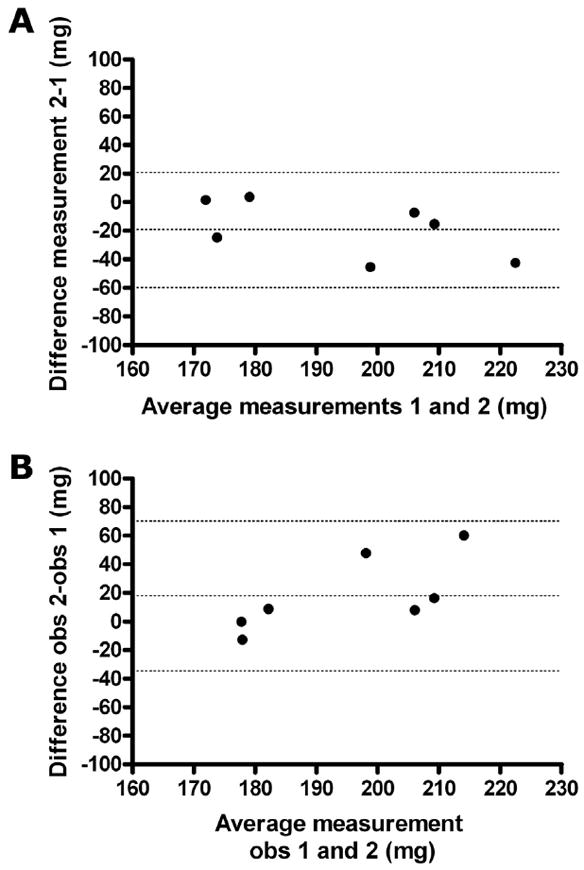
Interobserver and intraobserver agreement. (A) Bland-Altman interobserver agreement of CU-derived BAT mass measurement. The central dotted line represents the bias, and the two extreme dotted lines represent +2 and −2 standard deviations of the difference between the two measurements of the same loops. Bias, −19.1 ± 19.9 mg; 95% limits of agreement, −58.0 to 19.9 mg. (B) Bland-Altman intraobserver agreement of CU-derived BAT mass measurement. The central dotted line represents the bias, and the two extreme dotted lines represents +2 and −2 standard deviations of the difference between the two observers. Bias, 17.9 ± 22.2 mg; 95% limits of agreement, −33.4 to 69.2 mg.
Validation of CU-Derived BAT Mass
The CU-derived BAT mass was compared with the mass obtained at necropsy in LFD-fed and HFD-fed mice. A close correlation was found between BAT mass derived from CU and that measured at necropsy (CU-derived BAT mass = 1.3 × BAT mass at necropsy − 104, R2 = 0.83, P < .001; Figure 3A). BAT mass at necropsy was overestimated by CU; this effect was maximal for the lowest mass values (Figure 3B).
Figure 3.
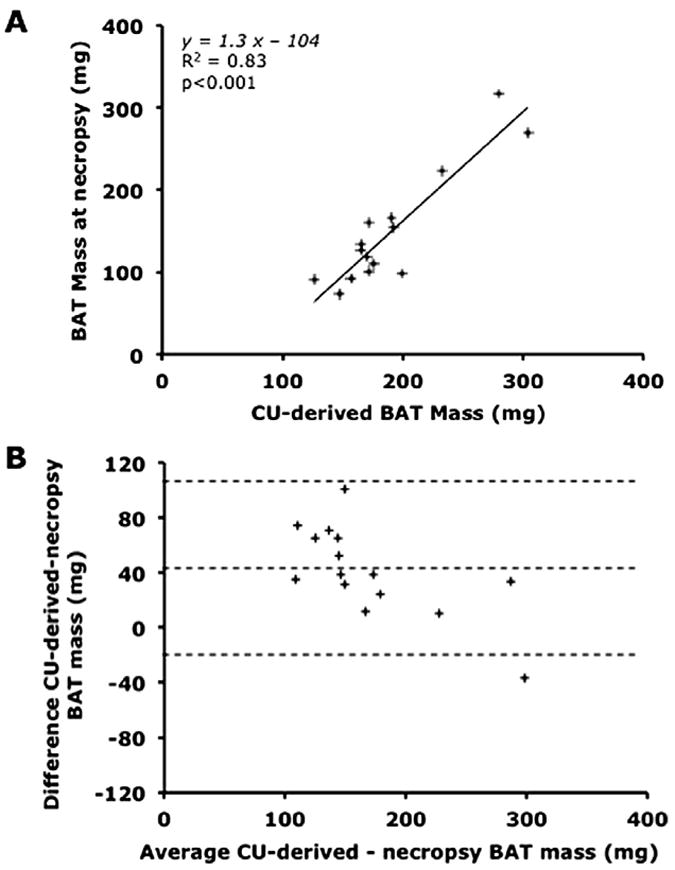
Relationship between BAT mass estimated using CU and BAT mass measured at necropsy. (A) Linear regression analysis comparing BAT mass estimated by CU and measured at necropsy. (B) Bland-Altman agreement plot between BAT mass estimated by CU and measured at necropsy. Bias, 41.1 ± 33.0 mg; 95% limits of agreement, −23.0 to 105.7 mg.
Effect of Obesity on Body Weight and BAT Mass
The body weight of WT mice fed an HFD for 2 months was greater than that of WT mice fed an LFD (40.8 ± 2.5 vs 30.6 ± 0.9 g, P = .003). CU-estimated BAT mass was 213 ± 19 mg in HFD-fed mice and 164 ± 9 mg in LFD-fed mice (P = .03; Figure 4).
Figure 4.
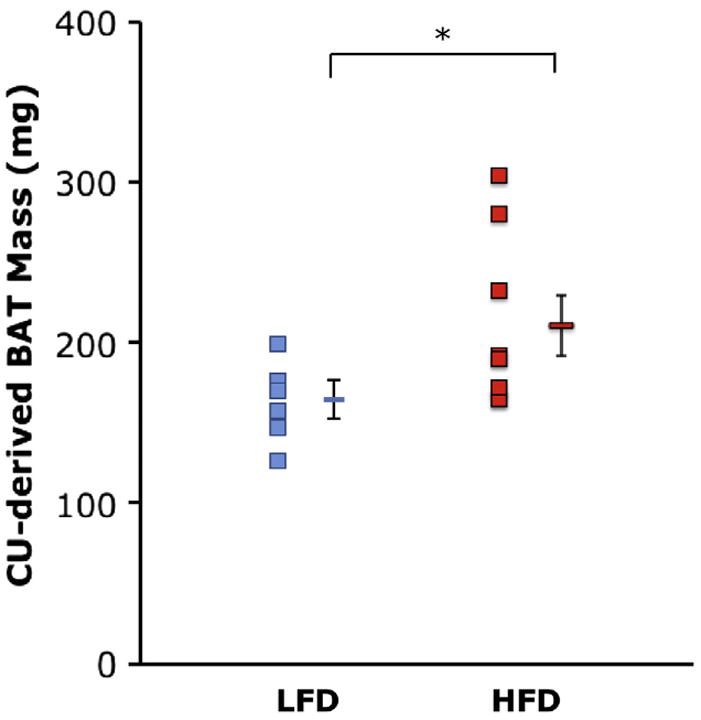
Comparison of BAT mass estimated using CU in WT mice fed an LFD (blue dots; n = 7) or an HFD (red dots; n = 8) for 2 months. Data are depicted as mean ± SEM. *P = .03.
The body weight of db/db mice was markedly greater than that of WT mice (56 ± 2 vs 30 ± 1 g, P < .001). The two BAT lobes could be visualized in the db/db mice (Figure 5), but BAT blood flow was too low to precisely measure BAT mass using CU.
Figure 5.
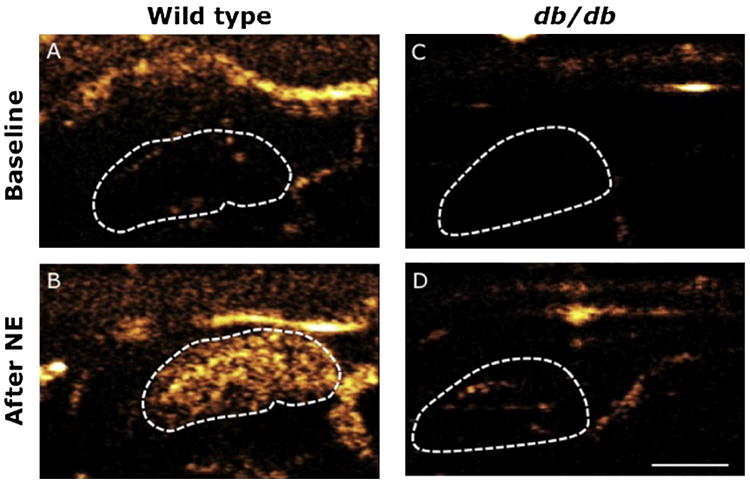
CU of BAT blood flow before and after NE infusion in WT and db/db mice. Contrast microbubbles and NE were infused continuously in the jugular vein. Left BAT lobe of WT mouse at baseline (A) and after 10 min of NE infusion at 1 μg/kg/min (B). Left BAT lobe of a db/db mouse at baseline (C) and after 10 min of NE infusion at 1 μg/kg/min (D). Lobes are delineated by the dotted lines. The white bar represents 2.5 mm.
Effect of HFD Feeding on BAT, Kidney, and Muscle Blood Flow
Before infusion of NE, estimated BAT blood flow was low in LFD-fed mice. Estimated BAT blood flow increased markedly after stimulation of BAT with NE (P = .005; Table 1). Similarly, the estimate of BAT blood flow was low at baseline in HFD-fed mice and increased after NE infusion (P = .003). There was no difference in the NE-induced increase in the estimate of BAT blood flow between LFD-fed and HFD-fed mice. Estimated kidney and muscle blood flow was similar in LFD-fed and HFD-fed mice at baseline and did not change during NE infusion.
Table 1.
Response of BAT, kidney, and muscle blood flow to NE in WT mice fed either an LFD or an HFD for 2 months
| Variable | LFD (n = 5)
|
HFD (n = 5)
|
||
|---|---|---|---|---|
| Baseline | NE infusion at 1 μg/kg/min | Baseline | NE infusion at 1 μg/kg/min | |
| BAT (dB/sec) | 0.5 ± 0.1 | 12.8 ± 2.2* | 0.9 ± 0.2 | 11.2 ± 1.7* |
|
| ||||
| Kidney (dB/sec) | 9.1 ± 1.2 | 8.0 ± 1.7 | 10.4 ± 0.7 | 9.1 ± 1.8 |
|
| ||||
| Muscle (dB/sec) | 0.5 ± 0.2 | 0.2 ± 0.03 | 0.5 ± 0.2 | 0.3 ± 0.1 |
Data are expressed as mean ± SEM.
P < .05, baseline versus NE infusion.
BAT, Kidney, and Muscle Blood Flow in db/db Mice
In WT mice fed a standard diet, the estimated BAT blood flow was low before NE infusion and increased 13-fold after stimulation with NE (P = .01; Table 2). The estimate of BAT blood flow in db/db mice was lower than that of WT mice before NE (P = .035) and increased after stimulation with NE (P = .04). The estimated blood flow in BAT after infusion of NE was markedly lower in db/db mice than in WT mice (P = .02). Estimated kidney blood flow was similar at baseline and decreased in both groups after NE infusion (P = .048 in WT mice and P = .049 in db/db mice). The estimate of muscle blood flow was low at baseline in both WT and db/db mice and remained unchanged after stimulation with NE.
Table 2.
Response of BAT, kidney, and muscle blood flow to NE in WT and db/db mice
| Variable | WT (n = 6)
|
db/db (n= 6)
|
||
|---|---|---|---|---|
| Baseline | NE infusion at 1 μg/kg/min | Baseline | NE infusion at 1 μg/kg/min | |
| BAT (dB/sec) | 0.5 ± 0.1† | 6.4 ± 1.4*,† | 0.2 ± 0.1 | 1.9 ± 0.6* |
|
| ||||
| Kidney (dB/sec) | 11.5 ± 2.4 | 6.0 ± 1.0* | 7.4 ± 1.2 | 4.5 ± 0.3* |
|
| ||||
| Muscle (dB/sec) | 0.5 ± 0.2 | 0.7 ± 0.2 | 0.3 ± 0.04 | 0.4 ± 0.1 |
Data are expressed as mean ± SEM.
P < .05, baseline versus NE infusion.
P < .05, WT versus db/db mice.
BAT Histology
Two lobes of darkly colored adipose tissue were isolated in LFD-fed and HFD-fed WT mice. BAT was composed of small, multilocular, UCP1-positive adipocytes in both LFD-fed and HFD-fed WT mice. Some larger unilocular cells were found within the lobes (Figure 6).
Figure 6.
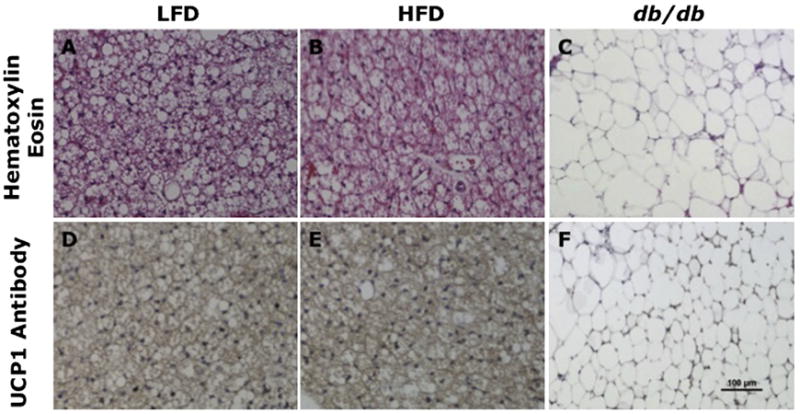
BAT histology and UCP1 immunohistochemistry in WT mice fed an LFD or an HFD and db/db mice. Slices were stained with hematoxylin and eosin (A–C) or with UCP1 antibody (D–F). Magnification 200×. BAT histology was similar in LFD-fed (A) and HFD-fed (B) mice, with small and multilocular cells. BAT in db/db mice (C) included large and unilocular cells with bigger lipid droplets. Intense UCP1 staining is detected in the BAT of LFD-fed (D) and HFD-fed (E) mice, whereas minimal staining is detected in the BAT of db/db mice (F).
In contrast, two large lobes of whitish-appearing adipose tissue were identified between the scapulae of db/db mice. Histologically, adipocytes from db/db mice were larger than those of WT mice, unilocular, and UCP1 negative for most cells (Figure 6).
The BAT of WT mice had a capillary density of 1,036 ± 89 capillaries/mm2, whereas the BAT of db/db mice had a capillary density of 109 ± 7 capillaries/mm2 (P < .0001 vs WT mice; Figure 7).
Figure 7.
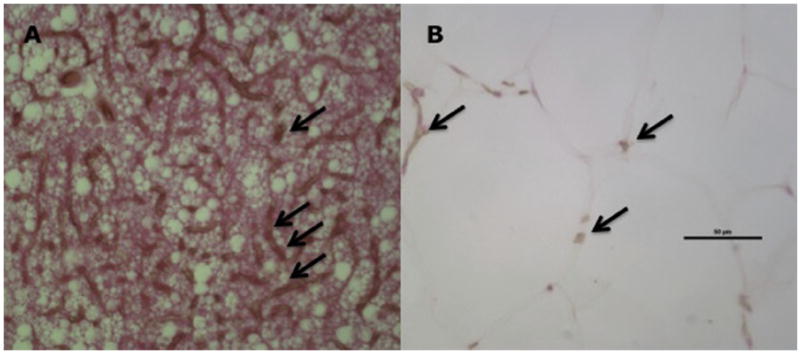
BAT histology and capillary density in WT and db/db mice. BAT capillary density was higher in WT (A) than in db/db (B) mice. Black arrows indicate capillaries. Black bar indicates 50 μm. Magnification 400×.
DISCUSSION
In the present study, CU was validated as a novel noninvasive technique to estimate activated BAT mass in mice and was applied to obesity models. CU-estimated BAT mass correlated with BAT mass obtained at necropsy and was greater in HFD-fed mice than in LFD-fed mice. BAT blood flow and its response to stimulation in obese mice were also investigated. Although the estimate of BAT blood flow and its increase in response to NE were unchanged in a model of mild obesity induced by HFD feeding, estimated BAT blood flow was decreased in severely obese and diabetic db/db mice.
In a previous study,16 we reported that CU could be used to detect BAT and estimate BAT blood flow in mice. In the present study, we demonstrated that CU could also be used to estimate BAT mass in mice (with limitations in case of significantly impaired BAT vascularization). Potential therapies using BAT include increasing BAT mass, so developing a minimally invasive, repeatable measurement of BAT mass in mice models is relevant. Moreover, in the present study, we used CU to detect the impact of obesity, a condition that is of major importance in BAT research, on BAT mass and function.
Measurement of BAT mass using CU in mice was obtained with acceptable intraobserver and interobserver variability (close to those of the two-dimensional left ventricular mass measurement in mice25). Specifically, the intraobserver variability reported in the present study is within the range reported for the echocardiographic determination of the mass of the mouse left ventricle (a standard deviation of 8.9% in the present study vs 8.7% in the study by Collins et al.25). The interobserver variability is slightly more elevated (a standard deviation of 10.7% vs 6.3%), which appears to be due mainly to a difference of interpretation in the most peripheral views of the BAT. However, one can note that the echocardiographic interobserver variability of other components of left ventricular mass in the mice that are routinely used in mice studies (e.g., wall thickness) is greater than the variability of BAT measurement.26 Thus, CU can measure BAT mass in mice.
Recently, Chen et al.23 reported that the estimation of BAT mass by magnetic resonance imaging was correlated fairly with BAT mass at necropsy (R2 = 0.6) in rats, but no noninvasive method to measure BAT mass in mice has been validated. Our study validates CU in the measurement of BAT mass in mice. CU-derived BAT mass measurements was closely correlated with BAT mass at necropsy (R2 = 0.83). This correlation was obtained with 15 mice, a sample size frequently used for validation of novel echocardiographic measurements or techniques.27-31 The correlation coefficient was similar to the highest correlation coefficient obtained by Collins et al.25 when comparing different echocardiographic algorithms for the measurement of left ventricular mass. The advantages of the CU approach compared with necropsy is that it is relatively noninvasive, the imaging acquisition is quick, and the technique may be used serially to monitor the effect of interventions on BAT.
Nonetheless, CU overestimated BAT mass, in particular for the lowest weights. One possible explanation for the overestimation of BAT mass by CU lies in the assumption that BAT density is homogeneous. Similar to our findings, other investigators have described the presence of unilocular white adipocytes in the BAT,32 which have a lower density than the rest of the BAT, as their lipid content is higher. The presence of these large lipid droplets may decrease the density of the whole BAT lobe without decreasing its volume. Another factor that may contribute to BAT mass overestimation is the difficulty to dissect BAT from the surrounding white adipose tissue, an error that would be proportionally higher for the lowest weights.
In the present study, BAT mass was augmented after 2 months of HFD feeding, an intervention that induces mild obesity. Blood flow in the BAT of HFD-fed mice was similar to that of mice fed an LFD. Rothwell et al.33,34 reported that rats fed a “cafeteria diet” for 9 to 14 days had higher BAT mass and BAT blood flow responses to NE measured by microspheres compared with rats fed a control diet.9,33 Using a similar diet duration as these investigators, Ma et al.35 reported that oxygen consumption was also greater in rats fed a cafeteria diet than in control rats and hypothesized that the purpose of BAT mass increase was to dissipate excess energy due to HFD feeding and to limit the weight gain during overnutrition. Interestingly, it therefore appears that during a short duration of over-feeding, BAT blood flow and mass may increase. In the present study, mice were fed an LFD or HFD for 2 months. HFD-fed mice were obese compared with LFD-fed mice, whereas the rats fed a cafeteria diet for shorter periods of time33,35 did not increase their weights compared with their control diet–fed counterparts. During the longer period of HFD feeding used in the present study, BAT mass was increased, but blood flow was similar in mice fed an HFD compared with mice fed an LFD. Thus, the increase in BAT blood flow observed during short durations of HFD feeding may decrease as the length of HFD feeding increases. As BAT blood flow is coupled with its activation,16,36 the lack of increased blood flow in long-term HFD feeding may reflect a blunting of the initial compensatory increase in BAT function.
BAT mass could not be measured by CU in db/db mice, a limitation of this technique, reflecting the very abnormal (and poorly functioning) BAT cells and paucity of BAT vessels in this model. The vascularization of the BAT in healthy or mildly obese mice is much denser than that of the neighboring white adipose tissue, allowing excellent distinction between the tissues using CU. The difference in vascularization between BAT and its neighboring tissues has been underlined in several anatomic studies.9,37,38 Moreover, the difference in blood flow is considerably increased by sympathetic nervous system activation (in the present study by NE infusion), which augments BAT perfusion 15-fold to 20-fold (in the present study and in Foster and Frydman15 and Foster39) but does not change the white adipose tissue blood flow.15
Capillary density in BAT had not been previously measured. We report capillary densities of 1,036 ± 89 capillaries/mm2 in the BAT of WT mice and 109 ± 7 capillaries/mm2 in the BAT of db/db mice. The low density of capillaries in db/db mice (one capillary of approximately 5 μm in diameter40 every 100 μm) did not allow clear tracing of the BAT. Such a low vascular density, however, is found in few organs. For example, skeletal muscles are vascularized by approximately 1,000 capillaries/mm2,41 and >2,700 capillaries/mm2 are measured in the left ventricle.42 A comparable capillary density as that found in the BAT of db/db mice is reported in white adipose tissue of WT mice fed a standard diet (370 capillaries/mm2),43 suggesting that delineating white adipose tissue volume using perfusion imaging may be difficult. On the basis of the results of the present study, however, the measurement of blood flow (as contrasted with tissue volume) in sparsely vascularized adipose tissues appears to be feasible.
BAT estimated blood flow in severely obese db/db mice was lower than that of WT mice before and after NE infusion. Although BAT blood flow has not been investigated in db/db mice, BAT thermogenic response to cold and BAT UCP1 messenger ribonucleic acid increase in response to cold are impaired.44,45 Furthermore, the structure of BAT in db/db mice is markedly altered. Thus, it is not unexpected that BAT blood flow and its response to stimulation are abnormal in db/db mice.
It is important to note that, as in all research involving mice models, anesthetic conditions are a crucial aspect of the experiments, as they greatly influence all physiologic parameters. In the experiment investigating the HFD, a tail vein infusion was used, as this technique allows less invasive surgery, milder anesthesia, and more opportunity to obtain serial measurements than a jugular venous line. The different anesthetic regimens did have an effect on the blood flow, both in the BAT (higher increase with NE with milder anesthesia) and in the kidney (no detectable change with NE with milder anesthesia).
It is unknown whether the findings in mice can be translated to humans and which mouse model of obesity best resembles human obesity. Measurement of BAT volume in humans has been attempted using FDG PET. Van Marken Lichtenbelt et al.11 reported a nonsignificant difference between the BAT volume of overweight and lean subjects (77 ± 69 vs 130 ± 98 cm3, respectively). It is to be noted, however, that the PET-derived BAT volume measurement also reflects the uptake of FDG by BAT and therefore BAT activation. BAT blood flow has not been measured in obese humans, but a fair correlation has been reported in lean humans between BAT blood flow and FDG uptake.36 Thus, it is conceivable that in obese humans with decreased FDG uptake, BAT blood flow may also be impaired.
CONCLUSIONS
The present study validates CU imaging as a novel noninvasive method to estimate BAT mass in lean and obese mice. Although CU measurements of BAT mass are not reliable when BAT vascularization is significantly impaired, which might limit the feasibility of the technique in some mice models, CU could be used to detect and monitor BAT in the development of antiobesity therapies that modulate BAT mass.
Acknowledgments
This work was supported by grant R21-DK092909 from the National Institutes of Health (Bethesda, MD; to M.S.-C.), by Scientist Development Grant 10SDG2610313 from the American Heart Association (Dallas, TX; to E.S.B.), and by a grant from Fondation LeDucq (to K.D.B). Definity was generously provided by Lantheus Medical Imaging, Inc. (North Billerica, MA).
Abbreviations
- BAT
Brown adipose tissue
- CU
Contrast ultrasound
- FDG
18F-fluorodeoxyglucose
- HFD
High-fat diet
- LFD
Low-fat diet
- NE
Norepinephrine
- PET
Positron emission tomography
- UCP1
Uncoupling protein 1
- WT
Wild-type
References
- 1.Peeters A, Barendregt JJ, Willekens F, Mackenbach JP, Al Mamun A, Bonneux L NEDCOM, the Netherlands Epidemiology and Demography Compression of Morbidity Research Group. Obesity in adulthood and its consequences for life expectancy: a life-table analysis. Ann Intern Med. 2003;138:24–32. doi: 10.7326/0003-4819-138-1-200301070-00008. [DOI] [PubMed] [Google Scholar]
- 2.Wing RR, Phelan S. Long-term weight loss maintenance. Am J Clin Nutr. 2005;82(suppl):222S–5. doi: 10.1093/ajcn/82.1.222S. [DOI] [PubMed] [Google Scholar]
- 3.Melnikova I, Wages D. Anti-obesity therapies. Nat Rev Drug Discov. 2006;5:369–70. doi: 10.1038/nrd2037. [DOI] [PubMed] [Google Scholar]
- 4.Yanovski SZ. Pharmacotherapy for obesity—promise and uncertainty. N Engl J Med. 2005;353:2187–9. doi: 10.1056/NEJMe058243. [DOI] [PubMed] [Google Scholar]
- 5.Connolly HM, Crary JL, McGoon MD, Hensrud DD, Edwards BS, Edwards WD, et al. Valvular heart disease associated with fenfluramine-phentermine. N Engl J Med. 1997;337:581–8. doi: 10.1056/NEJM199708283370901. [DOI] [PubMed] [Google Scholar]
- 6.Glazer G. Long-term pharmacotherapy of obesity 2000: a review of efficacy and safety. Arch Intern Med. 2001;161:1814–24. doi: 10.1001/archinte.161.15.1814. [DOI] [PubMed] [Google Scholar]
- 7.Christensen R, Kristensen PK, Bartels EM, Bliddal H, Astrup A. Efficacy and safety of the weight-loss drug rimonabant: a meta-analysis of randomised trials. Lancet. 2007;370:1706–13. doi: 10.1016/S0140-6736(07)61721-8. [DOI] [PubMed] [Google Scholar]
- 8.Cannon B. Brown adipose tissue: function and physiological significance. Physiol Rev. 2004;84:277–359. doi: 10.1152/physrev.00015.2003. [DOI] [PubMed] [Google Scholar]
- 9.Rauch JC, Hayward JS. Topography and vascularization of brown fat in a small nonhibernator (deer mouse, Peromyscus maniculatus) Can J Zool. 1969;47:1301–14. doi: 10.1139/z69-203. [DOI] [PubMed] [Google Scholar]
- 10.Virtanen KA, Lidell ME, Orava J, Heglind M, Westergren R, Niemi T, et al. Functional brown adipose tissue in healthy adults. N Engl J Med. 2009;360:1518–25. doi: 10.1056/NEJMoa0808949. [DOI] [PubMed] [Google Scholar]
- 11.van Marken Lichtenbelt WD, Vanhommerig JW, Smulders NM, Drossaerts JM, Kemerink GJ, Bouvy ND, et al. Cold-activated brown adipose tissue in healthy men. N Engl J Med. 2009;360:1500–8. doi: 10.1056/NEJMoa0808718. [DOI] [PubMed] [Google Scholar]
- 12.Cypess AM, Lehman S, Williams G, Tal I, Rodman D, Goldfine AB, et al. Identification and importance of brown adipose tissue in adult humans. N Engl J Med. 2009;360:1509–17. doi: 10.1056/NEJMoa0810780. [DOI] [PMC free article] [PubMed] [Google Scholar]
- 13.Rothwell NJ, Stock MJ. A role for brown adipose tissue in diet-induced thermogenesis. Nature. 1979;281:31–5. doi: 10.1038/281031a0. [DOI] [PubMed] [Google Scholar]
- 14.Foster DO, Frydman ML. Nonshivering thermogenesis in the rat. II. Measurements of blood flow with microspheres point to brown adipose tissue as the dominant site of the calorigenesis induced by noradrenaline. Can J Physiol Pharmacol. 1978;56:110–22. doi: 10.1139/y78-015. [DOI] [PubMed] [Google Scholar]
- 15.Foster DO, Frydman ML. Tissue distribution of cold-induced thermogenesis in conscious warm- or cold-acclimated rats reevaluated from changes in tissue blood flow: the dominant role of brown adipose tissue in the replacement of shivering by nonshivering thermogenesis. Can J Physiol Pharmacol. 1979;57:257–70. doi: 10.1139/y79-039. [DOI] [PubMed] [Google Scholar]
- 16.Baron DM, Clerte M, Brouckaert P, Raher MJ, Flynn AW, Zhang H, et al. In vivo noninvasive characterization of brown adipose tissue blood flow by contrast ultrasound in mice. Circ Cardiovasc Imaging. 2012;5:652–9. doi: 10.1161/CIRCIMAGING.112.975607. [DOI] [PMC free article] [PubMed] [Google Scholar]
- 17.Scherrer-Crosbie M, Rodrigues ACT, Hataishi R, Picard MH. Infarct size assessment in mice. Echocardiography. 2007;24:1–7. doi: 10.1111/j.1540-8175.2007.00357.x. [DOI] [PubMed] [Google Scholar]
- 18.Lemieux S, Prud’homme D, Bouchard C, Tremblay A, Després JP. Sex differences in the relation of visceral adipose tissue accumulation to total body fatness. Am J Clin Nutr. 1993;58:463–7. doi: 10.1093/ajcn/58.4.463. [DOI] [PubMed] [Google Scholar]
- 19.Nadal-Casellas A, Bauzá-Thorbrügge M, Proenza AM, Gianotti M, Lladó I. Sex-dependent differences in rat brown adipose tissue mitochondrial biogenesis and insulin signaling parameters in response to an obesogenic diet. Mol Cell Biochem. 2012;373:125–35. doi: 10.1007/s11010-012-1481-x. [DOI] [PubMed] [Google Scholar]
- 20.Nookaew I, Svensson PA, Jacobson P, Jernas M, Taube M, Larsson I, et al. Adipose tissue resting energy expenditure and expression of genes involved in mitochondrial function are higher in women than in men. J Clin Endocrinol Metab. 2013;98:E370–8. doi: 10.1210/jc.2012-2764. [DOI] [PMC free article] [PubMed] [Google Scholar]
- 21.Ohlson KB, Mohell N, Cannon B, Lindahl SG, Nedergaard J. Thermogenesis in brown adipocytes is inhibited by volatile anesthetic agents. A factor contributing to hypothermia in infants? Anesthesiology. 1994;81:176–83. doi: 10.1097/00000542-199407000-00024. [DOI] [PubMed] [Google Scholar]
- 22.Dossantos RA. Evidence for a compensated thermogenic defect in transgenic mice lacking the mitochondrial glycerol-3-phosphate dehydrogenase gene. Endocrinology. 2003;144:5469–79. doi: 10.1210/en.2003-0687. [DOI] [PubMed] [Google Scholar]
- 23.Chen YI, Cypess AM, Sass CA, Brownell A-L, Jokivarsi KT, Kahn CR, et al. Anatomical and functional assessment of brown adipose tissue by magnetic resonance imaging. Obesity (Silver Spring) 2012;20:1519–26. doi: 10.1038/oby.2012.22. [DOI] [PMC free article] [PubMed] [Google Scholar]
- 24.Wei K, Jayaweera AR, Firoozan S, Linka A, Skyba DM, Kaul S. Quantification of myocardial blood flow with ultrasound-induced destruction of microbubbles administered as a constant venous infusion. Circulation. 1998;97:473–83. doi: 10.1161/01.cir.97.5.473. [DOI] [PubMed] [Google Scholar]
- 25.Collins KA, Korcarz CE, Shroff SG, Bednarz JE, Fentzke RC, Lin H, et al. Accuracy of echocardiographic estimates of left ventricular mass in mice. Am J Physiol Heart Circ Physiol. 2001;280:H1954–62. doi: 10.1152/ajpheart.2001.280.5.H1954. [DOI] [PubMed] [Google Scholar]
- 26.Yang XP, Liu YH, Rhaleb NE, Kurihara N, Kim HE, Carretero OA. Echocardiographic assessment of cardiac function in conscious and anesthetized mice. Am J Physiol. 1999;277:H1967–74. doi: 10.1152/ajpheart.1999.277.5.H1967. [DOI] [PubMed] [Google Scholar]
- 27.Tournoux F, Petersen B, Thibault H, Zou L, Raher MJ, Kurtz B, et al. Validation of noninvasive measurements of cardiac output in mice using echocardiography. J Am Soc Echocardiogr. 2011;24:465–70. doi: 10.1016/j.echo.2010.12.019. [DOI] [PMC free article] [PubMed] [Google Scholar]
- 28.Gao XM, Dart AM, Dewar E, Jennings G, Du XJ. Serial echocardiographic assessment of left ventricular dimensions and function after myocardial infarction in mice. Cardiovasc Res. 2000;45:330–8. doi: 10.1016/s0008-6363(99)00274-6. [DOI] [PubMed] [Google Scholar]
- 29.Fard A, Wang CY, Takuma S, Skopicki HA, Pinsky DJ, Di Tullio MR, et al. Noninvasive assessment and necropsy validation of changes in left ventricular mass in ascending aortic banded mice. J Am Soc Echocardiogr. 2000;13:582–7. doi: 10.1067/mje.2000.105630. [DOI] [PubMed] [Google Scholar]
- 30.Benavides-Vallve C, Corbacho D, Iglesias-Garcia O, Pelacho B, Albiasu E, Castaño S, et al. New strategies for echocardiographic evaluation of left ventricular function in a mouse model of long-term myocardial infarction. PLoS ONE. 2012;7:e41691. doi: 10.1371/journal.pone.0041691. [DOI] [PMC free article] [PubMed] [Google Scholar]
- 31.Feldman MD, Erikson JM, Mao Y, Korcarz CE, Lang RM, Freeman GL. Validation of a mouse conductance system to determine LV volume: comparison to echocardiography and crystals. Am J Physiol Heart Circ Physiol. 2000;279:H1698–707. doi: 10.1152/ajpheart.2000.279.4.H1698. [DOI] [PubMed] [Google Scholar]
- 32.Cinti S, Frederich RC, Zingaretti MC, De Matteis R, Flier JS, Lowell BB. Immunohistochemical localization of leptin and uncoupling protein in white and brown adipose tissue. Endocrinology. 1997;138:797–804. doi: 10.1210/endo.138.2.4908. [DOI] [PubMed] [Google Scholar]
- 33.Rothwell NJ, Stock MJ. Influence of noradrenaline on blood flow to brown adipose tissue in rats exhibiting diet-induced thermogenesis. Pflugers Arch. 1981;389:237–42. doi: 10.1007/BF00584784. [DOI] [PubMed] [Google Scholar]
- 34.Rothwell NJ, Saville ME, Stock MJ. Effects of feeding a “cafeteria” diet on energy balance and diet-induced thermogenesis in four strains of rat. J Nutr. 1982;112:1515–24. doi: 10.1093/jn/112.8.1515. [DOI] [PubMed] [Google Scholar]
- 35.Ma SW, Foster DO, Nadeau BE, Triandafillou J. Absence of increased oxygen consumption in brown adipose tissue of rats exhibiting “cafeteria” diet-induced thermogenesis. Can J Physiol Pharmacol. 1988;66(11):1347–54. doi: 10.1139/y88-221. [DOI] [PubMed] [Google Scholar]
- 36.Orava J, Nuutila P, Lidell ME, Oikonen V, Noponen T, Viljanen T, et al. Different metabolic responses of human brown adipose tissue to activation by cold and insulin. Cell Metab. 2011;14:272–9. doi: 10.1016/j.cmet.2011.06.012. [DOI] [PubMed] [Google Scholar]
- 37.Hudecki MS, Privitera CA. Light microscopic and fine structural changes in the brown adipose tissue from torpid and aroused pigmy mice (Baiomys taylori) J Exp Zool. 1972;181:129–43. doi: 10.1002/jez.1401810114. [DOI] [PubMed] [Google Scholar]
- 38.Lever JD, Nnodim JO, Symons D. Arteriovenous anastomoses in interscapular brown adipose tissue in the rat. J Anat. 1985;143:207–10. [PMC free article] [PubMed] [Google Scholar]
- 39.Foster DO. Evidence against a mediatory role of brown adipose tissue in the calorigenic response of cold-acclimated rats to noradrenaline. Can J Physiol Pharmacol. 1974;52:1051–62. doi: 10.1139/y74-139. [DOI] [PubMed] [Google Scholar]
- 40.Mayrovitz HN. Skin capillary metrics and hemodynamics in the hairless mouse. Microvasc Res. 1992;43:46–59. doi: 10.1016/0026-2862(92)90005-a. [DOI] [PubMed] [Google Scholar]
- 41.Grange RW, Meeson A, Chin E, Lau KS, Stull JT, Shelton JM, et al. Functional and molecular adaptations in skeletal muscle of myoglobin-mutant mice. Am J Physiol Cell Physiol. 2001;281:C1487–94. doi: 10.1152/ajpcell.2001.281.5.C1487. [DOI] [PubMed] [Google Scholar]
- 42.Scherrer-Crosbie M, Ullrich R, Bloch KD, Nakajima H, Nasseri B, Aretz HT, et al. Endothelial nitric oxide synthase limits left ventricular remodeling after myocardial infarction in mice. Circulation. 2001;104:1286–91. doi: 10.1161/hc3601.094298. [DOI] [PubMed] [Google Scholar]
- 43.Lijnen HR. Impaired adipose tissue development in mice with inactivation of placental growth factor function. Diabetes. 2006;55:2698–704. doi: 10.2337/db06-0526. [DOI] [PubMed] [Google Scholar]
- 44.Masaki T, Yoshimatsu H, Chiba S, Sakata T. Impaired response of UCP family to cold exposure in diabetic (db/db) mice. Am J Physiol Regul Integr Comp Physiol. 2000;279:R1305–9. doi: 10.1152/ajpregu.2000.279.4.R1305. [DOI] [PubMed] [Google Scholar]
- 45.Trayhurn P. Thermoregulation in the diabetic-obese (db/db) mouse. The role of non-shivering thermogenesis in energy balance. Pflugers Arch. 1979;380:227–32. doi: 10.1007/BF00582901. [DOI] [PubMed] [Google Scholar]