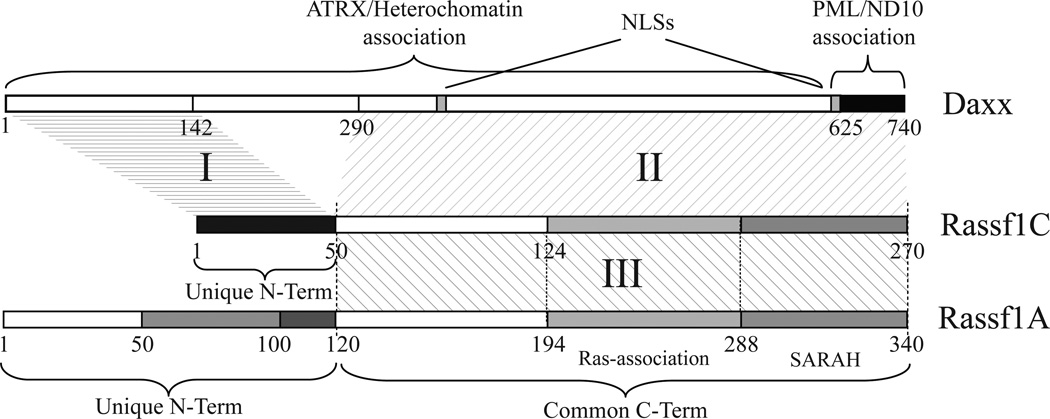
Figure 3. Mapping Daxx and Rassf1 regions of interaction.
Diagram depicting human Daxx, Rassf1A and Rassf1C and their mutual regions of interaction summarizing results obtained by in vitro pull down assay (Fig. S3). The fist region of interaction (I) was identified between Daxx first 142 aa and Rassf1C unique N-terminus. The second region of interaction (II) is mapped between Daxx C-terminus (Daxx 290-740) and Rassf1C/A common region. The third region (III) involves the common region of Rassf1A and Rassf1C indicating that the two molecules may homo- or hetero-dimerize via their common region.

