Abstract
We describe a microfluidic device for the extraction, purification and stretching of human chromosomal DNA from single cells. A two-dimensional array of micropillars in a microfluidic polydimethylsiloxane channel was designed to capture a single human cell. Megabase-long DNA strands released from the cell upon lysis are trapped in the micropillar array and stretched under optimal hydrodynamic flow conditions. Intact chromosomal DNA is entangled in the array, while other cellular components are washed from the channel. To demonstrate the entrapment principle, a single chromosome was hybridized to whole chromosome paints, and imaged by fluorescence microscopy. DNA extracted from a single cell and small cell populations (less than 100) was released from the device by restriction endonuclease digestion under continuous flow and collected for offchip analysis. Quantification of the extracted material reveals that the microdevice efficiently extracts essentially all chromosomal DNA. The device described represents a novel platform to perform a variety of analyses on chromosomal DNA at the single cell level.
Introduction
Genome-wide analysis of single cells is important in life science research and modern medicine in applications ranging from cancer diagnosis to understanding tissue development.1,2 Microfluidic devices have been explored for single cell studies, enabling handling of minute sample and reagent volumes in engineered microstructures.3–8 Microfluidic devices operate in an enclosed system, thereby reducing the chance for human error and cross contamination. Furthermore, the low reagent volumes needed give microfluidic devices a distinct advantage in lowering the cost of operation. Isolation of nucleic acids from biological samples is an essential step for genetic analysis. While numerous extraction methods have been explored,9–14 it remains challenging to isolate and analyze genomic DNA from small cell populations and single cells. Traditional microfluidic platforms utilize solid phase extraction (SPE),14 a method dependent upon the binding of DNA to solid phase matrices such as silica14 or functionalized magnetic microparticles,15 for extraction of nucleic acids from cell lysates. Various surface treatment protocols have been developed to enhance the affinity of the surface of microdevices to nucleic acids,12–14 however, this binding affinity is extremely sensitive to factors such as pH, temperature, and buffer compositions which often require dynamic control in order to minimize DNA losses. Additionally, other components of the cellular lysate may potentially inhibit or interfere with the intended binding reactions. For example, negatively charged proteins in the cell lysate can decrease the efficiency of extraction by interacting with positively charged surfaces within the device. Even when the binding chemistry is optimized, because it is an equilibrium process, it is difficult to ensure that all of the DNA fragments are adsorbed on the solid phase matrix and that the whole genome is represented in purified extracts. An appreciable fraction of genomic DNA is often lost during the purification process when the cell debris is washed away. Additional DNA losses can be caused by incomplete elution. As a result, the current state-of-the-art microfluidic devices for DNA separation from cell lysates exhibit extraction efficiencies of 60–90%.10 This level of extraction is sufficient for genetic analysis of large cellular populations as multiple copies of every gene are present within the extract, which statistically guarantees complete genome representation, but such collection losses are undesirable when single-copy genes in a single cell are being investigated. Even with improved yield, it is fundamentally difficult to apply SPE techniques to single cell studies due to manufacturing complexities and technical challenges associated with manipulation of small volumes of fluids. Current microfluidic devices with such capabilities rely on complicated fluidic networks of channels, valves, reaction chambers (or droplets) for storing, transporting, and mixing picoliter volumes of sample and reagents.5,6 Fundamentally different approaches to isolation of genomic DNA for characterization of single cells should be explored.
This work describes a simple, valveless, two-port microfluidic device capable of efficient isolation and fluorescent analysis of DNA from single cells by trapping and elongating long strands of human genomic DNA in a two-dimensional array of micropillars. The flow of DNA through arrays of obstacles results in entanglement and immobilization if the fragment size is sufficiently large.16 Although DNA transport in obstacle arrays have been studied extensively for fragment size separation and stretching,17–19 entrapment under conditions of hydrodynamic flow has yet to be used to extract and purify human chromosomal DNA from single cells. This approach is fundamentally different from the conventional microchip-based SPE as well as from physical filtration through nanopores, which can cause DNA shearing and often results in device failure due to clogging issues.20 In the microfluidic device presented here, long strands of human chromosomal DNA released from cells through chemical lysis are looped around PDMS micropillars and are physically retained while the remaining cellular contents are washed away under hydrodynamic flow. In this manner, large genomic DNA is separated from a multitude of cellular debris such as proteins and lipid membrane fragments as well as from much smaller mitochondrial DNA and RNA. Random DNA fragmentation is minimized by operating at low flow rates. This physical extraction method provides several unique capabilities that make it attractive for genetic and epigenetic analysis of DNA contents of single cells. For example, our results suggest the device can be used to stretch largely intact human chromosomal DNA for genome-wide analysis by fluorescent in situ hybridization (FISH) of specific sequences,21 a process that has been successfully performed so far only on significantly shorter fragments of combed22,23 and hydrodynamically24 extended DNA. Unlike combed nucleic acids, hydrodynamically trapped DNA in the microchannel is only in direct contact with solid surfaces at the micropillars, thus improving the binding accessibility of site-specific fluorescent tags and reducing hybridization times. The suspended DNA can also be released from the microarrays by enzymatic digestion with restriction endonucleases and subsequently collected for downstream analysis of the digestion product in nanofluidic channels by DNA fragment sizing25 or multicolor fluorescence analysis.26 Genome-wide analysis of DNA contents of single cells could thus be performed one molecule at a time, without the need for amplification. To demonstrate the applicability and utility of the presented microfuidic device regarding single cell analysis, the device was used to extract, purify, stretch, hybridize and quantify DNA from single human cells.
Materials and methods
Device design and fabrication
To fabricate the master molds, Microposit S1813 photoresist (Shipley; Marlborough, MA) was spun on silicon on insulator (SOI) wafers (Ultrasil; Hayward, CA) and exposed by UV contact lithography (EVG620, EVG Group; Albany, NY). The exposed resist was developed in 726MIF developer (Microchemicals) and the pattern was transferred into the 20 µm-thick top silicon layer by Bosch process in a Unaxis SLR 770 deep reactive ion etching system (Unaxis USA Inc.; St. Petersburg, FL). A monolayer of (1H,1H,2H,2H-Perfluorooctyl)Trichlorosilane was deposited on the etched wafers in a MVD100 molecular wafer deposition system (Applied Microstructures; San Jose, CA) to prevent sticking of the PDMS to the mold. Sylgard 184 (Dow Corning; Midland, MI) PDMS base resin was mixed with the curing agent at a 10 : 1 ratio, degassed under vacuum at room temperature, poured onto the master, and cured for 45 min at 150 °C. The elastomer casting was then peeled off the mold and access holes to the input and outputs of the microchannels were created with a 1.5 mm biopsy punch (Sklar Instruments; West Chester, PA). To complete channel fabrication, the patterned PDMS was treated with oxygen plasma for 1 min and bonded to a 170-µm thick fused silica wafer (Mark Optics; Santa Ana, CA).
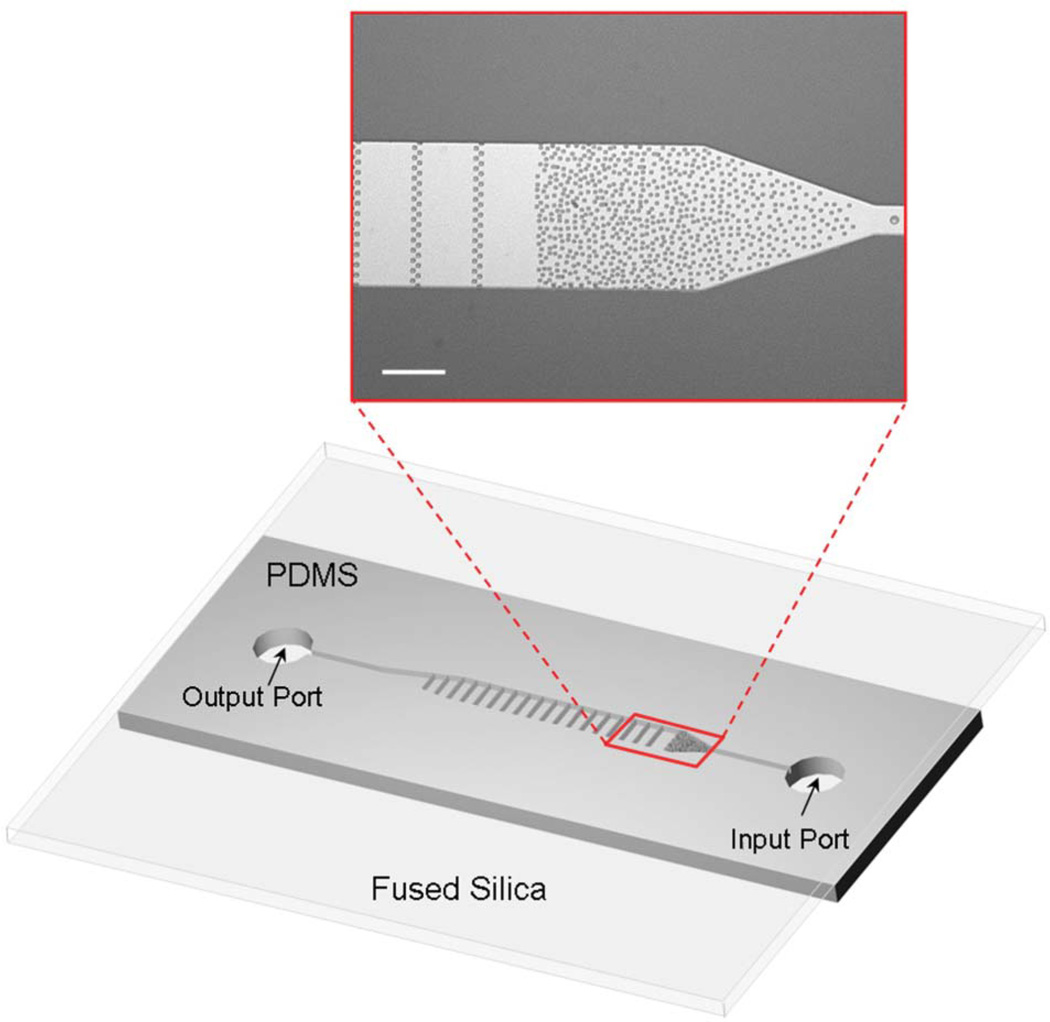
Fig. 1 shows the device schematic and photomicrograph of a section of the fabricated microchannels supporting the random array of PDMS micropillars. The microchannels are 240 µm wide, 20 µm deep and up to 70 mm long. The array of microposts (5 µm wide and 20 µm tall) was designed with a gradient in spacing to create obstacles for cell capture. The average gap between the microposts varies continuously from 15 µm to 2 µm along the channel. Though intended primarily for single cell analysis, the device can hold up to approximately 20 cells with a broad size distribution without clogging the channel. The extraction method can be scaled up to perform extraction of larger quantities of DNA from thousands of cells by broadening the microchannels. The 500 µm-long array of micropillars also provides a solid phase matrix for immobilization of chromosomal DNA. Random placement of micropillars maximizes the number of collisions of DNA with solid surfaces, thereby preventing DNA strands from easily slipping throught the structure. Linear arrays of micropillars spanning the channel width, spaced by 100 µm throughout the microchannel, were also incorportated to provide support and thus minimize shear-induced damage of the hundreds of megabases long DNA strands. To avoid strong electrostatic adsorption of DNA to both the channel walls and the micropillars, the microchannels were initially primed with a 1% (wt) solution of polyvinylpyrollidone (PVP) (Fluka; St. Louis, MO) and 1% (wt) bovine serum albumin (BSA) (Sigma-Aldrich) in Tris-EDTA-saline (TES) buffer (10 mM Tris-HCl, pH 8.0, 20 mM EDTA, 100 mM NaCl) for 5 h. The coated microchannels were rinsed with TES buffer for 1 h at a rate of 30 nl min−1 at room temperature prior to experiments.
Fig. 1.
Microfluidic device schematic and a photomicrograph of the channel with the random array of micropillar obstacles for cell capture and DNA extraction; the scale bar corresponds to 100 µm.
Cell culture
M0-91 hematopoietic stem cells (acute myeloid leukemia M0-derived cell line) were cultured in Dulbecco’s Modified Eagle medium (DMEM) (Invitrogen) at 37 °C and 5% CO2 in a T25 flask. DMEM cell culture media was supplemented with DMEM High Glucose 1× (Gibco 11965), 100× non-essential amino acids (Gibco 11140), sodium pyruvate, 100 mM (100×) (Gibco 11360), 100× penicillin streptomycin (Gibco 15140), 1 M HEPES buffer solution, (Gibco 15630), 2-mercaptoethanol (1 : 100 dilution in water) (Sigma 63689), and 10% (wt) fetal bovine serum (Atlanta Biologicals S11150). Cells were split every three days into equal volumes of fresh media.
Microscopy and experimental setup
The silica wafer containing the microfluidic devices for DNA extraction was placed on an in-house fabricated heating stage which was mounted on an Olympus IX70 inverted microscope (Olympus; Center Valley, PA). Stage temperature was controlled with a Model 1146D heated/refrigerated recirculator (VWR; Randor, PA). The microscope used for sample visualization was equipped with a 10× objective (Plan APO, N.A. 0.45), a 20× objective (Plan APO, N.A. 0.60), a 60× water immersion objective (Olympus UPlanSApo 60×/1.2 W), an X-Cite® 120 mercury light source (Lumen Dynamics; Mississaugua, ON); a 485/535 nm filter cube (Chroma; Bellow Falls, VT), and a Cascade II charge-coupled device (CCD) camera (Photometrics; Tucson, AZ). A 100 µL gas-tight syringe (Hamilton; Reno, NV) was connected to the microchannel via PEEK™ polymer tubing (I.D. = 254 µm, O.D. = 1.58 mm) which was inserted into the output of the microdevice. Cells and reagents were delivered into the microdevice with a PHD 2000 syringe pump (Harvard Apparatus; Holliston, MA) at a 30 nL min−1 flow rate.
Cell capture and lysis
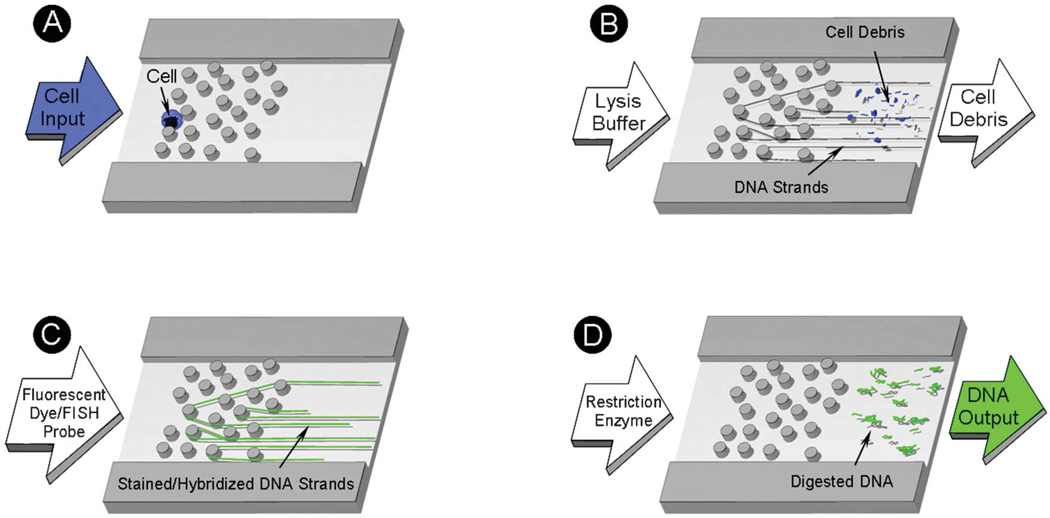
A solution containing M0-91 cells suspended in original culturing media was injected into the input port of the microdevice and drawn under a constant flow into a random array of micropillars in which the cells become immobilized as shown in Fig. 2A. The pressure driven flow was interrupted when a single cell was captured in the microarray and the input port was repeatedly rinsed to remove any remaining cells. The microchannel with a single immobilized cell was then rinsed with a TES buffer to remove residues of the cell culture growth medium and lysed with a solution containing 1% (wt) sodium dodecyl sulfate (SDS) in the same buffer. Long strands of the released chromosomal DNA became entangled in the microchannel under hydrodynamic flow while the unwanted components of the cell lysate such as proteins, lipid membrane fragments, non-genomic DNA, and RNA were washed away.
Fig. 2.
Schematic representation of the microfluidic device operation: (A) a single cell is captured in the random array of micropillars by size exclusion; (B) the cell is lysed with a surfactant solution which removes the cell debris and strips off proteins from genomic DNA, leaving it entrapped in the micropillar array; (C) the DNA is intercalated with PicoGreen® or hybridized with FISH probes; and (D) the DNA is released from the array by enzymatic digestion with restriction endonucleases.
DNA purification and visualization
The immobilized genomic DNA was rinsed and purified by flowing a buffer containing proteinase K (Qiagen; Valencia, CA) through the microchannels to remove any remaining proteins bound to the stretched DNA strands. Thorough removal of the cellular debris and the lysis agent is often desirable for sample preparation to prevent interference with downstream processes such as polymerase chain reaction (PCR) amplification or single-molecule fluorescence analysis.25,26 The trapped chromosomal DNA was fluorescently labelled using the DNA intercalating fluorescent dye PicoGreen® (Invitrogen; Carlsbad, CA) and visualized with the fluorescence microscopy setup described in Microscopy and Experimental Setup section. Background fluorescence inside the microchannel was reduced by washing off the unbound dye surrounding the entrapped chromosomal DNA.
Chromosomal painting
To show how individual strands of genomic DNA are trapped, chromosome 17 was hybridized to whole chromosome paints (Human IDetect FISH Probes, IDlabs Inc.; London, ON). Genomic DNA and chromosome 17 probe were co-denatured in 2× SSC buffer (30 mM citrate, pH 7, 300 nM NaCl) and 50% formamide at 90 °C for 5 to 10 min. Hybridization was performed at 40 °C for 1 to 2 h. Excess probe was washed away with 2× SSC buffer at room temperature. TES buffer was used for fluorescence imaging.
DNA release and off-chip quantitation
To determine the extraction efficiency of the microfluidic device, the entrapped DNA strands were fragmented, collected, and quantified by fluorescence analysis using the Quant-iT PicoGreen dsDNA assay (Invitrogen). The assay is selective to double stranded DNA (dsDNA) and has been shown to be an efficient means to quantify small amounts of dsDNA. The assay is also insensitive to common nucleic acid contaminants such as proteins salts and detergents.31 Fluorescently labelled genomic DNA suspended in the microchannel was released from the device by enzymatic digestion with BamHI (Invitrogen) restriction endonuclease as illustrated in Fig. 2D. To optimize the digestion process, the microchannels were heated to 37 °C prior to the introduction of restriction enzymes and kept at that temperature during the digestion process. The fragmentation process was monitored in real time by observing PicoGreen® fluorescence with a CCD camera. Since the total DNA content of a single human diploid cell (~6.6 pg)27 is not sufficient for reliable off-chip fluorospectrometric quantification, the analysis was performed with larger quantities of M0-91 cells loaded into the obstacle array. The DNA trapped in the microchannel was eluted at 100 nL min−1 flow into less than 200 nL of 1× Digestion Buffer K (Invitrogen). Sample dilutions were controlled simply by adjusting the flow rates. To facilitate off-chip sample manipulation, the released DNA was diluted further by flowing an additional 20 µL of TE buffer through the microdevice. The total extract was collected in the polymer tubing that connects the syringe to the output channel. Once filled with fragmented DNA, the tubing was disconnected from the device and its contents were injected into a 0.2 ml Eppendorf tube for off-chip quantification. Thus, purified DNA from the known number of cells was suspended in 20 µL of TE buffer. Solutions containing DNA extracts obtained from the microchannels were diluted with an equal amount of PicoGreen® in TE buffer (1 : 100, 1 : 200 final) and their fluorescence intensity was measured using a NanoDrop 3300 fluorospectrometer (Thermo Scientific; Wilmington, DE). The instrument only requires a small amount of sample per measurement (1 to 2.5 µL), thereby allowing multiple measurements (N = 10) to be taken for each extract. The fluorospectrometer was calibrated with bacteriophage T4 DNA standard (Wako Chemicals; Richmond, VA) and the total mass of extracted DNA was calculated from the fluorescent intensity signal. Each measurement was blanked with buffer containing PicoGreen reagent diluted 200 fold.
Real-Time Polymerase Chain Reaction (RT-PCR) was used to quantify genomic DNA extracted from a single cell. DNA from a single cell was fragmented using HindIII restriction enzyme for 1 h at 37 °C and diluted into 10 µL PBS (10 mM Phosphate, pH 7.0, 150 mM NaCl). After enzyme inactivation at 65 °C, a whole genome amplification (WGA) kit (Single Cell Whole Genome Amplification Kit, New England Biolabs) was used to amplify the extracted DNA and the reaction was monitored in real time using a LightCycler 480 Real-Time PCR Instrument (Roche) following the NEB kit cycling protocol. DNA extracted and purified in bulk from M0-91 cells was used as a reference standard.
Results
DNA extraction from a single cell
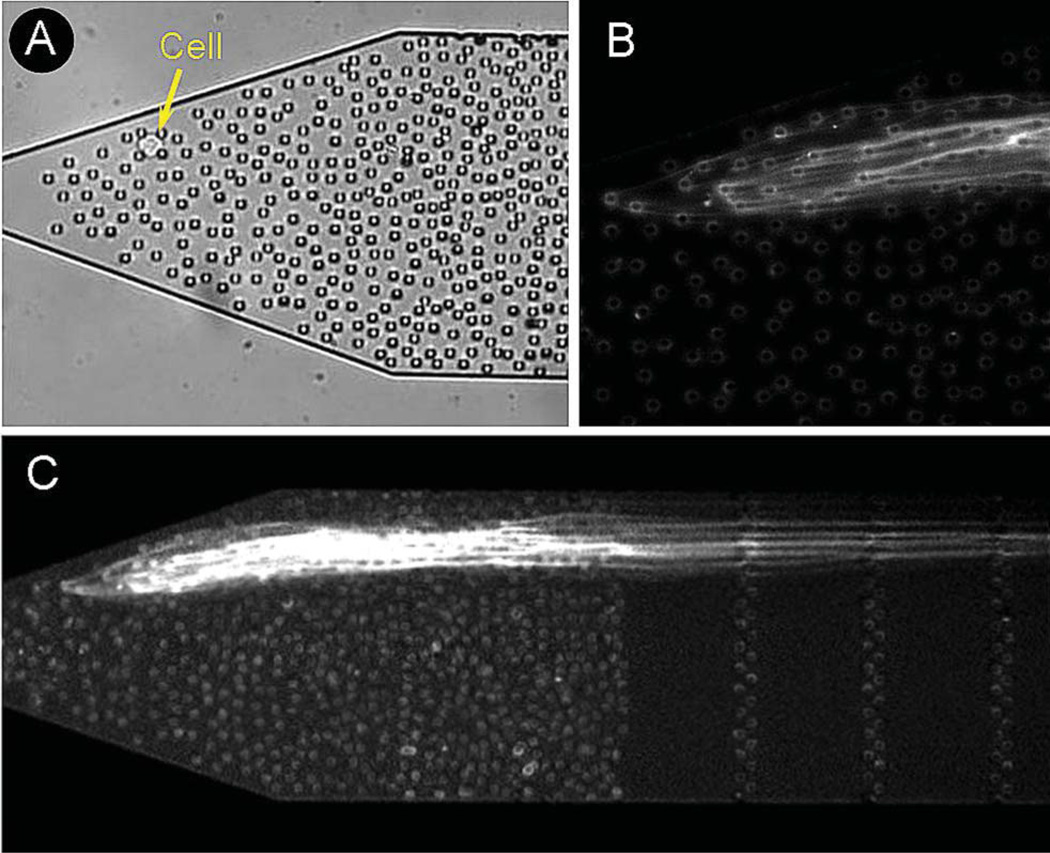
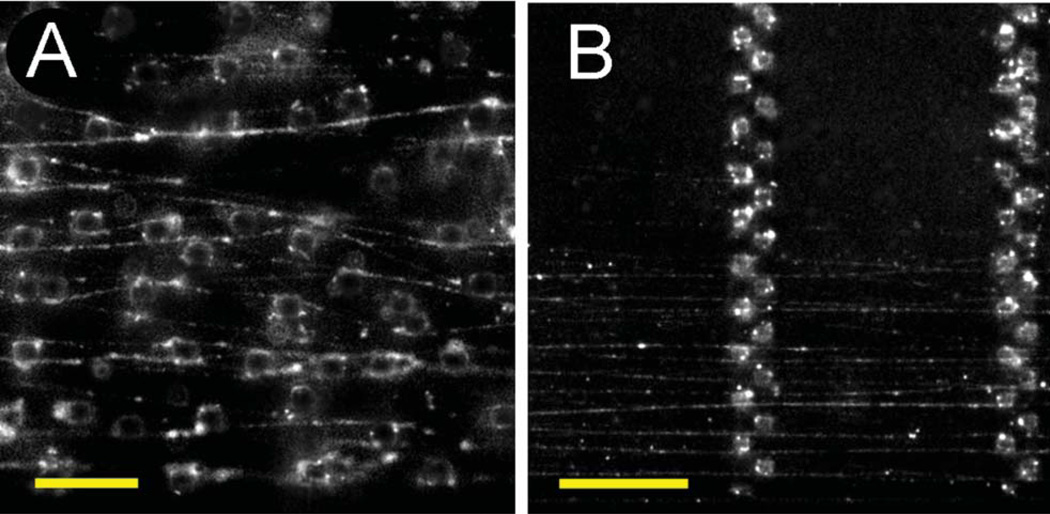
The microfluidic device is designed to capture individual cells in an array of micropillars, perform lysis, extraction, purification, and then partially linearize the released human chromosomal DNA. The rationale behind using micropillar obstacles is that chromosomal DNA is significantly larger than the remaining cell contents and can be therefore separated from the lysate by size. Because the extraction is performed at very low flow rates, DNA fragmetation throughout the process is negligable. Fig. 2 displays a schematic of the operation principles for the device. Briefly, an individual cell is delivered into the micropillar array by hydrodynamic flow. The captured cell is chemically lysed with 1% SDS, which simultaneously dissolves the plasma membrane and the nuclear membrane, thereby releasing the DNA into solution. The surfactant also gradually destroys the higher-order chromatin structure by denaturing and stripping off histone proteins. The hydrodynamically-driven DNA collides immediately with the micropillars and loops around them in a rope-over-pulley fashion. Dense arrays of randomly spaced micropillar obstacles were chosen for single-cell studies to maximize the number of collisions encountered by the unwrapping DNA and to fan out the individual strands of chromosomal DNA as they unwind. This helps to separate and spread individual strands of DNA in the microchannel. DNA migration under hydrodynamic flow is inhibited by weak steric interactions with the non-functionalized micropillars and intermolecular interactions with other strands of chromosomal DNA. Fig. 3 shows a fluorescent image of DNA strands released from a single M0-91 cell. The DNA strands extend over more than 10 mm into the channel (~20 mm), which is shorter than the length of chromosomal DNA in B-form ranging from 17 mm (chromosome 21) to 85 mm (chromosome 1).27 It is likely that individual strands are multiply folded on themselves and the observed stretched length is much shorter than the full length of the chromosome. To investigate how a single strand is trapped and stretched in more detail, a single chromosome (chromosome 17) was labelled with chromosome paints and imaged with high numerical aperture objectives. Fig. 4 shows fluorescent images of selectively labelled chromosome 17. The fluorescent images reveal the trapping principle for individual chromosome strands. The extracted DNA is multiply folded, looped around dozens of micropillars, and extended over many millimeters into the microchannel. This experimental result also suggests that fluorescent in situ hybridization (FISH) labeling can be carried out on the stretched DNA without fragmenting hundreds of megabase long strands.
Fig. 3.
(A) Single cell immobilized in a random array of micropillar obstacles, (B) detailed fluorescent image of DNA strands looped around the micropillars and suspended by hydrodynamic flow, and (C) stretched DNA strands from the cell shown in (A). The multiply folded strands extend over more than 10 mm into the microchannel.
Fig. 4.
Human chromosome 17 selectively labelled with whole chromosome paints. (A) Unwrapped chromosomes looped around randomly spaced micropillars. (B) Stretched DNA strands suspended between arrays of micropillars. The scale bars correspond to 20 and 50 µm, respectively.
Off-chip quantification
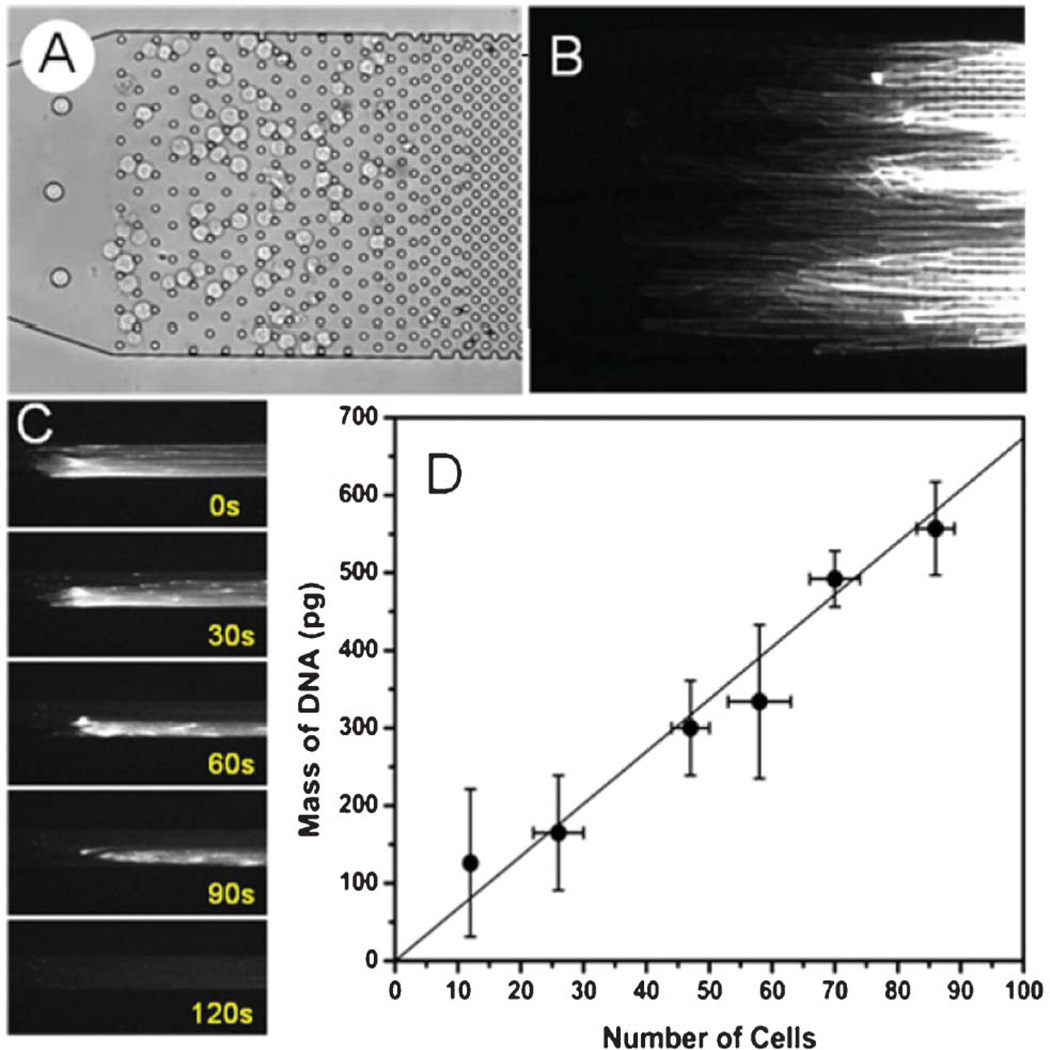
To determine the extraction efficiency of the microfluidic device, multiple devices were loaded with small populations (up to 83) of M0-91 cells, from which chromosomal DNA was then isolated following the single-cell procedure described earlier. Multiple cells were used because the small amount of genomic DNA contained in a single cell (6.6 pg per each human diploid cell)27 is insufficient for reliable fluorospectrometric quantification. A modified microchannel design featuring a semi-ordered array with gradually decreasing spacing (see Fig. 5A) was designed for these measurements to accommodate the higher cell counts. Purified DNA was released from the devices via enzymatic digestion described in DNA Release and Off-Chip Fluorescence Analysis section. As illustrated in the sequence of images in Fig. 5C, all DNA was released from the microchannel into the collection reservoir under 100 nL min−1 flow within 2 min.
Fig. 5.
(A) Bright field image of 70 cells captured in a micropillar obstacle array, (B) fluorescent image of the released DNA, (C) Sequence of fluorescent images showing digestion of chromosomal DNA extracted from the cells shown in (A), and (D) amounts of DNA collected from different number of M0-91 cells in the microfluidic device. The total elution volume for each sample was 20 µL. The solid line corresponds to the linear fit of the data.
Fig. 5D compares the amounts of DNA extracted from six devices loaded with different numbers of M0-91 cells. The fluorescence intensity of the extracts measured with the Nanodrop fluorospectrometer was directly proportional to the number of cells. The total mass of extracted DNA was calculated from the fluorescent intensity signals according to the calibration curve prepared with the bacteriophage T4 DNA standards. The solid line in Fig. 5D is a linear regression fit to the DNA extraction data. For all cell counts, the measured amounts of collected DNA are in good agreement with the expected amounts displaying a slope of (6.7 ± 0.2) pg/cell. The microfluidic devices extract essentially 100% of genomic DNA from small cell populations, outperforming both macroscopic and microchip-based SPE methods. The large vertical error bars reflect the inherent variation of the fluorospectrometer instrument. The uncertainty in cell counts is caused by the presence of dead cells, overlapping cells and other debris in the microchannel which makes cell identification and counting in micropillar arrays difficult. Only live cells were considered in the calculation of the extraction efficiency because the DNA from dead cells is already fragmented30 and the strands are too short to get captured in the microarray by looping around micropillars. In a control experiment, no DNA strands were observed in the obstacle array when a population of dead M0-91 cells were immobilized and lysed in the microchannel (data not shown).
To further confirm genomic DNA extraction from a single cell, real time PCR was used for quantification. A single cell was trapped and its chromosomal DNA extracted for off-chip analysis as described in Materials and Methods. Using WGA and a real time PCR instrument the extracted DNA was amplified and the cycle crossing point (CP) value determined. The obtained CP was compared to those obtained from DNA standards at 9.9, 6.6 and 3.3 pg of M0-91 DNA (see Supporting Information). From these experiments the amount of genomic DNA extracted from a single cell is approximately (8 ± 1) pg which is in close agreement with the expected mass. Discrepancies in the measured amount of DNA by RT-PCR may be due to a lack of cell cycle control or differences in amplification efficiency between the standards and the single cell DNA extraction. It is unknown at what stage of the cell cycle an individual cell is at in the extraction experiments. Depending on what stage of the cell cycle the trapped cell is in (S-phase/G2-phase or G1-phase), results may display DNA content corresponding to one to two cells.
Conclusions
The entrapment, and subsequent lysis of human cells in an array of micropillars was shown to be an effective technique for trapping, purifying, and elongating human genomic DNA with a microfluidic device. Unlike conventional microchip-based extraction techniques, the presented physical capture mechanism does not depend on biochemical and electrostatic binding interactions between nucleic acids and functionalized surfaces. It produces largely intact, linearized DNA which can be hybridized and labeled for different downstream analyses. The capability to unravel and specifically label long chromosomal DNA is essential for genome-wide mapping of medically relevant genetic or epigenetic aberrations that adversely affect cell cycle regulation and contribute to cancer development. Since such abnormalities often span over several megabases or more of DNA,28 it is desirable that they are imaged and mapped on unfragmented, high molecular weight genomic DNA. The extracted DNA can be also released from the micropillar array by enzymatic digestion into small elution volumes for down-steam genome-wide analysis. Essentially 100% of genomic DNA was extracted using this method, rendering this extraction strategy useful for genomic analysis of DNA from small cell populations and individual cells. We envision the PDMS device to be integrated with microfluidic platforms for isolation of rare circulating tumor cells or stem cells that are difficult to study with ensemble-based methods.29 The DNA from a single captured cell can then be analyzed downstream, off-chip, using whole genome amplification methods and traditional techniques. Furthermore, downstream single-molecule fluorescence analysis in nanofluidics25,26 can be used to characterize genetic and epignetic states without the need for amplification.
Supplementary Material
Acknowledgements
The authors thank Joseph Michael Scandura at Weill Cornell Medical College for providing the M0-91 cell line. This work was supported by the Cornell Center on the Microenvironment and Metastasis through Award Number U54CA143876 from the National Cancer Institute. Chip fabrication was performed at the Cornell NanoScale Facility, member of the National Nanotechnology Infrastructure Network, which is supported by the National Science Foundation (Grant ECS-0335765).
Footnotes
Electronic supplementary information (ESI) available. See DOI: 10.1039/c2lc40955k
References
- 1.Navin N, Kendall J, Troge J, Andrews P, Rodgers L, McIndoo J, Cook K, Stepansky A, Levy D, Esposito D, Muthuswamy L, Krasnitz A, McCombie WR, Hicks J, Wigler M. Nature. 2011;472:90–94. doi: 10.1038/nature09807. [DOI] [PMC free article] [PubMed] [Google Scholar]
- 2.Appasani K. Stem Cells & Regenerative Medicine: From Molecular Embryology to Tissue Engineering (Stem Cell Biology and Regenerative Medicine) New York: Humana Press; 2010. [DOI] [PubMed] [Google Scholar]
- 3.Zare RN, Kim S. Annual Review of Biomedical Engineering Vol 12. vol 12. Palo Alto: Annual Reviews; 2010. pp. 187–201. [DOI] [PubMed] [Google Scholar]
- 4.Wheeler AR, Throndset WR, Whelan RJ, Leach AM, Zare RN, Liao YH, Farrell K, Manger ID, Daridon A. Anal. Chem. 2003;75:3581–3586. doi: 10.1021/ac0340758. [DOI] [PubMed] [Google Scholar]
- 5.White AK, VanInsberghe M, Petriv OI, Hamidi M, Sikorski D, Marra MA, Piret J, Aparicio S, Hansen CL. Proc. Natl. Acad. Sci. U. S. A. 2011;108:13999–14004. doi: 10.1073/pnas.1019446108. [DOI] [PMC free article] [PubMed] [Google Scholar]
- 6.Clausell-Tormos J, Lieber D, Baret J-C, El-Harrak A, Miller OJ, Frenz L, Blouwolff J, Humphry KJ, Koster S, Duan H, Holtze C, Weitz DA, Griffiths AD, Merten CA. Chem. Biol. 2008;15:427–437. doi: 10.1016/j.chembiol.2008.04.004. [DOI] [PubMed] [Google Scholar]
- 7.Ocvirk G, Salimi-Moosavi H, Szarka RJ, Arriaga EA, Andersson PE, Smith R, Dovichi NJ, Harrison DJ. Proc. IEEE. 2004;92:115–125. [Google Scholar]
- 8.Marcy Y, Ishoey T, Lasken RS, Stockwell TB, Walenz BP, Halpern AL, Beeson KY, Goldberg SMD, Quake SR. PLoS Genet. 2007;3:1702–1708. doi: 10.1371/journal.pgen.0030155. [DOI] [PMC free article] [PubMed] [Google Scholar]
- 9.Johns MB, Paulusthomas JE. Anal. Biochem. 1989;180:276–278. doi: 10.1016/0003-2697(89)90430-2. [DOI] [PubMed] [Google Scholar]
- 10.Kim J, Johnson M, Hill P, Gale BK. Integr. Biol. 2009;1:574–586. doi: 10.1039/b905844c. [DOI] [PubMed] [Google Scholar]
- 11.Wolfe KA, Breadmore MC, Ferrance JP, Power ME, Conroy JF, Norris PM, Landers JP. Electrophoresis. 2002;23:727–733. doi: 10.1002/1522-2683(200203)23:5<727::AID-ELPS727>3.0.CO;2-O. [DOI] [PubMed] [Google Scholar]
- 12.Reedy CR, Price CW, Sniegowski J, Ferrance JP, Begley M, Landers JP. Lab Chip. 2011;11:1603–1611. doi: 10.1039/c0lc00597e. [DOI] [PMC free article] [PubMed] [Google Scholar]
- 13.Price CW, Leslie DC, Landers JP. Lab Chip. 2009;9:2484–2494. doi: 10.1039/b907652m. [DOI] [PubMed] [Google Scholar]
- 14.Boom R, Sol CJA, Salimans MMM, Jansen CL, Wertheimvandillen PME, Vandernoordaa J. J. Clin. Microbiol. 1990;28:495–503. doi: 10.1128/jcm.28.3.495-503.1990. [DOI] [PMC free article] [PubMed] [Google Scholar]
- 15.Gijs MAM. Microfluidics and Nanofluidics. 2004;1:22–40. [Google Scholar]
- 16.Degennes PG. J. Chem. Phys. 1971;55:572–579. [Google Scholar]
- 17.Teclemariam NP, Beck VA, Shaqfeh ESG, Muller SJ. Macromolecules. 2007;40:3848–3859. [Google Scholar]
- 18.Volkmuth WD, Austin RH. Nature. 1992;358:600–602. doi: 10.1038/358600a0. [DOI] [PubMed] [Google Scholar]
- 19.Turner SW, Perez AM, Lopez A, Craighead HG. J. Vac. Sci. Technol., B. 1998;16:3835–3840. [Google Scholar]
- 20.Kim J, Gale BK. Lab Chip. 2008;8:1516–1523. doi: 10.1039/b804624g. [DOI] [PubMed] [Google Scholar]
- 21.Heng HHQ, Spyropoulos B, Moens PB. BioEssays. 1997;19:75–84. doi: 10.1002/bies.950190112. [DOI] [PubMed] [Google Scholar]
- 22.Michalet X, Ekong R, Fougerousse F, Rousseaux S, Schurra C, Hornigold N, van Slegtenhorst M, Wolfe J, Povey S, Beckmann JS, Bensimon A. Science. 1997;277:1518–1523. doi: 10.1126/science.277.5331.1518. [DOI] [PubMed] [Google Scholar]
- 23.Parra I, Windle B. Nat. Genet. 1993;5:17–21. doi: 10.1038/ng0993-17. [DOI] [PubMed] [Google Scholar]
- 24.Chan EY, Goncalves NM, Haeusler RA, Hatch AJ, Larson JW, Maletta AM, Yantz GR, Carstea ED, Fuchs M, Wong GG, Gullans SR, Gilmanshin R. Genome Res. 2004;14:1137–1146. doi: 10.1101/gr.1635204. [DOI] [PMC free article] [PubMed] [Google Scholar]
- 25.Foquet M, Korlach J, Zipfel W, Webb WW, Craighead HG. Anal. Chem. 2002;74:1415–1422. doi: 10.1021/ac011076w. [DOI] [PubMed] [Google Scholar]
- 26.Cipriany BR, Zhao R, Murphy PJ, Levy SL, Tan CP, Craighead HG, Soloway PD. Anal. Chem. 2010;82:2480–2487. doi: 10.1021/ac9028642. [DOI] [PMC free article] [PubMed] [Google Scholar]
- 27.Alberts B. Molecular Biology of the Cell. New York: Garland Science; 2002. [Google Scholar]
- 28.Ji YG, Eichler EE, Schwartz S, Nicholls RD. Genome Res. 2000;10:597–610. doi: 10.1101/gr.10.5.597. [DOI] [PubMed] [Google Scholar]
- 29.Nagrath S, Sequist LV, Maheswaran S, Bell DW, Irimia D, Ulkus L, Smith MR, Kwak EL, Digumarthy S, Muzikansky A, Ryan P, Balis UJ, Tompkins RG, Haber DA, Toner M. Nature. 2007;450:1235–1239. doi: 10.1038/nature06385. [DOI] [PMC free article] [PubMed] [Google Scholar]
- 30.Bortner CD, Oldenburg NBE, Cidlowski JA. Trends Cell Biol. 1995;5:21–26. doi: 10.1016/s0962-8924(00)88932-1. [DOI] [PubMed] [Google Scholar]
- 31.Singer VL, Jones LJ, Yue ST, Haugland RP. Anal. Biochem. 1997;249:228–238. doi: 10.1006/abio.1997.2177. [DOI] [PubMed] [Google Scholar]
Associated Data
This section collects any data citations, data availability statements, or supplementary materials included in this article.


