

Abstract
Recent in vivo neuroimaging studies revealed that several brain networks are altered in prenatal cocaine exposure (PCE) affected adolescent brains. However, due to a lack of dense and corresponding cortical landmarks across individuals, the systematical alterations of functional connectivities in large‐scale brain networks and the alteration of structural brain architecture in PCE affected brain are largely unknown. In this article, we adopted a newly developed data‐driven strategy to build a large set of cortical landmarks that are consistent and corresponding across PCE adolescents and their matched controls. Based on these landmarks, we constructed large‐scale functional connectomes and applied the well‐established approaches of deriving genomics signatures in genome‐wide gene expression studies to discover functional connectomics signatures for the characterization of PCE adolescent brains. Results derived from experimental data demonstrated that 10 structurally disrupted landmarks were identified in PCE, and more importantly, the discovered informative functional connectomics signatures among consistent landmarks distinctively differentiate PCE brains from their matched controls. Hum Brain Mapp 34:2494–2510, 2013. © 2012 Wiley Periodicals, Inc.
Keywords: connectome, diffusion tensor imaging, resting state fMRI
INTRODUCTION
The epidemic of cocaine use [Elliot and Coker, 1991] has raised significant public attention to adolescents prenatally exposed to cocaine [Derauf et al., 2009; Frank et al., 2001; Lester and Padbury, 2009; Shankaran et al., 2007]. Prenatal cocaine exposure (PCE) affected adolescents are associated with deficits in intelligence, language skills, executive functioning, impulse control and attention, and evidence of internalizing and externalizing behavioral traits [Derauf et al., 2009; Frank et al., 2001; Lester and Padbury, 2009; Shankaran et al., 2007]. In general, PCE affected brains are characterized with widespread structural [Avants et al., 2007; Cohen et al., 1994; Dixon and Bejar, 1989; Dow‐Edwards et al., 2006; Gieron‐Korthals et al., 1994; Gomez‐Anson et al., 2003; Heier et al., 1991; Kliegman et al., 1991; Rivkin et al., 2008; Warner et al., 2006] and functional alterations [Cortese et al., 2006; Dow‐Edwards et al., 2006; Emmalee et al., 2002; Hurt et al., 2008; Li et al., 2009b; Miller‐Loncar et al., 2005; Rose‐Jacobs et al.., 2007; Sheinkopf et al., 2009; Volpe, 1987], caused by decreased number of neurons [Lidow and Song, 2001a, 2002], cocaine's vasoconstrictive effects [Bassett and Hanson, 1998; Jensen et al., 1987; Koegler et al., 1991; Lipton et al., 2002; Volpe, 1987; Woods et al., 1987], and/or alterations in the monoaminergic neurotransmitter systems [Levitt et al., 1997; Lidow and Song, 2001a, 2002; Malanga and Kosofsky, 1999; Meier et al., 1991]. Recent in vivo neuroimaging studies [Cortese et al., 2006; Dow‐Edwards et al., 2006; Emmalee et al., 2002; Lester et al., 2010; Li et al., 2009b, 2012; Miller‐Loncar et al., 2005; Rose‐Jacobs et al.., 2007; Volpe, 1987] have shown that several brain networks including arousal regulation [Li et al., 2009b], working memory [Hurt et al., 2008; Li et al., 2009b; Santhanam et al., 2009], language [Emmalee et al., 2002], executive function [Rose‐Jacobs et al., 2009], motor [Miller‐Loncar et al., 2005], attention [Dow‐Edwards et al., 2006], default mode [Santhanam et al., 2011], and vision [Dow‐Edwards et al., 2006; Li et al., 2008] systems, are altered in PCE affected brains. Despite significant findings in neuroimaging of PCE [Cortese et al., 2006; Dow‐Edwards et al., 2006; Emmalee et al., 2002; Li et al., 2009b, 2012; Miller‐Loncar et al., 2005; Rose‐Jacobs et al., 2009; Volpe, 1987], alterations of functional connectivities in large‐scale brain networks and the alteration of structural brain architecture in PCE affected adolescents are largely unknown.
When mapping structural and/or functional brain connectivity, network nodes, or regions of interests (ROIs), provide the structural underpinnings for measuring connectivities within individual brains and for comparing connectivities across populations [Liu, 2011]. Thus, identification of robust, reproducible, and accurate ROIs that are consistent and correspondent across different brains is critically important for the success of connectivity mapping [Li et al., 2010b, 2011, 2012; Liu, 2011; Zhu et al., 2011, [Link], in press]. However, from our perspective, determination of corresponding brain ROIs in different brains is perhaps one of the foremost challenges in human brain mapping [Liu, 2011], due to four critical reasons. (1) The functional and/or cytoarchitectural boundaries between cortical regions are vague [Cabeza and Kingstone, 2006; Liu, 2011; Van Essen and Dierker, 2007]. (2) The individual variability of cortical structure and function is remarkable [Brett et al., 2002; Liu, 2011). (3) The properties of ROIs are highly nonlinear [Li et al., 2010b, 2012; Liu, 2011; Zhu et al., 2011, [Link], in press]. For instance, a slight change to the size or location of an ROI might dramatically alter its structural and/or functional connectivity profiles [Li et al., 2010b, 2012; Zhu et al., 2011, [Link]]. (4) It is very challenging to identify accurate ROIs in PCE affected brains as the brain architecture might have been altered during neurodevelopment [Chen et al., 2011; Coles et al., 2011; Li et al., 2008, 2012; Santhanam et al., 2009, 2011].
Current methods for identifying ROIs in brain imaging can be broadly classified into four categories [Li et al., 2009a; Liu, 2011]. The first method is manual labeling by experts based on their domain knowledge [Biswal et al., 2010]. Although it has been widely used, this method might be vulnerable to inter‐ and intra‐subject variation, its reproducibility may be low [Amunts et al., 2000], and it is impractical to define a large set of ROIs in large datasets. The second method is to cluster ROIs from the brain image itself and is data‐driven [Beckmann et al., 2005; Calhoun et al., 2004; Hyvärinen and Oja, 2000; Zang et al., 2004]. However, data‐driven approaches might be sensitive to the clustering parameters used, and their neuroscience interpretation might not be immediately clear. The third one is to predefine ROIs in a template brain and register them to the individual space using image registration algorithms [Andersson et al., 2008; Avants et al., 2008; Jenkinson and Smith, 2001; Liu et al., 2004; Shen and Davatzikos, 2002]. The accuracy of these atlas‐based registration methods is limited due to the variability of neuroanatomy across different brains. The fourth method uses task‐based fMRI paradigms to identify activated brain regions as network ROIs [e.g., Faraco et al., 2011], which is regarded as the benchmark approach for ROI identification. However, task‐based fMRI is demanding and time‐consuming [Jack et al., 2010; Li et al., 2011], and it is impractical to acquire extensive fMRI data for large‐scale brain networks, e.g., for PCE affected adolescents. As such, the major barrier to the quantitative assessment of large‐scale structural and functional connectivities in PCE adolescents and matched control brains is the lack of dense, consistent, and correspondent brain landmarks across brains, based on which connectivity mapping is conducted.
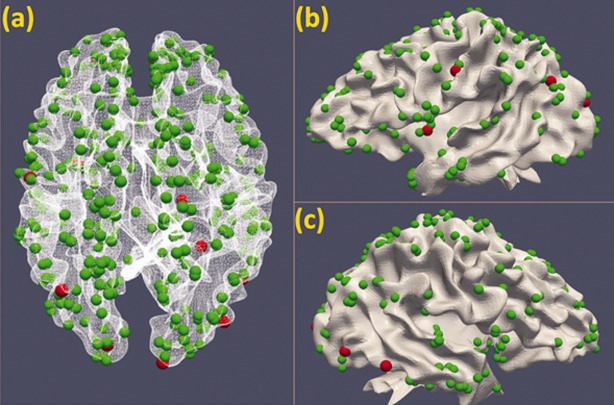
Recently, we developed and validated 358 DICCCOLs (Dense Individualized and Common Connectivity‐based Cortical Landmarks, publicly available at http://dicccol.cs.uga.edu), each of which was optimized to possess maximal groupwise consistency of DTI‐derived fiber shape patterns [Zhu et al., 2011, in press] as shown in Figure 1. The neuroscience basis is that the close relationship between structural connection pattern and brain function [Li et al., 2010b, 2012; Passingham et al., 2002; Zhang et al., 2011; Zhu et al., 2011, [Link], in press]. DICCCOL effectively and simultaneously deals with three aforementioned challenges [Liu, 2011] in ROI identification in the following ways [Zhu et al., in press]. (1) Individual structural and functional variability is effectively addressed by seeking the maximization of groupwise consistent fiber connection patterns. (2) Nonlinearity of cortical connection properties is appropriately addressed by a global optimization and search procedure, in which groupwise consistency is used as an effective constraint. (3) The unclear boundaries of cortical regions are suitably addressed by the simultaneous optimization of cortical region locations and sizes, thus achieving reasonable boundaries defined by the optimized cortical regions. Extensive validations indicate the 358 DICCCOLs possess intrinsically established structural and functional correspondences across individuals [Zhu et al., in press], providing natural structural substrates for the construction of structural and functional connectomes.
Figure 1.
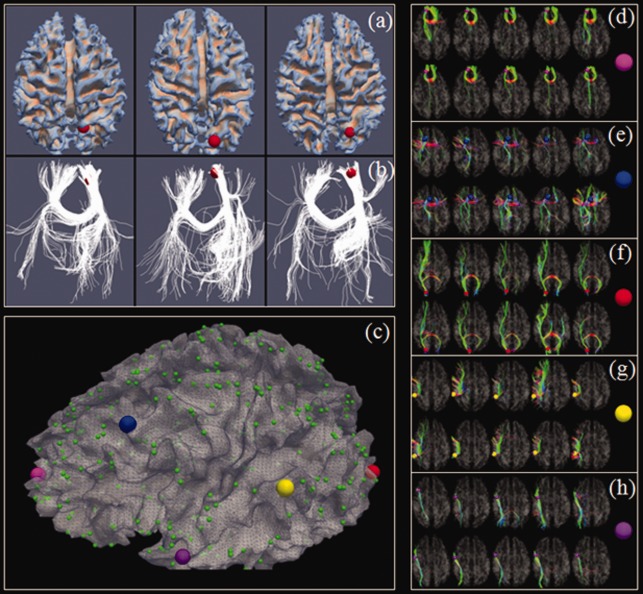
(a) Left precuneus (by the red sphere) in three subjects. (b) Fiber connection profiles of the precuneus in three subjects. (c) The 358 DICCCOL landmarks [Zhu et al., in press]. (d–h) Similar fibers connected to the five landmarks, represented by enlarged bubbles in (c), in two separate groups of five subjects (in two rows), respectively. [Color figure can be viewed in the online issue, which is available at http://wileyonlinelibrary.com.]
In this work, we investigated if our existing 358 DICCCOL ROIs discovered from healthy adult brains (Fig. 1) can be optimized and tailored for the construction and representation of connectomes in PCE affected brains. Given each PCE subject with DTI data, we predicted the DICCCOLs in the individual's brain via our novel ROI prediction framework [Zhang et al., 2011]. The predicted 358 DICCCOLs in the PCE and control brains were further optimized and tailored to maximize the consistency of each ROI's emanating fiber connection patterns across a group of PCE/control subjects, resulting in the DICCCOL‐PCE in this article.
Based on the optimized DICCCOL‐PCE, the structural and functional connectomes for each subject were constructed [Zhu et al., in press]. In particular, the well‐established approaches for genomics signatures discovery approaches [Alizadeh et al., 2000] in the bioinformatics and computational biology fields were borrowed here to identify functional connectomics signatures for characterization of PCE affected brains. One of the prominently similar features between connectomics attributes and genome‐wide gene expressions is that the increased or decreased functional connectivity/interaction in connectomics is corresponding to the upregulated or downregulated gene expression. As a result, the effective clustering algorithms and tree‐view visualization approaches [Alizadeh et al., 2000] that have been widely used and validated in genomics signature discovery studies were adopted in our connectomics signature discoveries in this article. Our experimental results demonstrated that informative and robust connectomics signatures were discovered to distinctively characterize PCE brains from their healthy controls.
The major contributions of this article include: (1) we built a large set of cortical landmarks that are consistent and correspondent across PCE adolescents and their normal controls. These DICCCOL‐PCE landmarks possess intrinsic structural and functional correspondences, providing the substrates for large‐scale connectome mapping of PCE adolescents. (2) We systematically investigated the discrepant brain regions of PCE affected adolescents on the whole cortex and identified 10 DICCCOL‐PCE ROIs that exhibit significant differences between PCE brains and control brains. (3) We leveraged and adopted the well‐established approaches of deriving genomics signatures in genome‐wide gene expression studies to discover connectomics signatures for the characterization of PCE and identified functional connectome signatures that were able to differentiate PCE brains from their matched controls.
MATERIALS AND METHODS
Data Acquisition and Preprocessing
Participants were adolescents (12–18 years old) recruited from cohorts identified originally as part of two longitudinal studies of PCE on infant development [Brown et al., 1998; Coles et al., 1992], led by the Dr. Coles. Both cohorts were drawn from a low income, predominantly African‐American population with infants delivered at an urban hospital during 1987–1994. PCE was determined by maternal self‐report and/or positive urine screen at recruitment postpartum [Brown et al., 1998; Coles et al., 1992]. Positive maternal urine screens at labor and delivery and during pregnancy noted in the medical record were also accepted as evidence of use. We have imaging data collected from these adolescents at two time points ∼2 years in between. At Time point 1, 78 adolescents were scanned, including 13 controls and 21 PCE subjects in the old (DOB: 1987–1990) and 17 controls and 27 PCE subjects in the young (DOB: 1992–1994) cohort. At Time point 2, 55 adolescents were scanned, comprising of seven controls and 13 PCE subjects in the old and 14 controls and 21 PCE subjects in the young cohort.
This dataset was collected during an NIH/NIDA funded R01 project awarded to the Drs. Hu and Coles. High resolution T1‐weighted three‐dimensional (3D) anatomical images were acquired using an MPRAGE sequence (192 sagittal slices) on a 3 T Siemens Trio Scanner at Emory University. The anatomical scan protocol had a 3D field of view of 256 × 224 × 192 mm3 and a 3D matrix of 256 × 224 × 192 resulting in an isotropic resolution of 1 mm. For DTI scan, diffusion gradients were applied in 12 directions with b‐value of 1,000 s/mm2. Contiguous axial slices (34 with 2.5 mm thickness) were acquired. For resting state fMRI (R‐fMRI), we scanned 210 volumes, matrix = 64 × 64, 20 axial slices without gap, thickness = 4 mm, and TR/TE = 2,000 ms/30 ms. For task‐based fMRI, we embedded task‐irrelevant emotional distracters in a working memory task to examine the interaction of emotional arousal and memory in PCE and nonexposed adolescents [Li et al., 2009b]. In the task‐based fMRI, we used a verbal working memory task with two memory loads in the activation fMRI so that the signal difference between the memory loads could be used to identify default mode deactivations [Li et al., 2009b]. More details of the imaging settings were described elsewhere [Li et al., 2009b, 2012]. Our existing analysis on this dataset was preliminary [Li et al., 2009b, 2012], and we performed systematic and comprehensive analysis of large‐scale connectivities in PCE brain using our recent novel approaches [Zhu et al., 2011, [Link], in press] in this article.
We adopted well‐established approaches and algorithmic pipelines [Fillard and Gerig, 2003; Jenkinson and Smith, 2001; Liu et al., 2009a, 2007, 2011] for preprocessing of the above multimodal DTI and fMRI datasets in this article. Specifically, we used DTI image space to define landmark ROIs, and fMRI data were mapped to the DTI space via a affine registration algorithm [Jenkinson and Smith, 2001]. Our rationale is that both fMRI and DTI use EPI sequences, and their distortions tend to be similar [Li et al., 2010a]. As a result, the misalignment between DTI and R‐fMRI images is much less than that between T1 and R‐fMRI images [Li et al., 2010a]. By performing brain tissue segmentation on DTI data [Liu et al., 2007], we derived a DTI image segmented into three compartments corresponding to gray matter, white matter, and cerebrospinal fluid. Our cortical surface reconstruction algorithm [Liu et al., 2008] was applied directly to the DTI‐derived tissue maps, and then, the cortical surface was reconstructed. Fiber tracts were tracked via MEDINRIA [Fillard and Gerig, 2003] and mapped onto the cortical surface via our approaches in Li et al. [2010b, 2011]. Based on the cortical surface reconstructed from DTI data, we preprocessed fMRI signals [Li et al., 2010a] and then mapped them onto the cortical surface. To ensure robustness, we applied anatomical and connectional constraints [Li et al., 2010a] to the mapping process. Other fMRI preprocessing steps included brain skull removal, motion correction, spatial smoothing, temporal prewhitening, slice time correction, global drift removal, and band pass filtering [Li et al., 2010a; Lv et al., 2010].
Prediction of DICCCOLs in PCE/Control Brains
As mentioned before, we discovered a set of 358 DICCCOL ROIs [Zhu et al., in press; DICCCOLs are public available at http://dicccol.cs.uga.edu; screenshots for DICCCOL‐PCE are available at http://dicccol.cs.uga.edu/pce.tar.gz) that possess intrinsic and accurate structural and functional correspondence across individuals. These 358 DICCCOL ROIs have been replicated in six independent datasets on over 240 human brains of different age groups and have been extensively validated using large‐scale functional MRI data including 121 functional regions derived from nine functional networks (i.e., attention, auditory, default mode network, emotion, empathy, fear, semantic decision making, working memory, and visual network) [Zhu et al., 2011, in press]. One particular feature of DICCCOLs is that they can be accurately and efficiently predicted in a new, single brain with DTI data. The prediction of DICCCOLs in PCE/control brains was similar to our recently published algorithm [Zhang et al., 2011]. For details about the DICCCOL, please refer to Zhang et al. [2011] and the Supporting Information.
In consideration of the possible greater variability expected in PCE affected brains, a larger candidate region was used during the DICCCOL prediction procedure. The candidate region of a certain DICCCOL landmark is about 50% larger for PCE group than that of normal brains. The reason is that there are both normal and discrepant ROIs for PCE group, and even the localization of normal ROIs might be affected by the discrepant ones. Thus, a larger candidate region during prediction helps locate these normal ROIs.
Optimization of DICCCOL‐PCE After DICCCOL PREDICTION
The predicted DICCCOLs in the above section reflect the common architecture of normal human brain and have been precisely replicated on over 240 human brains [Zhu et al., 2011, in press], However, as PCE affected brains may have altered structural architectures compared with normal controls [Avants et al., 2007; Cohen et al., 1994; Dixon and Bejar, 1989; Dow‐Edwards et al., 2006; Gieron‐Korthals et al., 1994; Gomez‐Anson et al., 2003; Heier et al., 1991; Kliegman et al., 1994; Rivkin et al., 2008; Warner et al., 2006], the above collection of 358 predicted DICCCOLs in PCE need to be further optimized to maximize the consistency of each ROI's emanating fiber connection patterns across a group of PCE/control subjects. This optimization procedure was formulated and solved as an energy minimization problem in a similar way as we previously described [Zhu et al., in press; see Supporting Information for details].
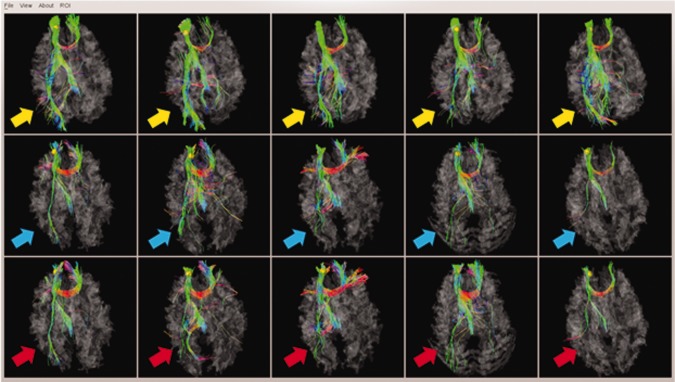
This optimization procedure together with the prediction procedure in Prediction of DICCCOLs in PCE/control brains section plays important roles in adaption of DICCCOLs from normal brains to PCE affected ones. First, a larger candidate region in prediction procedure helps deal with the possible larger variability in DICCCOL location for PCE brains. Second, with the prediction as initialization, the following optimization procedure tackles the possible larger variability in structural connectivity pattern. This two‐step strategy tailored the DICCCOLs discovered from healthy adult brains to PCE and control brains specifically, resulting in the DICCCOL‐PCE in this article. Our extensive examinations demonstrated that the above optimization procedure significantly improved some individual subjects' DICCCOL prediction accuracy, though this optimization would not alter the groupwise fiber connection patterns. As an example, Figure 2a,b show the fiber connection patterns of two randomly selected DICCCOL ROIs for PCE affected brains before and after the optimization procedure.
Figure 2.
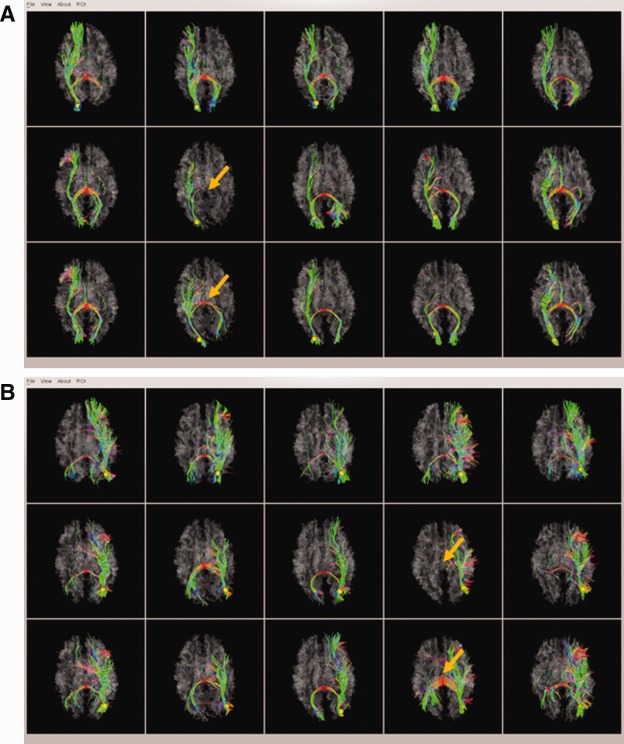
Two examples of fiber connection patterns of DICCCOL ROIs before and after optimization. (a) The first case; (b) The second case. For each case, the five visualizations in the top row are from template brains, the five visualizations in the middle row are the predicted DICCCOL ROIs in PCE brains, and the five visualizations in the bottom row are the results after optimization. The within‐group tracemap distances for the two examples are: (a) 2.30/1.67 (prediction/optimization) and (b) 3.86/1.92 (prediction/optimization). The orange arrows highlight the cases that exhibited significantly improved DICCCOL optimization results. [Color figure can be viewed in the online issue, which is available at http://wileyonlinelibrary.com.]
In addition to visual examination, quantitative comparisons of fiber connection patterns in the optimized DICCCOL landmarks in PCE/control datasets with those in template DICCCOLs [Zhu et al., 2011, in press] were conducted based on their trace‐map distances. For a specific landmark, distance between the corresponding trace‐maps in PCE subjects and template subjects were statistically compared with that between control subjects and templates. If the distance is significantly different, the landmark was declared as a discrepant one. Otherwise, it was considered as a common landmark. Both of our qualitative and quantitative assessments demonstrated that a majority of DICCCOL ROIs (348 out of 358) successfully found their correspondences in the PCE affected brains and their controls. In the following connectomics signature discovery procedure, only those common DICCCOL ROIs were used for connectome construction, and those 10 discrepant ROIs were discarded.
Discovering Connectomics Signatures of PCE
We leveraged and adopted the well‐established approaches of deriving genomics signatures in genome‐wide gene expression studies [Alizadeh et al., 2000] to discover connectomics signatures for the characterization of PCE. Specifically, a hierarchical clustering algorithm [Alizadeh et al., 2000] was used to group connectivities (equivalent to genes in genome‐wide microarray data) on the basis of similarity in the pattern, where their connection strength (equivalent to gene expression) varied over all brains (equivalent to samples). One of the prominently similar features between connectomics attributes and genome‐wide gene expressions is that the increased or decreased functional connectivity in connectomics is equivalent to the upregulated or downregulated gene expression. As a result, the effective clustering algorithms that have been widely used in genomics signature discovery studies were readily adopted in our connectomics signature discoveries in this article. The same clustering procedure can be used to group brain conditions and control brains on the basis of similarities in the strengths of these connectivities. Before the actual clustering procedure, we applied a preprocessing step of statistical t test to remove those connectivities that do not exhibit significance difference between brain conditions and controls. Thus, the clustering procedure can not only be significantly speeded up but also be less prone to the possible noises in the connectivities.
For visual examination and interpretation, the connectomics signatures are shown in a matrix format, with each column representing the strengths from all brains for a single connection element of the connectome (equivalent to expression levels for all genes in a single sample), and each row representing the measured strengths for all connections in a single brain (equivalent to the whole array in microarray data). To visualize the results, the connection strength are represented by a color ranging from 0 to 1, with red representing higher strength, and green representing lower strength. The examples of visualizations are shown in Functional connectome signatures section. The steps we used for the connectomics signature discovery are summarized as below.
The 358 DICCCOL ROIs were predicted in each individual brain of the PCE and control subjects based on DTI data.
The predicted DICCCOLs were tailored to fit the PCE dataset via optimization. Discrepant DICCCOL‐PCEs are removed from the following analysis.
The structural and functional connectomes were constructed using the DICCCOL‐PCEs as network nodes from the multimodal DTI and R‐fMRI.
Preprocessing of t tests was performed to remove those functional connectivities that do not show significant differences between PCE affected brains and normal controls.
The remaining functional connectivities for each subject was composed into a row connectomics attribute vector. All these row vectors were arranged into a connectomics attribute matrix, where PCE brains were at the upper part of the matrix, while the normal controls were at the lower part.
A hierarchical clustering algorithm or other clustering algorithms such as k‐means clustering algorithms [Alizadeh et al., 2000] were applied to cluster the columns of connectomics attributes into informative connectomics signatures.
The clustered columns were compared with the functional annotations of DICCCOL ROIs, and the connectivities in each connectomics signature were mapped into the brain networks for results interpretation.
RESULTS
DICCCOL‐PCE Prediction and Optimization
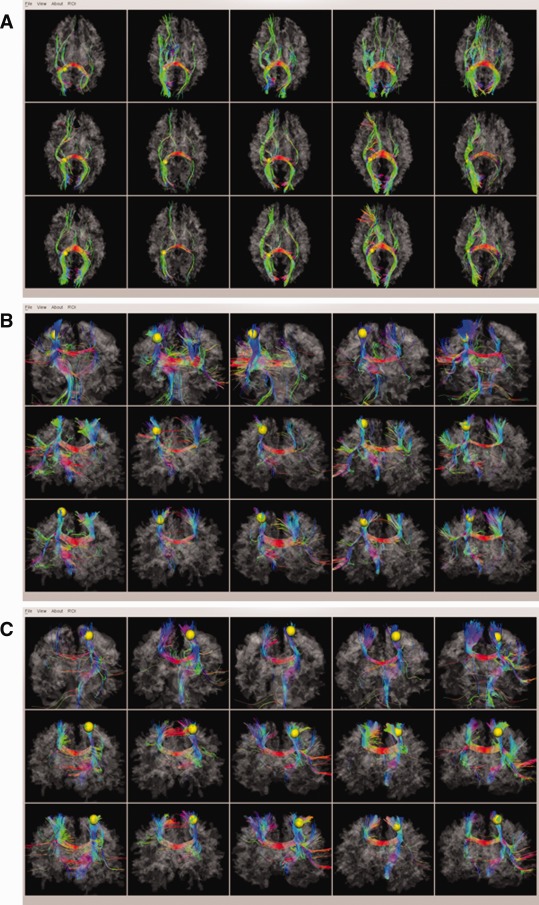
In addition to the two examples of DICCCOL‐PCE prediction and optimization in Figure 2, we provided an additional example of DICCCOL‐PCE (yellow sphere in Fig. 3a) and the corresponding trace‐maps in Figure 3b. As can be seen from the figure, the prediction (middle row in Fig. 3a) has a decent performance in terms of fiber shape consistency with the models (top row in Fig. 3a); furthermore, the optimization procedure (bottom row in Fig. 3a) further improved the consistency of emanating fiber bundles of predicted DICCCOL‐PCE ROIs, as highlighted by the green and yellow arrows. This is further demonstrated and confirmed by the corresponding trace‐maps in Figure 3b. It is apparent that after optimization, the trace‐maps (bottom row in Fig. 3b) have better groupwise consistency (top row in Fig. 3b) than the prediction (middle row in Fig. 3b). For additional comparisons, screenshots for fiber bundles of 358 DICCCOLs are released online at: http://dicccol.cs.uga.edu/pce.tar.gz.
Figure 3.
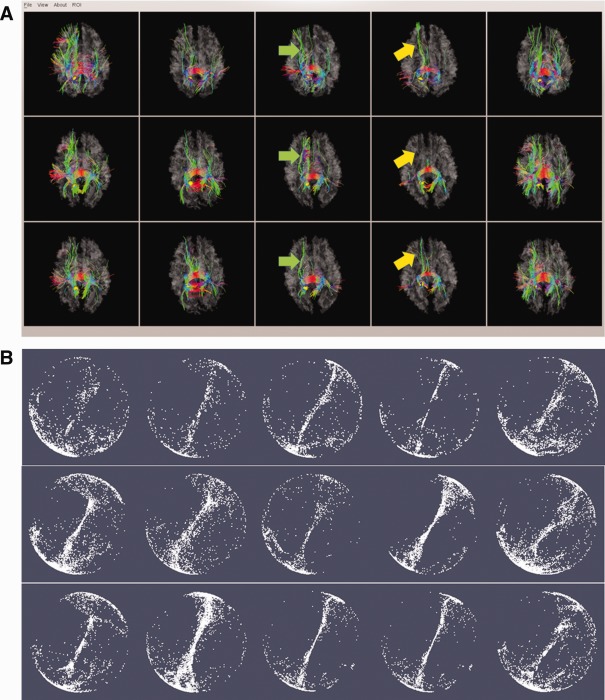
An example of DICCCOL‐PCE prediction and optimization. (a) The fiber bundles of the DICCCOL (represented by yellow sphere). The top row are five models from UGA dataset [Zhu et al., in press]; the middle row are the predicted DICCCOLs in five PCE affected brains; the bottom are optimized DICCCOLs for the same five PCE affected brains after prediction. (b) The corresponding trace‐maps in Figure 3a. The within‐group tracemap distances for this DICCCOL is 1.60/1.40 (prediction/optimization). [Color figure can be viewed in the online issue, which is available at http://wileyonlinelibrary.com.]
Also, we quantitatively measured the trace‐map distance of DICCCOL‐PCE ROIs before and after optimization. It turned out that the optimization step substantially improved the consistency of fiber connection patterns of DICCCOL‐PCE ROIs. Figure 4 shows the quantitative results for both PCE affected brains and their healthy controls. In general, the average trace‐map distance dropped by 31.8% after optimization and the standard deviation dropped by 30.1% for PCE affected brains; and for the controls, the average trace‐map distance dropped by 29.8% after optimization and the standard deviation drops by 27.7%. This further demonstrates that the optimization procedure generated ROIs with accurate structural correspondence for PCE affected brains.
Figure 4.
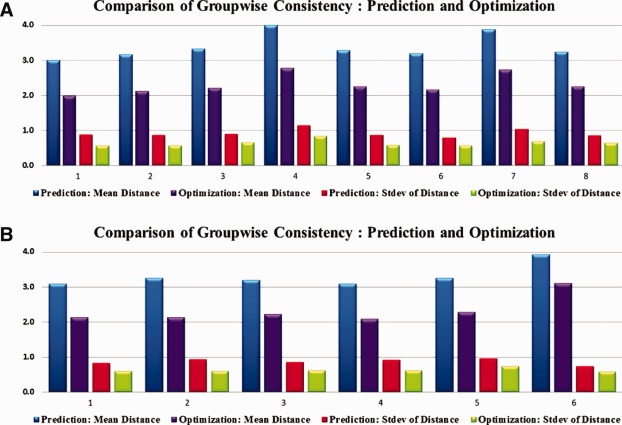
Groupwise consistency comparison for DICCCOL‐PCE ROIs. (a) PCE subjects. The average trace‐map distance drops by 31.8% after optimization and the standard deviation drops by 30.1%. (b) Control subjects. The average trace‐map distance drops by 29.8% after optimization and the standard deviation drops by 27.7%. [Color figure can be viewed in the online issue, which is available at http://wileyonlinelibrary.com.]
Discrepant DICCCOL‐PCE ROIs
In this section, we describe the results of the identification of structurally disrupted DICCCOL‐PCE ROIs by measuring the similarities between their fiber connectivity patterns and those in the template brains. A null hypothesis assuming equal similarity of fiber connectivity pattern to that in the template brains and equal variance between PCE affected brains and their normal controls was introduced and tested by a student t statistics in a two‐tailed manner. In total, we identified 10 discrepant DICCCOL‐PCE ROIs (P‐value < 0.003). The locations of these 10 ROIs were indicated by red spheres in Figure 5. Their specific anatomic locations and possible functional roles in the atlas space were assessed via meta‐analysis using BrainMap database [Laird et al., 2009], and the results are summarized in Table 1. It is interesting to see that most of the 10 ROIs are involved in brain networks reported to exhibit different patterns in PCE affected brains from their normal controls in a variety of literature papers, including working memory [Hurt et al., 2008; Li et al., 2009b; Santhanam et al., 2009], language [Emmalee et al., 2002], executive function [Rose‐Jacobs et al., 2009], motor [Miller‐Loncar et al., 2005], attention [Dow‐Edwards et al., 2006; Li et al., 2009b], and vision [Dow‐Edwards et al., 2006; Li et al., 2008] network. This consistency demonstrated that our new method is capable of systematically exploring the structural disruptions of PCE affected brains in a large scale.
Figure 5.
Discrepant DICCCOL‐PCE ROIs (represented by red spheres) in three different views: (a) Dorsal view; (b) left lateral view; and (c) right lateral view. [Color figure can be viewed in the online issue, which is available at http://wileyonlinelibrary.com.]
Table 1.
Meta‐analysis of the 10 discrepant DICCCOL‐PCE ROIs using BrainMap dataset
| ID | Paper ID and behavioral domain | Coordinates and atlas labels |
|---|---|---|
| 14 | 30011 Cognition.Memory.Explicit; 30263 Cognition.Memory.Explicit; 30268 Perception.Vision.Motion; 7070192 Cognition; 7090248 Emotion.Sadness, Emotion.Disgust; 7090272 Cognition.Attention; 7120359 Emotion, Cognition; 8020072 Cognition.Memory.Explicit; 9020032 Cognition.Language, Action.Observation; | 11.68037 −83.2299 −3.47047; Right Cerebrum.Occipital Lobe.Lingual Gyrus. Gray Matter.BA Talairach 1988 ‐ SPM95 |
| 15 | 30218 Perception.Vision.Color, Perception. Vision.Motion; 10030056 Cognition.Memory. Explicit; 10080195 Action.Observation; 60100158 Cognition.Memory.Explicit; | −22.1781 −87.6926 22.47955,MNI ‐ SPM97 Short Description: SPM97, Left Cerebrum.Occipital Lobe.Middle Occipital Gyrus. Gray Matter.BA 18; |
| 24 | 30124 Perception.Vision.Motion; 5120251 Perception.Vision.Motion, Action.Execution; 10060114 Cognition.Memory.Working, Action.Inhibition; | 38.45195 −79.1752 4.158508; (Talairach 1967:HD6 Origin: Mid AC‐PC) Right Cerebrum.Occipital Lobe.Middle Occipital Gyrus.Gray Matter.BA 19; |
| 42 | 30407 Emotion.Disgust; 6080137 Cognition.Memory.Working; 7080205 Emotion.Anxiety, Emotion.Disgust; 8110272 Cognition; | −33.5922 −69.2125 35.09035 Left Cerebrum.Parietal Lobe. Precuneus.Gray Matter.BA 39; |
| 64 | 30200 Perception.Vision.Shape; 30257 Cognition.Language.Semantic; 7010010 Cognition.Language.Semantics; 7060159 Stroop Task; 8110257 Perception.Somesthesis.Pain; 9020031 Cognition.Language; | 48.91525 −52.6243 −12.7873; Right Cerebrum.Temporal Lobe. Fusiform Gyrus.Gray Matter.BA 37; |
| 70 | 6080112 Cognition.Attention; 9010013 Emotion.Happiness.Humor, Cognition.Social Cognition; | 26.96596 −45.5451 −0.80388; Right Cerebrum.Temporal Lobe. Sub‐Gyral.Gray Matter.Hippocampus |
| 166 | 30227 Cognition.Language.Semantics, Cognition. Language.Speech; 8020068 Action.Execution; | −52.9439 −17.002 33.87145; Left Cerebrum.Parietal Lobe. Postcentral Gyrus.Gray Matter.BA 2 |
| 167 | 30028 Emotion.Happiness; 9040069 Cognition.Memory.Working, Cognition. Attention; 9090094 Perception.Vision; 60100153 Cognition.Attention; | 18.56391 −12.0095 −14.0449; Right Cerebrum.Limbic Lobe. Parahippocampal Gyrus.Gray Matter.BA area 28 |
| 170 | 60100175 Action.Execution; | −34.1947 −4.86563 70.76629;Left Cerebrum.Frontal Lobe. Precentral Gyrus.Gray Matter.BA 6 |
| 352 | 30267 Cognition.Language.Orthography, Cognition.Attention; | −20.0753 62.93266 −5.43791 Talairach 1988 Left Cerebrum. Frontal Lobe.Superior Frontal Gyrus.Gray Matter.BA 10 |
As an example, we depicted the discrepant DICCCOL‐PCE ROI (ID #352 in Table 1) at the superior frontal gyrus in Figure 6. This DICCCOL‐PCE ROI was highlighted by yellow spheres. The top row shows the fiber bundles emanating from this ROI for five model subjects [Zhu et al., 2011, in press], the middle row shows the fiber bundles emanating from the predicted ROIs for five PCE affected brains, and the bottom row depicts the fiber bundles emanating from the optimized ROIs for the same five PCE affected brains. The disrupted fiber tracts emanating from this ROI were highlighted by the colored arrows. As can be seen from the figure, it is apparent that the PCE affected brains have disrupted fiber connections from the superior frontal gyrus to the visual cortex in occipital lobes, suggesting that our analysis method is able to discover and differentiate the discrepant DICCCOL‐PCE ROIs in PCE brains from their normal controls.
Figure 6.
One example of discrepant DICCCOL‐PCE ROI at the superior frontal gyrus (represented by yellow spheres). Top row: five model subjects [Zhu et al., in press]; Middle row: five PCE affected subjects with predicted ROIs; Bottom row: the same five PCE brains with optimized ROIs. [Color figure can be viewed in the online issue, which is available at http://wileyonlinelibrary.com.]
Consistent DICCCOL‐PCE ROIs
Although there are 10 discrepant ROIs in PCE affected brains differentiated from normal controls, most ROIs (348 out of 358) still exhibited quite consistent fiber connection patterns as matched controls and the templates [Zhu et al., in press]. In Figure 7, we randomly chose three consistent DICCCOL‐PCE ROIs and visualized them and their fiber bundles on the cortical surface as examples. These ROIs corresponded to DICCCOL #80, #90, and #95, respectively. The rest of DICCCOL‐PCE ROIs are available online at http://dicccol.cs.uga.edu/pce.tar.gz.
Figure 7.
Three examples of consistent DICCCOL‐PCE ROIs: (a) DICCCOL‐PCE #80; (b) DICCCOL‐PCE #90; and (c) DICCCOL‐PCE #95. Screenshots for the rest of DICCCOL‐PCE ROIs are available at http://dicccol.cs.uga.edu/pce.tar.gz. [Color figure can be viewed in the online issue, which is available at http://wileyonlinelibrary.com.]
As can be seen from Figure 7 and other online screenshots (http://dicccol.cs.uga.edu/pce.tar.gz), these ROIs possessed accurate structural correspondences across individuals, indicating that the DICCCOL‐PCE ROIs tend to represent the common brain architecture in PCE/control brains. As such, these DICCCOL‐PCE ROIs will be used as structural substrates to construct large connectomes [Zhu et al., in press] and explore functional connectome signatures of PCE brains in the following section.
Functional Connectome Signatures
We reconstructed functional connectomes using the resting state fMRI data based on the 348 DICCCOL‐PCE ROIs for 29 PCE subjects and 22 matched controls described in Data acquisition and preprocessing section. From a total of 60,378 functional connections, a simple t test (P‐value = 0.005) was first used to identify those with significant differences between PCE and healthy controls, resulting in 845 altered connections as shown in Figure 8a. Subsequently, a hierarchical clustering algorithm [Alizadeh et al., 2000] was used to group functional connectivities on the basis of similarity in the pattern with which their connection strength varied over all PCE/control brains. Totally, we identified 362 consistently decreased and 330 consistently increased functional connections in PCE subjects, as shown in Figure 8b,c. As the hypo‐ or hyper‐functional connectivity patterns in 29 PCE subjects, in comparison with 22 healthy controls, are quite consistent across individuals, we named the two patterns as functional connectomics signatures of PCE.
Figure 8.
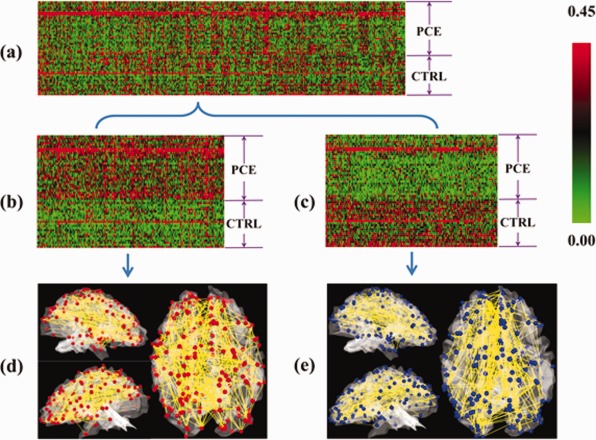
Connectomics signatures for characterization of PCE. (a) Each connectome is represented by a row of 845 connections (selected from 60,378 connections via t test, P‐value = 0.005) and each column stands for 29 PCE and 22 control subjects. Red and green stand for hyper‐ and hypo‐connectivities. Two connectomics signatures were discovered, as shown in more details in (b) and (c). The spatial distributions of these connectomics signatures on the cortical surfaces are provided in (d) and (e). [Color figure can be viewed in the online issue, which is available at http://wileyonlinelibrary.com.]
To interpret the connectomics signatures of PCE, Figure 8d,e illustrate the hypo‐ or hyper‐connectivities in PCE on a cerebral cortical surface. It is evident that both decreased and increased functional connectivities in PCE are widespread across the entire cortex, suggesting that PCE causes large‐scale functional connection alterations. Quantitatively, the percentages of increase/decreased connectivities connected to the left frontal, left parietal, left temporal, left occipital, right frontal, right parietal, right temporal, and right occipital lobes are 28.3%/27.2%, 13.5%/11.7%, 7.0%/8.9%, 2.2%/3.7%, 24.8%/25.7%, 7.0%/4.7%, 10.0%/13.6%, and 7.4%/5.6%, respectively. It can be clearly seen that the frontal lobes exhibit substantially more functional connectivity alterations than other lobes, e.g., the occipital lobes. Furthermore, we annotated the 358 DICCCOLs into 55 functional networks via task‐based fMRI and/or via meta‐analysis in the BrainMap (http://brainmap.org/) database that integrated the activations of 2,114 fMRI papers and 9,994 fMRI experiments [Laird et al., 2009]. We visualized the top 22 functional networks that are most frequently involved in the two connectomics signatures of PCE brains in this article in Figure 9a,b. The names and colors of these 22 networks are presented in Figure 9c. Quantitatively, the top five functional networks that exhibit increased functional connectivity alterations are attention, executive function, language speech, language semantic, and language emotion, and their relative contributions to the total altered connections are 21.7%, 10.0%, 9.1%, 7.8%, and 7.4%, respectively. At the same time, the top five networks that exhibit decreased connectivities are attention, emotion, executive function, language speech, and inhibition, and their alterations represent 21.5%, 7.9%, 7.5%, 6.5%, and 6.1%, respectively, of the total alterations. Apparently, the attention network is the most affected in terms of altered connectivities. In addition, it is interesting that the attention, executive function, language speech, and emotion networks are among the top five networks with both decreased and increased connectivities. These results are in the line with literature reports [Dow‐Edwards et al., 2006; Emmalee et al., 2002; Li et al., 2009b; Rose‐Jacobs et al., 2009], and systematically and comprehensively elucidated the widespread functional connectivity alterations via connectomics signatures.
Figure 9.
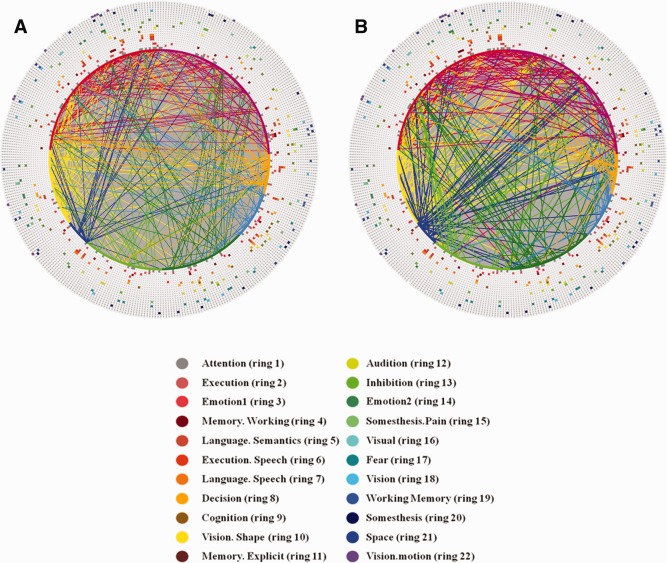
Result interpretation of connectomics signatures of PCE. For the visualization scheme in (a) and (b), 358 DICCCOL‐PCE ROIs are represented by an inner ring of color‐coded nodes, connections (corresponding to those in Figure 8d,e) are represented by lines, and 22 functional networks are represented by 22 outer rings of colored nodes. All of the colored nodes in each ring of 358 nodes stand for a functional network. The names and colors for 22 networks and their corresponding rings are shown in (c). (a) Increased functional connectivities in PCE in comparison with controls. (b) Decreased functional connectivities in PCE in comparison with controls. (c) Names and colors of top 22 functional networks that are most frequently involved in the hypo‐ or hyper‐functional connectivities in this article. [Color figure can be viewed in the online issue, which is available at http://wileyonlinelibrary.com.]
DISCUSSION AND CONCLUSION
In this article, we described a novel framework to identify a large set of cortical landmarks in PCE affected adolescents and their matched controls, named DICCCOL‐PCEs that possess accurate structural correspondences across individuals. This computational framework mainly consisted of a DICCCOL ROI prediction step and a following ROI optimization step. With these 358 DICCCOL‐PCEs, we systematically assessed the structural disruption on the cortex for PCE brains and identified 10 discrepant DICCCOL‐PCE landmarks. Interestingly, meta‐analysis demonstrates that most of these 10 discrepant landmarks are involved in brain networks reported in the literature to be involved responsible for working memory, language, executive function, motor, attention, and vision networks. Also, we determined 348 consistent DICCCOL ROIs that are corresponding in both PCE affected brains and matched controls, which provided the structural substrates for connectome construction and extraction of functional connectomics signatures in PCE. Then, we borrowed the well‐established approaches of deriving genomics signatures in genome‐wide gene expression studies to discover connectomics signatures for the characterization of PCE and identified functional connectome signatures that are able to distinctively differentiate PCE brains from their matched controls. Our results demonstrated that there are widespread functional connectivity alterations, either increasing or decreasing, in the PCE affected adolescents brains in comparison with their healthy controls.
In the future, the work in this article could be extended and enhanced in the following directions. First, the discovered connectomics signatures in Figure 9 should be replicated and crossvalidated in separate datasets by different research laboratories. In that scenario, our DICCCOL‐PCE identification and optimization framework in Materials and methods section can be applied in such independent multimodal DTI/R‐fMRI datasets for the purpose of result replication. Second, the predicted and optimized DICCCOL‐ROIs should be further validated via benchmark task‐based fMRI datasets that consistently activate corresponding functional brain areas in both PCE and control brains. Such independent validations can further support the findings in DICCCOL‐PCE prediction and optimization section and Consistent DICCCOL‐PCE ROIs section. Third, the discovered functional connectomics signatures in Functional connectome signatures section can be correlated with the PCE clinical and behavior parameters, e.g., verbal IQ and performance IQ and analyzed at both individual and group levels. Such studies could possibly generate a collection of connectomics‐based markers that are predictive of PCE clinical and behavior measurements.
Supporting information
Supporting Information
ACKNOWLEDGMENTS
The authors thank the anonymous reviewers for their valuable comments that have helped to significantly improve the article.
REFERENCES
- Alizadeh AA, Eisen MB, Davis RE, Ma C, Lossos IS, Rosenwald A, Boldrick JC, Sabet H, Tran T, Yu X, Powell JI, Yang L, Marti GE, Moore T, Hudson JJr, Lu L, Lewis DB, Tibshirani R, Sherlock G, Chan WC, Greiner TC, Weisenburger DD, Armitage JO, Warnke R, Levy R, Wilson W, Grever MR, Byrd JC, Botstein D, Brown PO, Staudt LM (2000): Distinct types of diffuse large B‐cell lymphoma identified by gene expression profiling. Nature 403:503–511. [DOI] [PubMed] [Google Scholar]
- Amunts K, Malikovic A, Mohlberg H, Schormann T, Zilles K (2000): Brodmann's areas 17 and 18 brought into stereotaxic space‐where and how variable? Neuroimage 11:66–84. [DOI] [PubMed] [Google Scholar]
- Andersson J, Smith S, Jenkinson M (2008): FNIRT—FMRIB's non‐linear image registration tool. In Fourteenth Annual Meeting of the Organization for Human Brain Mapping—HBM.
- Avants BB, Hurt H, Giannetta JM, Epstein CL, Shera DM, Rao H, Wang J, Gee JC (2007): Effects of heavy in utero cocaine exposure on adolescent caudate morphology. Pediatr Neurol 37:275–279. [DOI] [PubMed] [Google Scholar]
- Avants BB, Epstein CL, Grossman M, Gee JC (2008): Symmetric diffeomorphic image registration with cross‐correlation: Evaluating automated labeling of elderly and neurodegenerative brain. Med Image Anal 12:26–41. [DOI] [PMC free article] [PubMed] [Google Scholar]
- Bassett JM, Hanson C (1998): Catecholamines inhibit growth in fetal sheep in the absence of hypoxemia. Am J Physiol 274 ( Pt 2):R1536–R1545. [DOI] [PubMed] [Google Scholar]
- Beckmann CF, DeLuca M, Devlin JT, Smith SM (2005): Investigations into resting‐state connectivity using independent component analysis. Philos Trans R Soc Lond B Biol Sci 360:1001–1013. [DOI] [PMC free article] [PubMed] [Google Scholar]
- Biswal BB, Mennes M, Zuo XN, Gohel S, Kelly C, Smith SM, Beckmann CF, Adelstein JS, Buckner RL, Colcombe S, Dogonowski A‐M, Ernst M, Fair D, Hampson M, Hoptman MJ, Hyde JS, Kiviniemi VJ, Kötter R, Li S‐J, Lin C‐P, Lowe MJ, Mackay C, Madden DJ, Madsen KH, Margulies DS, Mayberg HS, McMahon K, Monk CS, Mostofsky SH, Nagel BJ, Pekar JJ, Peltier SJ, Petersen SE, Riedl V, Rombouts SARB, Rypma B, Schlaggar BL, Schmidt S, Seidler RD, Siegle GJ, Sorg C, Teng G‐J, Veijola J, Villringer A, Walter M, Wang L, Weng X‐C, Whitfield‐Gabrieli S, Williamson P, Windischberger C, Zang Y‐F, Zhang H‐Y, Castellanos FX, Milham MP (2010): Toward discovery science of human brain function. Proc Natl Acad Sci USA 107:4734–4739. [DOI] [PMC free article] [PubMed] [Google Scholar]
- Brett M, Johnsrude IS, Owen AM (2002): The problem of functional localization in the human brain. Nat Rev Neurosci 3:243–249. [DOI] [PubMed] [Google Scholar]
- Brown JV, Bakeman R, Coles CD, Sexson WR, Demi AS (1998): Maternal drug use during pregnancy: Are preterm and full‐term infants affected differently? Dev Psychol 34:540–554. [DOI] [PubMed] [Google Scholar]
- Cabeza R, Kingstone A (2006): Handbook of Functional Neuroimaging of Cognition, 2nd edThe MIT Press. [Google Scholar]
- Calhoun VD, Pekar JJ, Pearlson GD (2004): Alcohol intoxication effects on simulated driving: Exploring alcohol‐dose effects on brain activation using functional MRI. Neuropsychopharmacology 29:2097–3017. [DOI] [PubMed] [Google Scholar]
- Chen XC, Coles CD, Lynch ME, Hu X: Understanding specific effects of prenatal alcohol exposure on brain structure in young adults. Hum Brain Mapp.2011. Jun 20. doi: 10.1002/hbm.21313. [DOI] [PMC free article] [PubMed] [Google Scholar]
- Cohen HL, Sloves JH, Laungani S, Glass L, DeMarinis P (1994): Neurosonographic findings in full‐term infants born to maternal cocaine abusers: Visualization of subependymal and periventricular cysts. J Clin Ultrasound 22:327–333. [DOI] [PubMed] [Google Scholar]
- Coles CD, Platzman KA, Smith I, James ME, Falek A (1992): Effects of cocaine and alcohol use in pregnancy on neonatal growth and neurobehavioral status. Neurotoxicol Teratol 14:23–33. [DOI] [PubMed] [Google Scholar]
- Coles CD, Goldstein FC, Lynch ME, Chen X, Kable JA, Johnson KC, Hu X (2011): Memory and brain volume in adults prenatally exposed to alcohol. Brain Cogn 75:67–77. [DOI] [PMC free article] [PubMed] [Google Scholar]
- Cortese BM, Moore GJ, Bailey BA, Jacobson SW, Delaney‐Black V, Hannigan JH (2006): Magnetic resonance and spectroscopic imaging in prenatal alcohol‐exposed children: Preliminary findings in the caudate nucleus. Neurotoxicol Teratol 28:597–606. [DOI] [PubMed] [Google Scholar]
- Derauf C, Kekatpure M, Neyzi N, Lester B, Kosofskyb B (2009): Neuroimaging of children following prenatal drug exposure. Semin Cell Dev Biol 20:441–454. [DOI] [PMC free article] [PubMed] [Google Scholar]
- Dixon SD, Bejar R (1989): Echoencephalographic findings in neonates associated with maternal cocaine and methamphetamine use: Incidence and clinical correlates. J Pediatr 115( Pt 1):770–778. [DOI] [PubMed] [Google Scholar]
- Dow‐Edwards DL, Benveniste H, Behnke M, Bandstra ES, Singer LT, Hurd YL, Stanford LR (2006): Neuroimaging of prenatal drug exposure. Neurotoxicol Teratol 28:386–402. [DOI] [PMC free article] [PubMed] [Google Scholar]
- Elliot KT, Coker DR (1991): Crack babies: Here they come, ready or not. J Instruct Psychol 18:60–64. [Google Scholar]
- Bandstra ES, Morrow CE, Vogel AL, Fifer RC, Ofir AY, Dausa AT, Xue L, Anthony JC (2002): Longitudinal influence of prenatal cocaine exposure on child language functioning. Neurotoxicol Teratol 24:297–308. [DOI] [PubMed] [Google Scholar]
- Faraco CC, Unsworth N, Lagnely J, Terry D, Li K, Zhang D, Liu T, Miller LS (2011): Complex span tasks and hippocampal recruitment during working memory. Neuroimage 55:773–787. [DOI] [PubMed] [Google Scholar]
- Frank DA, Augustyn M, Knight WG, Pell T, Zuckerman B (2001): Growth, development, and behavior in early childhood following prenatal cocaine exposure: A systematic review. JAMA 285:1613–1625. [DOI] [PMC free article] [PubMed] [Google Scholar]
- Gieron‐Korthals MA, Helal A, Martinez CR (1994): Expanding spectrum of cocaine induced central nervous system malformations. Brain Dev 16:253–256. [DOI] [PubMed] [Google Scholar]
- Gomez‐Anson B, Ramsey RG (1994): Pachygyria in a neonate with prenatal cocaine exposure: MR features. J Comput Assist Tomogr 18:637–639. [DOI] [PubMed] [Google Scholar]
- Fillard P, Gerig G (2003): Analysis tool for diffusion tensor MRI. Lect Notes Comput Sci 2879:967–968. [Google Scholar]
- Heier LA, Carpanzano CR, Mast J, Brill PW, Winchester P, Deck MD (1991): Maternal cocaine abuse: The spectrum of radiologic abnormalities in the neonatal CNS. AJNR Am J Neuroradiol 12:951–956; 1369–1377. [PMC free article] [PubMed] [Google Scholar]
- Hurt H, Giannetta JM, Korczykowski M, Hoang A, Tang KZ, Betancourt L, Brodsky NL, Shera DM, Farah MJ, Detre JA (2008): Functional magnetic resonance imaging and working memory in adolescents with gestational cocaine exposure. J. Pediatr 152:371–377. [DOI] [PubMed] [Google Scholar]
- Hyvärinen A, Oja E (2000): Independent component analysis: Algorithms and applications. Neural Network 13:411–430. [DOI] [PubMed] [Google Scholar]
- Jack CRJr, Bernstein MA, Borowski BJ, Gunter JL, Fox NC, Thompson PM, Schuff N, Krueger G, Killiany RJ, Decarli CS, Dale AM, Carmichael OW, Tosun D, Weiner MW; Alzheimer's Disease Neuroimaging Initiative (2010): Update on the magnetic resonance imaging core of the Alzheimer's disease neuroimaging initiative. Alzheimers Dement 6:212–220. [DOI] [PMC free article] [PubMed] [Google Scholar]
- Jenkinson M, Smith SM (2001): A global optimisation method for robust affine registration of brain images. Med Image Anal 5:143–156. [DOI] [PubMed] [Google Scholar]
- Jensen A, Hohmann M, Kunzel W (1987): Redistribution of fetal circulation during repeated asphyxia in sheep: Effects on skin blood flow, transcutaneous PO2, and plasma catecholamines. J Dev Physiol 9:41–55. [PubMed] [Google Scholar]
- Kliegman RM, Madura D, Kiwi R, Eisenberg I, Yamashita T (1994): Relation of maternal cocaine use to the risks of prematurity and low birth weight. J Pediatr 124( Pt 1):751–756. [DOI] [PubMed] [Google Scholar]
- Koegler SM, Seidler FJ, Spencer JR, Slotkin TA (1991): Ischemia contributes to adverse effects of cocaine on brain development: Suppression of ornithine decarboxylase activity in neonatal rat. Brain Res Bull 27:829–834. [DOI] [PubMed] [Google Scholar]
- Laird AR, Eickhoff SB, Kurth F, Fox PM, Uecker AM, Turner JA, Robinson JL, Lancaster JL, Fox PT (2009): ALE meta‐analysis workflows via the BrainMap database: Progress towards a probabilistic functional brain atlas. Neuroinformatics 3:11. [DOI] [PMC free article] [PubMed] [Google Scholar]
- Lester B, Padbury JF (2009): The third pathophysiology of prenatal cocaine exposure. Dev Neurosci 31:23–35. [DOI] [PubMed] [Google Scholar]
- Lester BM, LaGasse LL, Shankaran S, Bada HS, Bauer CR, Lin R, Das A, Higgins R (2010): Prenatal cocaine exposure related to cortisol stress reactivity in 11‐year‐old children. J Pediatr 157:288–295. [DOI] [PMC free article] [PubMed] [Google Scholar]
- Levitt P, Harvey JA, Friedman E, Simansky K, Murphy EH (1997): New evidence for neurotransmitter influences on brain development. Trends Neurosci 20:269–274. [DOI] [PubMed] [Google Scholar]
- Li Z, Coles CD, Lynch ME, Ma X, Peltier S, Hu X (2008): Occipital‐temporal reduction and sustained visual attention deficit in prenatal alcohol exposed adults. Brain Imaging Behav 2:38–48. [DOI] [PMC free article] [PubMed] [Google Scholar]
- Li K, Guo L, Nie J, Li G, Liu T (2009a)Review of methods for functional brain connectivity detection using fMRI. Comput Med Imaging Graph 33:131–139. [DOI] [PMC free article] [PubMed] [Google Scholar]
- Li Z, Coles CD, Lynch ME, Hamann S, Peltier S, LaConte S, Hu X (2009b)Prenatal cocaine exposure alters emotional arousal regulation and its effects on working memory. Neurotoxicol Teratol 31:342–348. [DOI] [PMC free article] [PubMed] [Google Scholar]
- Li K, Guo L, Li G, Nie J, Faraco C, Zhao Q, Miller LS, Liu T (2010a):. In Proceedings of ISBI; pp656–659.
- Li K, Guo L, Faraco C, Zhu D, Deng F, Zhang T, Jiang X, Zhang DG, Chen H, Hu X, Miller LS, Liu T (2010b): Individualized ROI optimization via maximization of group‐wise consistency of structural and functional profiles. Adv Neural Info Proc Syst 23. [Google Scholar]
- Li Z, Santhanam P, Coles CD, Lynch ME, Hamann S, Peltier S, Hu X (2011): Increased “Default Mode” activity in adolescents prenatally exposed to cocaine. Hum Brain Mapp 32:759–770. [DOI] [PMC free article] [PubMed] [Google Scholar]
- Li K, Guo L, Zhu D, Hu X, Han J, Liu T: Individual functional ROI optimization via maximization of group‐wise consistency of structural and functional profiles. Neuroinformatics 2012. Jan 28. [DOI] [PMC free article] [PubMed] [Google Scholar]
- Lidow MS, Song ZM (2001a)Primates exposed to cocaine in utero display reduced density and number of cerebral cortical neurons. J Comp Neurol 435:263–275. [DOI] [PubMed] [Google Scholar]
- Lidow MS, Song ZM (2001b)Effect of cocaine on cell proliferation in the cerebral wall of monkey fetuses. Cereb Cortex 11:545–551. [DOI] [PubMed] [Google Scholar]
- Lipton JW, Vu TQ, Ling Z, Gyawali S, Mayer JR, Carvey PM (2002): Prenatal cocaine exposure induces an attenuation of uterine blood flow in the rat. Neurotoxicol Teratol 24:143–148. [DOI] [PubMed] [Google Scholar]
- Liu T (2011): A few thoughts on brain ROIs. Brain Imaging Behav 5:189–202. [DOI] [PMC free article] [PubMed] [Google Scholar]
- Liu T, Shen D, Davatzikos C (2004): Deformable registration of cortical structures via hybrid volumetric and surface warping. NeuroImage 22:1790–1801. [DOI] [PubMed] [Google Scholar]
- Liu T, Li H, Wong K, Tarokh A, Guo L, Wong ST (2007): Brain tissue segmentation based on DTI data. Neuroimage 38:114–123. [DOI] [PMC free article] [PubMed] [Google Scholar]
- Liu T, Nie J, Tarokh A, Guo L, Wong ST (2008): Reconstruction of central cortical surface from MRI brain images: Method and application. Neuroimage 40:991–1002. [DOI] [PMC free article] [PubMed] [Google Scholar]
- Lv J, Guo L, Hu X, Zhang T, Li K, Zhang D, Yang J, Liu T (2010): Fiber‐centered analysis of brain connectivities using DTI and resting state FMRI data. Med Image Comput Comput Assist Interv 13( Pt 2):143–150. [DOI] [PubMed] [Google Scholar]
- Malanga CJIII, Kosofsky BE (1999): Mechanisms of action of drugs of abuse on the developing fetal brain. Clin Perinatol 26:17–37. [PubMed] [Google Scholar]
- Meier E, Hertz L, Schousboe A (1991): Neurotransmitters as developmental signals. Neurochem Int 19:1–15. [Google Scholar]
- Miller‐Loncar C, Lester BM, Seifer R, Lagasse LL, Bauer CR, Shankaran S, Bada HS, Wright LL, Smeriglio VL, Bigsby R, Liu J (2005): Predictors of motor development in children prenatally exposed to cocaine. Neurotoxicol Teratol 27:213–220. [DOI] [PubMed] [Google Scholar]
- Passingham RE, Stephan KE, Kötter R (2002): The anatomical basis of functional localization in the cortex. Nat Rev Neurosci 3:606–616. [DOI] [PubMed] [Google Scholar]
- Rivkin MJ, Davis PE, Lemaster JL, Cabral HJ, Warfield SK, Mulkern RV, Robson CD, Rose‐Jacobs R, Frank DA (2008): Volumetric MRI study of brain in children with intrauterine exposure to cocaine, alcohol, tobacco, and marijuana. Pediatrics 121:741–750. [DOI] [PMC free article] [PubMed] [Google Scholar]
- Rose‐Jacobs R, Waber D, Beeghly M, Cabral H, Appugleise D, Heeren T, Marani J, Frank DA (2009): Intrauterine cocaine exposure and executive functioning in middle childhood. Neurotoxicol Teratol 31:159–168. [DOI] [PMC free article] [PubMed] [Google Scholar]
- Santhanam P, Li Z, Hu X, Lynch ME, Coles CD (2009): Effects of prenatal alcohol exposure on brain activation during an arithmetic task: An fMRI study. Alcohol Clin Exp Res 33:1901–1908. [DOI] [PMC free article] [PubMed] [Google Scholar]
- Santhanam P, Coles CD, Li Z, Li L,Lynch ME, Hu X (2011): Default mode network dysfunction in adults with prenatal alcohol exposure. Psychiatry Res 194:354–362. [DOI] [PMC free article] [PubMed] [Google Scholar]
- Shankaran S, Lester BM, Das A, Bauer CR, Bada HS, Lagasse L, Higgins R (2007): Impact of maternal substance use during pregnancy on childhood outcome. Semin Fetal Neonatal Med 12:143–150. [DOI] [PMC free article] [PubMed] [Google Scholar]
- Sheinkopf SJ, Lester BM, Sanes JN, Eliassen JC, Hutchison E, Seifer R, LaGasse L, Durston S, Casey BJ (2009): Functional MRI and response inhibition in children exposed to cocaine in utero: Preliminary findings. Dev Neurosci 31:159–166. [DOI] [PMC free article] [PubMed] [Google Scholar]
- Shen D, Davatzikos C (2002): HAMMER: Hierarchical attribute matching mechanism for elastic registration. IEEE Trans Med Imaging 21:1421–1439. [DOI] [PubMed] [Google Scholar]
- Van Essen DC, Dierker DL (2007): Surface‐based and probabilistic atlases of primate cerebral cortex. Neuron 56:209–225. [DOI] [PubMed] [Google Scholar]
- Volpe JJ (1987):Neurology of the Newborn.Philadelphia, PA:W.B. Saunders, Co. [Google Scholar]
- Warner TD, Behnke M, Eyler FD, Padgett K, Leonard C, Hou W, Garvan CW, Schmalfuss IM, Blackband SJ(2006): Diffusion tensor imaging of frontal white matter and executive functioning in cocaine‐exposed children. Pediatrics 118:2014–2024. [DOI] [PMC free article] [PubMed] [Google Scholar]
- Woods JRJr, Plessinger MA, Clark KE (1987): Effect of cocaine on uterine blood flow and fetal oxygenation. JAMA 257:957–961. [PubMed] [Google Scholar]
- Zang Y, Jiang T, Lu Y, He Y, Tian L (2004): Regional homogeneity approach to fMRI data analysis. Neuroimage 22:394–400. [DOI] [PubMed] [Google Scholar]
- Zhang T, Guo L, Li K, Jing C, Yin Y, Zhu D, Cui G, Li L, Liu T (2011): Predicting functional cortical ROIs via DTI‐derived fiber shape models. Cereb. Cortex, doi: 10.1093/cercor/bhr152. [DOI] [PMC free article] [PubMed]
- Zhu D, Zhang D, Faraco C, Li K, Deng F, Chen H, Jiang X, Guo L, Miller LS, Liu T (2011): Discovering dense and consistent landmarks in the brain. Inf Process Med Imaging 22:97–110. [DOI] [PubMed] [Google Scholar]
- Zhu D, Li K, Faraco CC, Deng F, Zhang D, Guo L, Miller LS, Liu T (2012): Optimization of functional brain ROIs via maximization of consistency of structural connectivity profiles. Neuroimage 59:1382–1393. [DOI] [PMC free article] [PubMed] [Google Scholar]
- Zhu D, Li K, Guo L, Jiang X, Zhang T, Zhang D, Chen H, Deng F, Faraco C, Jin C, Wee CY, Yuan Y, Lv P, Yin Y, Hu XL, Duan L, Hu XT, Han J, Wang L, Shen D, Miller LS, Li LJ, Liu T:. DICCCOL: Dense individualized and common connectivity‐based cortical landmarks (in press). [DOI] [PMC free article] [PubMed]
Associated Data
This section collects any data citations, data availability statements, or supplementary materials included in this article.
Supplementary Materials
Supporting Information