Abstract
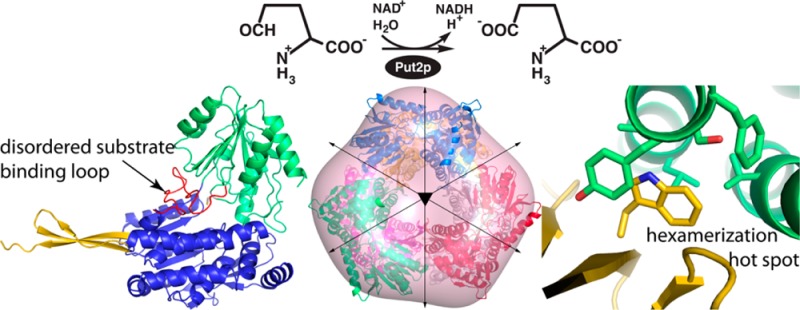
The proline catabolic enzyme Δ1-pyrroline-5-carboxylate dehydrogenase (ALDH4A1) catalyzes the NAD+-dependent oxidation of γ-glutamate semialdehyde to l-glutamate. In Saccharomyces cerevisiae, ALDH4A1 is encoded by the PUT2 gene and known as Put2p. Here we report the steady-state kinetic parameters of the purified recombinant enzyme, two crystal structures of Put2p, and the determination of the oligomeric state and quaternary structure from small-angle X-ray scattering and sedimentation velocity. Using Δ1-pyrroline-5-carboxylate as the substrate, catalytic parameters kcat and Km were determined to be 1.5 s–1 and 104 μM, respectively, with a catalytic efficiency of 14000 M–1 s–1. Although Put2p exhibits the expected aldehyde dehydrogenase superfamily fold, a large portion of the active site is disordered in the crystal structure. Electron density for the 23-residue aldehyde substrate-binding loop is absent, implying substantial conformational flexibility in solution. We furthermore report a new crystal form of human ALDH4A1 (42% identical to Put2p) that also shows disorder in this loop. The crystal structures provide evidence of multiple active site conformations in the substrate-free form of the enzyme, which is consistent with a conformational selection mechanism of substrate binding. We also show that Put2p forms a trimer-of-dimers hexamer in solution. This result is unexpected because human ALDH4A1 is dimeric, whereas some bacterial ALDH4A1s are hexameric. Thus, global sequence identity and domain of life are poor predictors of the oligomeric states of ALDH4A1. Mutation of a single Trp residue that forms knob-in-hole interactions across the dimer–dimer interface abrogates hexamer formation, suggesting that this residue is the center of a protein–protein association hot spot.
The mitochondrial enzymes Put1p and Put2p catalyze proline catabolism in Saccharomyces cerevisiae (Figure 1). Put1p is a flavin-dependent dehydrogenase that catalyzes the oxidation of l-proline to Δ1-pyrroline-5-carboxylate (P5C) and couples proline oxidation to reduction of ubiquinone.1 Put2p is a P5C dehydrogenase (P5CDH, EC 1.2.1.88, formerly EC 1.5.1.12) and is also known as ALDH4A1 in reference to its membership in family 4 of the aldehyde dehydrogenase (ALDH) superfamily.2 Put2p catalyzes the NAD+-dependent oxidation of γ-glutamate semialdehyde (GSA, the hydrolysis product of P5C) to l-glutamate. In total, the proline catabolic pathway catalyzes a four-electron oxidation of proline.
Figure 1.
Reactions catalyzed by the yeast proline catabolic enzymes Put1p and Put2p.
Several studies have shown that proline is important in various organisms for stress protection.3 The accumulation of proline in yeast leads to improved freeze tolerance.4 In contrast to that of proline, the accumulation of P5C is associated with toxicity effects and induced cell death in yeast.5,6 Coordinated expression of PUT1 and PUT2 is important for avoiding buildup of P5C. The PUT1 and PUT2 genes are upregulated by proline under nitrogen limiting conditions and, together with glutamate dehydrogenase, allow yeast to utilize proline as a nitrogen source.7 The mechanism of P5C toxicity involves inhibition of mitochondrial respiration and an increased level of production of reactive oxygen species.5 Interestingly, an N-acetyltransferase enzyme known as Mpr1 acetylates P5C, thereby decreasing its level of accumulation and weakening its harmful effects in yeast.8
Mammalian P5CDHs have been characterized biochemically. Early studies of the human (HsP5CDH) and rat enzymes established the order of substrate binding and product release, as well as substrate preferences.9−11 More recent work on HsP5CDH and mouse P5CDH (MmP5CDH) provided additional details about the kinetic mechanism and the molecular basis of type II hyperprolinemia,12 a metabolic disorder caused by a defect in ALDH4A1 function.13−15
The three-dimensional structures of P5CDHs have been studied intensely. Tahirov’s group reported the first P5CDH structure using the enzyme from Thermus thermophilus (TtP5CDH).16,17 We subsequently determined the structures of HsP5CDH and MmP5CDH,12,18 and the New York Structural Genomics Research Consortium has deposited structures of two Bacillus P5CDHs in the Protein Data Bank (PDB) (entries 3QAN and 3RJL). Collectively, the structures confirmed P5CDH as a member of the ALDH superfamily, contributed additional information about the catalytic mechanism, and provided insight into the structural basis of cofactor and semialdehyde selectivity. We also determined the solution oligomeric states and quaternary structures of several P5CDHs.19 The human, mouse, and Bacillus enzymes are dimeric in solution, whereas TtP5CDH and Deinococcus radiodurans P5CDH (DrP5CDH) form trimer-of-dimers hexamers in solution. Thus, the protein fold, but not the oligomeric state, is conserved within the ALDH4A1 subfamily.
Although the yeast PUT genes were identified more than 30 years ago, the Put1p and Put2p enzymes have remained relatively understudied. Wanduragala et al. reported the purification and characterization of Put1p in 2010,1 but analogous studies of Put2p have not appeared in the literature. We therefore have created a recombinant bacterial expression system for Put2p, measured the steady-state kinetic parameters of the purified enzyme, determined the crystal structure, and deduced the oligomeric state and quaternary structure in solution from small-angle X-ray scattering (SAXS).
Experimental Procedures
Subcloning and Mutagenesis
The PUT2 gene was obtained from M. Brandriss of the Rutgers New Jersey Medical School and subcloned into vectors pET14b using NdeI and XhoI and pKA8H between NdeI and BamHI restriction sites, resulting in pET14b-PUT2 and pKA8H-PUT2 constructs. DNA encoding residues 23–575, which lacks the N-terminal mitochondrial targeting peptide,20 was amplified from pKA8H using AAACATATGAAGCCCCCCAAGCACATAAG as the forward primer and the T7 terminator as the reverse primer. The resulting fragment was subcloned into pKA8H using NdeI and BamHI to give the pKA8H-PUT2Δ22 construct. The expressed protein has an N-terminal His8 tag and tobacco etch virus protease cleavage site.
The W193A mutant of Put2p was created from pKA8H-PUT2Δ22 with the QuikChange II site-directed mutagenesis kit (Agilent) using the forward primer (5′-GGTACAATCTACCGTTTGCTGACAGATCTGC-3′) and reverse primer (5′-GCAGATCTGTCAGCAAACGGTAGATTGTACC-3′). The mutation was confirmed using DNA sequencing.
Expression and Purification of Put2p
Put2p and Put2p mutant W193A were expressed in Bl21(DE3)pLysS cells. Cells were grown at 37 °C and 250 rpm until the OD600 reached 0.6 and induced with 0.5 mM IPTG for 8 h at 22 °C and 200 rpm. The cells were harvested by centrifugation at 3500 rpm for 30 min and resuspended in 20 mM HEPES, 60 mM NaCl, and 5% glycerol (pH 8.0). Cells were quick frozen in liquid nitrogen and stored at −80 °C until they were further purified.
Thawed cells were broken by sonication and centrifuged at 16500 rpm for 1 h. The supernatant was applied to a HisTrap HP column that had been charged with Ni2+ and equilibrated with 20 mM HEPES, 300 mM NaCl, and 5% glycerol (pH 8.0). The column was washed with equilibration buffer supplemented with 30 mM imidazole, and the enzyme was eluted with 300 mM imidazole. Fractions containing Put2p were pooled, dialyzed into 50 mM Tris, 0.5 mM EDTA, 0.5 mM tris(hydroxypropyl)phosphine (THP), and 5% glycerol (pH 8.0), and loaded onto a HiTrap Q anion exchange column. Put2p was eluted with a linear gradient of NaCl from 0 to 1 M. Fractions were analyzed via sodium dodecyl sulfate–polyacrylamide gel electrophoresis, pooled, and dialyzed into 50 mM Tris, 150 mM NaCl, 0.5 mM EDTA, 0.5 mM THP, and 5% glycerol (pH 8.0).
Crystallization of Put2p
Crystallization trials were performed in sitting drops at 20 °C using drops formed by mixing 1 μL each of the enzyme and reservoir solutions. Crystal screening using commercially available kits (Hampton Research) was used to identify promising crystallization conditions.
Put2p expressed from pKA8H-PUT2Δ22, including the N-terminal His tag, was used for crystallization. Optimized crystals were grown using 8 mg/mL enzyme and a reservoir containing 8–14% (w/v) polyethylene glycol (PEG) 3350, 0.1 M (NH4)2SO4, and 0.1 M Bis-Tris (pH 5.5–6.5). The crystals were cryoprotected with 15% PEG 3350, 0.1 M (NH4)2SO4, 0.1 M Bis-Tris (pH 6.0), and 20% glycerol. The cryoprotected crystals were harvested with nylon loops (Hampton Research) and plunged into liquid nitrogen. The space group is P63 with a = 109 Å and c = 181 Å. The asymmetric unit contains one dimer and 51% solvent, based on the method of Matthews.21
Crystals of Put2p complexed with NAD+ were obtained by cocrystallization using the procedure described above for the ligand-free crystals. A stock solution containing 10 mM NAD+ and 7 mg/mL enzyme was used for crystallization. Optimized crystals were grown by combining this stock and an equal volume of a reservoir containing 8–14% (w/v) PEG 3350, 0.1 M (NH4)2SO4, and 0.1 M Bis-Tris (pH 5.5–6.5). These crystals were cryoprotected with 12% PEG 3350, 0.1 M (NH4)2SO4, 10 mM NAD+, 0.1 M Bis-Tris (pH 5.5), and 15% (v/v) PEG 200. The cryoprotected crystals were harvested with nylon loops and plunged into liquid nitrogen. The space group is P63 with a = 108 Å and c = 181 Å with a dimer in the asymmetric unit.
Expression, Purification, and Crystallization of Tag-Free HsP5CDH
HsP5CDH residues 18–563 with an N-terminal His tag were expressed and purified as described previously.12 The His tag was removed with thrombin as follows. The purified protein was dialyzed into thrombin cleavage buffer [20 mM Tris, 150 mM NaCl, 2.5 mM CaCl2, and 5% glycerol (pH 8.0)] and incubated with thrombin (1 unit of thrombin per 4 mg of HsP5CDH) for 1 day at 4 °C. Thrombin was removed using a HiTrap Benzamidine FF affinity column. The cleaved His tag and residual unprocessed HsP5CDH were removed by passing the sample through a Ni2+-charged HisTrap HP column. The tag-free enzyme was collected in the flow-through, dialyzed into 50 mM Tris, 50 mM NaCl, 0.5 mM EDTA, 0.5 mM THP, and 5% glycerol (pH 8.0), and concentrated to 6 mg/mL for crystallization trials.
Crystal screening revealed a promising crystal form grown in PEG 3350 and MgCl2. Optimized crystals were grown using a reservoir of 20–25% (w/v) PEG 3350, 0.2 M MgCl2, and 0.1 M HEPES (pH 7.0–8.0). The crystals were cryoprotected with 25% (w/v) PEG 3350, 0.2 M MgCl2, 0.1 M HEPES (pH 7.5), and 20% (v/v) PEG 200. The cryoprotected crystals were harvested with nylon loops and plunged into liquid nitrogen. The space group is P21 with a = 92.0 Å, b = 121.3 Å, c = 93.4 Å, and β = 104.2°. The asymmetric unit contains two dimers and 39% solvent.21 This form differs from the hexagonal form of His-tagged HsP5CDH reported previously.12
X-ray Diffraction Data Collection, Phasing, and Refinement
Crystals were analyzed at NE-CAT beamlines 24-ID-C and 24-ID-E at the Advanced Photon Source using a Quantum 315 detector (Table 1). The Put2p data set was obtained at beamline 24-ID-C and consisted of 105 frames collected with an oscillation width of 1°, a detector distance of 225 mm, and an exposure time of 1.0 s/frame at 7% transmission. The data were processed to 1.95 Å resolution using HKL2000.22 Data from Put2p–NAD+ crystals were collected at beamline 24-ID-E and processed with XDS.23 The 2.2 Å resolution data set consisted of 70 frames collected with an oscillation width of 1°, a detector distance of 200 mm, and an exposure time of 1.0 s/frame at 55% transmission. Data from HsP5CDH crystals were collected at beamline 24-ID-C. The data set used for refinement consisted of 180 frames collected with an oscillation width of 1°, a detector distance of 250 mm, and an exposure time of 1.0 s/frame at 4% transmission. The data were processed to 1.95 Å resolution using HKL2000.
Table 1. X-ray Diffraction Data Collection and Refinementa.
| Put2p | Put2p–NAD+ | HsP5CDH | |
|---|---|---|---|
| space group | P63 | P63 | P21 |
| unit cell dimensions | a = 109.0 Å, c = 181.2 Å | a = 108.0 Å, c = 181.0 Å | a = 92.0 Å, b = 121.3 Å, c = 93.4 Å, β = 104.2° |
| wavelength (Å) | 0.979 | 0.979 | 0.979 |
| resolution (Å) | 50.0–1.95 (2.02–1.95) | 93.6–2.17 (2.29–2.17) | 50.0–1.95 (2.02–1.95) |
| no. of observations | 579452 | 277102 | 489835 |
| no. of unique reflections | 88348 | 63148 | 139296 |
| Rmerge(I) | 0.061 (0.525) | 0.057 (0.583) | 0.049 (0.453) |
| mean I/σ | 32.1 (3.4) | 16.5 (2.3) | 24.2 (2.2) |
| completeness (%) | 99.9 (100.0) | 99.8 (98.9) | 96.5 (93.0) |
| multiplicity | 6.6 (6.5) | 4.4 (4.4) | 3.5 (3.3) |
| no. of protein residues | 971 | 961 | 2054 |
| no. of atoms | 7755 | 7578 | 15436 |
| no. of NAD+ atoms | 0 | 62 | 0 |
| no. of water molecules | 245 | 173 | 241 |
| no. of PEG atoms | 0 | 0 | 45 |
| no. of Mg2+ ions | 0 | 0 | 1 |
| Rcryst | 0.177 (0.211) | 0.173 (0.235) | 0.194 (0.228) |
| Rfreeb | 0.202 (0.240) | 0.212 (0.275) | 0.235 (0.301) |
| root-mean-square deviation for bond lengths (Å) | 0.007 | 0.008 | 0.007 |
| root-mean-square deviation for bond angles (deg) | 1.03 | 1.09 | 1.01 |
| Ramachandran plotc | |||
| favored (%) | 98.64 | 97.99 | 98.48 |
| outliers (no. of residues) | 0 | 0 | 0 |
| MolProbity score (percentile) | 100 | 99 | 100 |
| average B (Å2) | |||
| protein | 27.7 | 39.6 | 33.2 |
| NAD+ | – | 41.5 | – |
| water | 26.2 | 34.4 | 26.7 |
| PEG | – | – | 44.6 |
| Mg2+ | – | – | 40.5 |
| coordinate error (Å)d | 0.21 | 0.26 | 0.24 |
| PDB entry | 4OE6 | 4OE4 | 4OE5 |
Values for the outer resolution shell of data are given in parentheses.
A 5% test set. A common set was used for refinement of the Put2p structures.
The Ramachandran plots were generated with RAMPAGE via the PDB validation server.47
Maximum likelihood-based coordinate error estimate reported by PHENIX.
The phase problem was solved using molecular replacement as implemented in MOLREP.24 The search model for Put2p was derived from a 1.3 Å resolution structure of mouse P5CDH (PDB entry 3V9J,12 43% identical sequence over 543 residues). The search model for HsP5CDH was obtained from a 2.5 Å resolution structure of HsP5CDH (PDB entry 3V9G(12)). The models from molecular replacement were used as the starting points for several rounds of model building with COOT25 and refinement with PHENIX.26 The refined Put2p structure was used as the starting point for refinement of the structure of the Put2p–NAD+ complex.
Small-Angle X-ray Scattering of Put2p
In preparation for SAXS studies, wild-type Put2p was purified in a manner similar to that used for crystallization except for the following modifications. After the first Ni2+ affinity step, tobacco etch virus protease was added to the pooled fractions and incubated at 28 °C for 2 h. The protein was then dialyzed overnight against 20 mM HEPES, 100 mM NaCl, and 5% glycerol (pH 8.2). The protein was then injected onto the Ni2+ affinity column and eluted at 30 mM imidazole. The fractions were collected, pooled, and dialyzed overnight against 50 mM Tris (pH 7.5), 0.5 mM EDTA, 0.5 mM THP, and 5% glycerol. The protein was further purified using anion exchange (HiTrap Q) and dialyzed into 50 mM Tris, 150 mM NaCl, 0.5 mM EDTA, 0.5 mM THP, and 5% glycerol (pH 8.0). Finally, size exclusion chromatography was performed using a Superdex 200 column that had been equilibrated in dialysis buffer. Protein appearing in the void volume was discarded, while protein that eluted as a single peak that was clearly separated from the void volume was collected. The pooled fractions had a concentration of approximately 3 mg/mL (BCA method). The protein was then concentrated using a Millipore centrifugal unit to 7 mg/mL. The flow-through of the centrifugal unit was reserved as the reference for SAXS. Put2p mutant W193A was prepared similarly, except that the final buffer had a somewhat lower pH and a higher ionic strength [50 mM Tris, 300 mM NaCl, 0.5 mM EDTA, 0.5 mM THP, and 5% glycerol (pH 7.5)].
SAXS experiments were performed at SIBYLS beamline 12.3.1 of the Advanced Light Source through the mail-in program.27,28 For each sample, scattering intensities were measured at three nominal protein concentrations. Data were collected for each protein concentration at exposure times of 0.5, 1.0, 3.0, and 6.0 s. The scattering curves collected from the protein samples were corrected for background scattering using intensity data collected from the reference buffer.
The SAXS data were analyzed as follows. Composite scattering curves were generated with PRIMUS29 by scaling and merging the background-corrected low-q region data from the 0.5 s exposure (wild type) or 0.1 s exposure (W193A) with the high-q region data from the 3.0 s exposure (wild type) or 6.0 s exposure (W193A). PRIMUS was also used to perform Guinier analysis. FoXS was used to calculate theoretical scattering profiles from atomic models.30 GNOM was used to calculate pair distribution functions.31 The SASTBX server32 was used for shape reconstruction calculations.
Analytical Ultracentrifugation
W193A (His tag removed) was analyzed by sedimentation velocity using a Beckman XL-I analytical ultracentrifuge. Following dialysis to equilibrium against the buffer [50 mM Tris, 300 mM NaCl, 0.5 mM EDTA, 0.5 mM THP, and 5% glycerol (pH 7.5)], the protein solution was diluted with dialysis buffer to yield an absorbance (at 280 nm) of 0.95 in a 1.0 cm path length cuvette. A 400 μL aliquot was loaded into the sample compartment of a double-sector cell, assembled with a 1.2 cm charcoal-Epon centerpiece and quartz windows. A slightly larger volume (430 μL) of dialysis buffer was placed in the reference compartment. The sample cell was placed in the rotor and allowed to equilibrate to 20 °C in the rotor chamber for 2 h under vacuum, prior to beginning the experiment. The sample was then sedimented at 30000 rpm, acquiring data at 4 min intervals, until a total of 170 scans had been collected. The resulting data set was analyzed with SEDFIT version 9.4,33 using the continuous c(s) and continuous c(M) distribution models, allowing the frictional ratio to float.
Steady-State Kinetics
P5CDH activity was measured with Put2p expressed from pET14b-PUT2, including the N-terminal six-His tag. Put2p activity was followed by monitoring the formation of NADH at 20 °C as described previously for human P5CDH.12 The assay buffer contained 50 mM potassium phosphate (pH 7.5) and 25 mM NaCl. The Put2p concentration was 0.4 μM (25.6 μg/mL), and the NAD+ concentration was held constant at 0.2 mM. Initial velocity data were collected using L-P5C concentrations from 1 to 300 μM. Initial velocity data were fit to the Michaelis–Menten equation to estimate Km and kcat.
Results
Steady-State Kinetics Measurements
Brandriss and co-workers previously measured Put2p enzymatic activity in cellular and mitochondrial extracts to verify the identity of the enzyme and determine the subcellular location.34−36 To the best of our knowledge, the catalytic properties of the purified enzyme have not been studied. We therefore performed steady-state kinetic measurements of recombinant Put2p. Kinetic parameters for Put2p were as follows: Km = 104 ± 4 μM L-P5C, and kcat = 1.5 ± 0.3 s–1, with kcat/Km = 14000 ± 3000 M–1 s–1. For reference, the kinetic constants for human P5CDH are a Km of 32 μM L-P5C and a kcat of 10.0 s–1 (kcat/Km = 312500 M–1 s–1).12
Protomer Structure of Put2p
The 1.95 Å resolution crystal structure of Put2p was determined (Table 1). Put2p exhibits the expected ALDH fold, which consists of three domains (Figure 2A). The N-terminal half of the polypeptide chain contains a Rossmann fold domain and binds NAD+ (residues 43–181, 200–319, and 536–553). The catalytic domain (residues 320–535) interrupts the NAD+-binding domain and exhibits an open α/β fold featuring a twisted seven-stranded β-sheet with all but one strand in parallel. This domain furnishes the essential cysteine nucleophile (Cys351), which is situated at the interface of the NAD+-binding and catalytic domains. The third domain is a bipartite β substructure consisting of residues 182–199 and 554–565 that protrudes from the NAD+-binding domain. This domain is involved in oligomerization. As with other ALDHs, Put2p forms a dimer in which the oligomerization domain of one protomer engages the catalytic domain of the other protomer (Figure 2B). The asymmetric unit contains one dimer. As described below, three Put2p dimers assemble into a hexamer in solution.
Figure 2.
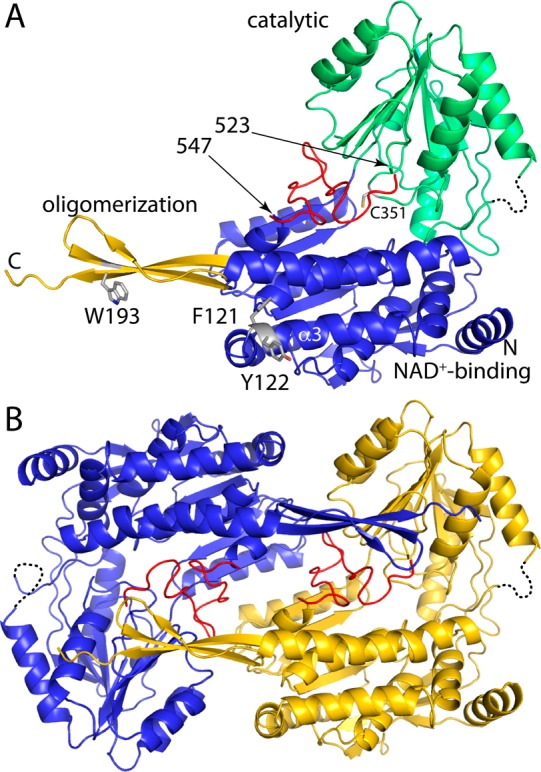
Structure of Put2p. (A) Protomer with the catalytic domain colored green, the NAD+-binding domain blue, and the oligomerization domain gold. The red sections represent the aldehyde-binding loop (transplanted from a MmP5CDH structure), which is disordered in Put2p. Selected side chains of the hexamerization hot spot are colored gray (Trp193, Phe121, and Tyr122). (B) Structure of the Put2p dimer in the asymmetric unit. The two protomers are colored blue and gold. Red sections represent the aldehyde-binding loop, which is disordered in Put2p.
The most conspicuous feature of the Put2p structure is that which is unseen. ALDHs have an ∼25-residue peptide that connects the last strand of the catalytic domain to the second piece of the oligomerization domain. This section corresponds to residues 523–547 of Put2p. Electron density for these residues is very weak, implying substantial conformational disorder (Figure 3A). The lack of density for this part of the protein gives the impression of a large void running lengthwise through the middle of the dimer (Figure 3A).
Figure 3.
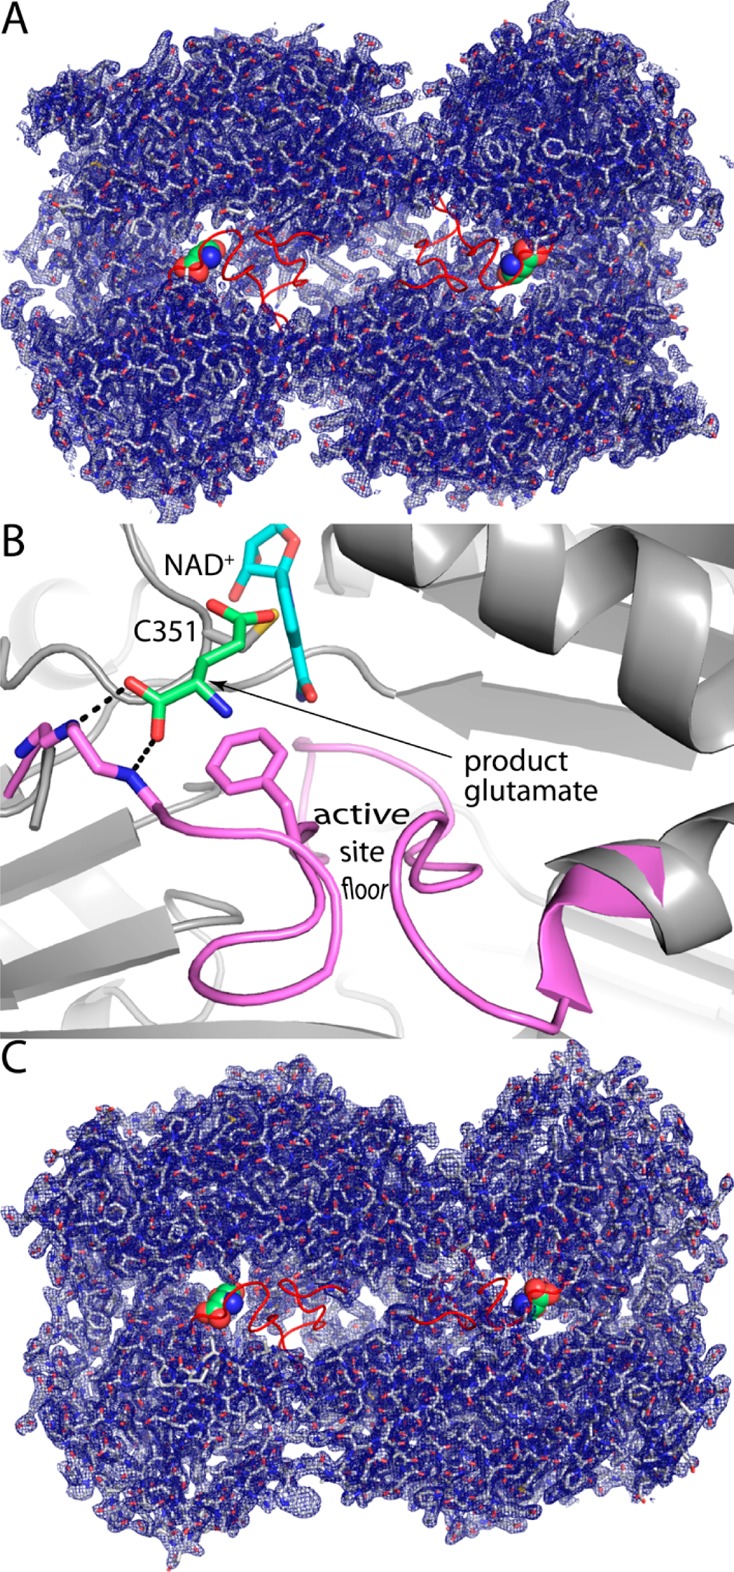
Electron density evidence for disorder in the aldehyde-binding loops of Put2p and HsP5CDH. (A) Put2p dimer with 2Fo – Fc electron density (1.0σ). The red sections represent the aldehyde-binding loops transplanted from MmP5CDH. The green spheres represent the product glutamate bound to MmP5CDH (PDB entry 3v9k). (B) Close-up view of the expected conformation of the aldehyde-binding loop in Put2p. Put2p is colored gray. The aldehyde-binding loop (pink), bound glutamate ligand (green), and NAD+ of MmP5CDH have been fit onto Put2p to guide the eye. (C) Dimer of monoclinic HsP5CDH with 2Fo – Fc electron density (1.0σ). The red sections represent the aldehyde-binding loop of MmP5CDH, which is disordered in the monoclinic crystal form of HsP5CDH. The green spheres represent the product glutamate bound to MmP5CDH.
The omission of residues 524–546 from the Put2p model is notable because this region of ALDHs anchors the aldehyde substrate in the active site (Figure 3B). In other P5CDHs (and ALDHs in general), the 25-residue aldehyde-binding loop folds into a two-stranded antiparallel β-sheet that forms the floor of the aldehyde substrate entrance tunnel. In P5CDHs, the beginning of the peptide provides critical hydrogen bonding groups that anchor the backbone of GSA, as well as a conserved Phe that packs against the aliphatic chain of GSA (Figure 3B).12,16,18 The observation of disorder in the aldehyde anchor peptide suggests the hypothesis that in solution the anchor peptide samples conformations other than the one that binds the substrate.
Structure of the Put2p–NAD+ Complex
The structure of Put2p complexed with NAD+ was determined (Table 1). Electron density for the ADP group of NAD+ is strong in both protomers (Figure 4). Density for the nicotinamide ribose is strong in one protomer and somewhat weaker in the other. Density for the nicotinamide is diffuse in both protomers, implying disorder, and thus, the nicotinamide was omitted from the final model deposited in the PDB. Disorder of the nicotinamide has been reported for ALDHs.12,16,37
Figure 4.
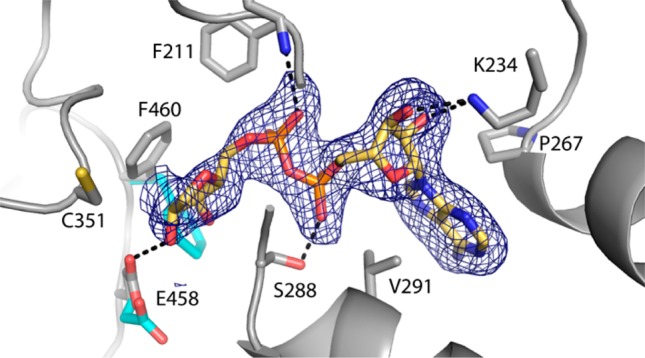
Electron density and interactions for NAD+ bound to Put2p. The cage represents a simulated annealing σA-weighted Fo – Fc omit map contoured at 3.0σ. The conformations of Glu458 and Phe460 prior to NAD+ binding are colored cyan.
NAD+ binds in the expected location, with the adenine ring wedged between valine and proline residues belonging to helices of the Rossmann fold domain (Figure 4). The adenine ribose forms hydrogen bonds with Lys234, and the pyrophosphate interacts with Ser288. The nicotinamide ribose hydrogen bonds with Glu458. These interactions are also observed in the structure of the MmP5CDH–NAD+ complex.12
Binding of the cofactor is accompanied by side chain rotations (Figure 4). Phe460 rotates around χ1 by 96° to avoid a steric clash with the nicotinamide ribose. Glu458 rotates by 120°, allowing a hydrogen bond with the nicotinamide ribose. These torsional rotations have not been reported for other P5CDHs.
Structure of Monoclinic HsP5CDH
To further explore the idea that the aldehyde anchor peptide is flexible in solution, the structure of a second eukaryotic P5CDH without a ligand bound in the aldehyde site was determined. The structure of ligand-free HsP5CDH was determined from a new monoclinic crystal form (Table 1) that was obtained only after cleaving the N-terminal His tag.
As in the Put2p structure, electron density for the aldehyde anchor peptide of monoclinic HsP5CDH (residues 514–535) is very weak (Figure 3C). Electron density for these residues is essentially absent in chains A and D, and the entire loop was omitted. In the other two chains in the asymmetric unit, the binding of Mg2+ from the crystallization buffer stabilizes residues 522–535 in a non-native conformation, but the other residues of the loop remain disordered. Thus, the disordered active site is not limited to Put2p.
Oligomeric State and Quaternary Structure of Put2p
The oligomeric state of Put2p in solution was investigated using SAXS (Figure 5). Guinier plots of data from three samples having different protein concentrations yield a radius of gyration (Rg) in the range of 47–48 Å. Calculations of the pair distribution function suggest a maximal particle dimension of 140–150 Å and an Rg of 45 Å. The Rg of the Put2p dimer in the asymmetric unit (Figure 2B) is only 31.5 Å, which suggests that a higher-order oligomer is formed in solution. Furthermore, the theoretical SAXS curve calculated from the dimer deviates substantially from the experimental curve (Figure 5A).
Figure 5.
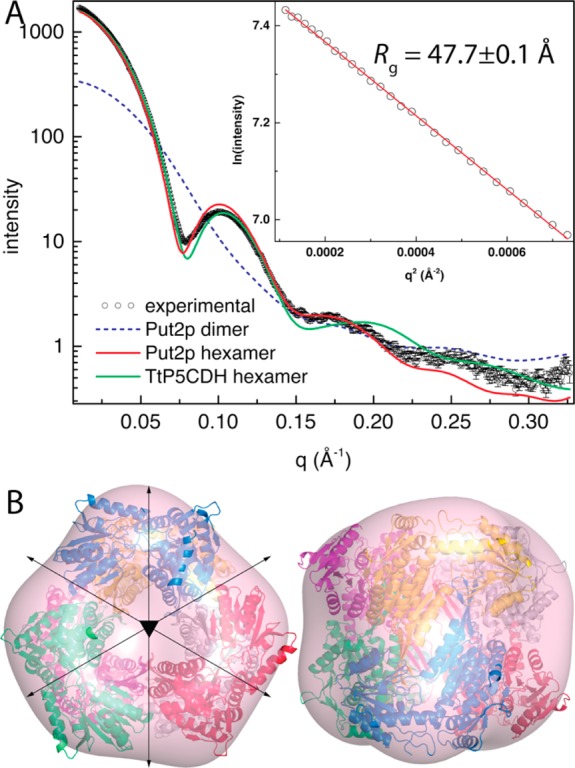
SAXS analyses of Put2p. (A) Experimental and calculated SAXS curves. The inset shows a Guinier plot spanning the qRg range of 0.508–1.29. The linear fit of the Guinier plot has an R2 of 0.9995. (B) Superposition of the SAXS shape reconstruction envelope and the Put2p hexamer generated from crystallographic symmetry. Two orthogonal views are shown.
The Put2p crystal lattice was inspected to identify a higher-order assembly that is consistent with the SAXS data. Application of the crystallographic 3-fold rotation to the dimer in the asymmetric unit generates a point group 32 hexamer with an Rg of 43.9 Å (Figure 5B), which is close to the experimental Rg of 48 Å. The scattering profile calculated from the Put2p hexamer shows good agreement with the experimental profile (Figure 5A). Slightly better agreement is obtained with the hexamer of TtP5CDH (Figure 5A), which includes the sections that are disordered in Put2p. Consideration of a mixture of hexamers and dimers using minimal ensemble search38 did not improve the fit.
The hexamer oligomeric state was confirmed by estimating the molecular mass from SAXS data using the volume of correlation (Vc) invariant.39 The Vc of Put2p is 1459 Å2, which corresponds to a molecular mass of 363 kDa. This value is within 4% of the expected molecular mass of 376 kDa for a hexamer of the Put2p protein used for SAXS. We concluded that the predominant form of Put2p in solution is the trimer-of-dimers hexamer observed in the crystal lattice.
Finally, shape reconstruction calculations are also consistent with the hexamer. The shape reconstruction was performed with the SASTBX server,32 which makes no explicit assumptions about the molecular mass, the number of residues, or the oligomeric state of the particle under consideration. The envelope is consistent with the crystallographic hexamer (Figure 5B).
Hexamerization Hot Spot of Put2p
We previously identified a hexamerization hot spot in bacterial P5CDHs.19 The hot spot is located in the interface between two dimers and is formed by α3 of one molecule and the oligomerization domain of another molecule (Figure 6A). In the bacterial P5CDH hexamers, an Arg residue of α3 (e.g., Arg100 of TtP5CDH) is at the center of the hot spot and forms several electrostatic interactions across the dimer–dimer interface (Figure 6C). Mutation of this Arg to Ala in TtP5CDH or DrP5CDH abrogates hexamerization in favor of dimers, showing that it is essential for hexamer formation.
Figure 6.
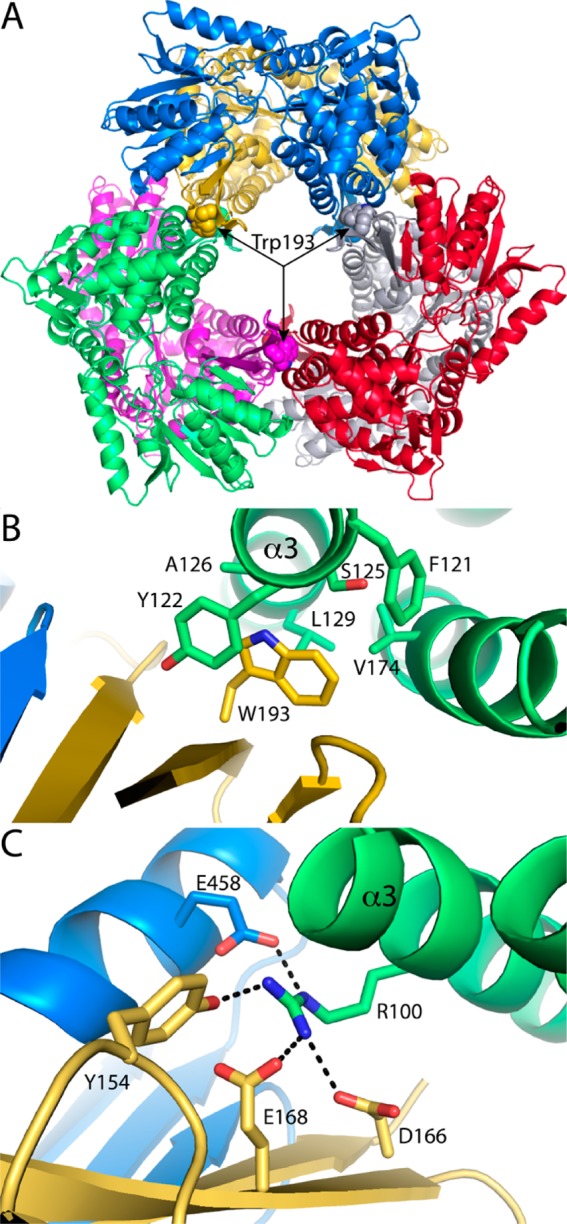
Hexamerization hot spots of Put2p and TtP5CDH. (A) Put2p hexamer viewed down the 3-fold axis, showing the location of the hot spot centered on Trp193 (shown as spheres). The six chains have different colors. (B) Close-up view of the environment around Trp193 of Put2p. The chains are colored as in panel A. (C) Hot spot of TtP5CDH, which is centered on Arg100 of α3. The chains are colored as in panel A.
Interestingly, Ala126 of Put2p replaces Arg100 of TtP5CDH, while Trp193 of Put2p replaces Asp166 of TtP5CDH of the oligomerization domain (Figure 6B). Trp193 occupies the space corresponding to the Arg100 side chain of TtP5CDH. The indole of Trp193 fits into a hole formed by several residues of α3 (Phe121, Tyr122, Ser125, Ala126, and Leu129) as well as Val174 of α5 (Figure 6B). We therefore hypothesized that Trp193 is the center of the hexamerization hot spot of Put2p, analogous to the essential Arg of Tt5CDH and DrP5CDH. This idea was tested by creating Put2p variant W193A.
The oligomeric state of W193A was determined using sedimentation velocity. Figure 7A displays a subset of the velocity profiles, with the corresponding least-squares fits. Analysis of the entire data set with SEDFIT yielded a symmetric sedimentation coefficient distribution centered at 4.65 S (Figure 7B). The corresponding molecular mass distribution is centered at 121 kDa (Figure 7C), which is within 3% of the theoretical M of the W193A dimer (125 kDa). Thus, mutation of Trp193 to Ala appears to have disrupted the hexamer, as intended.
Figure 7.
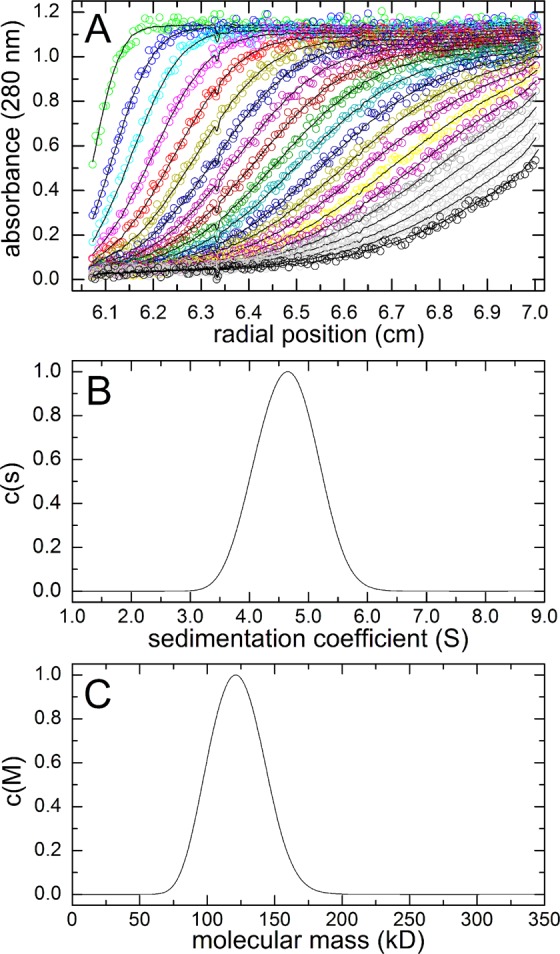
Sedimentation velocity analysis of W193A. (A) Selected velocity profiles (circles) and optimal least-squares fits. (B) Sedimentation coefficient distribution. (C) Molecular mass distribution.
W193A was also analyzed using SAXS (Figure 8). Guinier plots of data from three samples having different protein concentrations yield an Rg in the range of 34.5–34.7 Å. Calculations of the pair distribution function suggest a maximal particle dimension of 110–115 Å and an Rg of 34.7 Å. As stated above, the Rg of the Put2p dimer in the asymmetric unit is 31.5 Å, whereas that of the hexamer is 44 Å. Thus, the Rg of W193A is consistent with a dimer in solution. The theoretical SAXS curve calculated from the Put2p dimer agrees well with the experimental one, while the curve derived from the hexamer curve shows significant deviation (Figure 8A). Furthermore, the envelope from shape reconstruction calculations, performed with the SASTBX server, is consistent with the crystallographic dimer (Figure 8B). Thus, the SAXS data are also consistent with W193A being primarily dimeric in solution.
Figure 8.
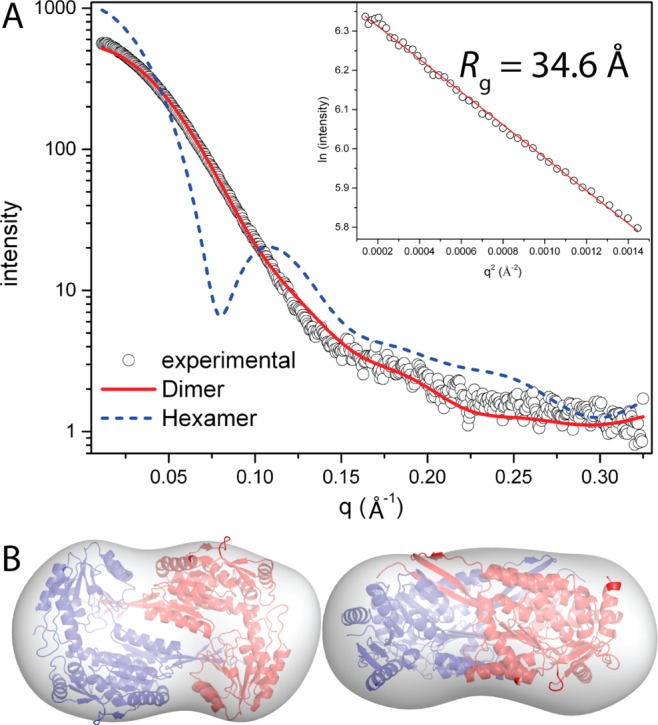
SAXS analysis of W193A. (A) Experimental and calculated SAXS curves. The inset shows a Guinier plot spanning the qRg range of 0.346–1.34. The linear fit of the Guinier plot has an R2 of 0.997. (B) Superposition of the SAXS shape reconstruction envelope and the Put2p dimer from the asymmetric unit. Two orthogonal views are shown.
Discussion
The disordered aldehyde anchor loop is the major result from the Put2p and HsP5CDH crystal structures reported here. It is tempting to speculate that these structures represent the resting enzyme conformation, implying that aldehyde binding stabilizes the active site. This interpretation is supported by the fact that all other structures of eukaryotic P5CDHs (human and mouse) have ligands bound in the aldehyde site, including sulfate ion from the crystallization buffer (PDB entries 3V9J and 3V9H),12 the product glutamate (PDB entry 3V9K),12 and proline (PDB entry 4E3X),40 which is a competitive inhibitor with respect to GSA.1 Although a ligand was not modeled in two other structures (PDB entries 3V9L and 3V9G), electron density consistent with an active site ligand, probably sulfate ion, is nevertheless evident. Thus, none of the previously determined structures of eukaryotic P5CDHs are truly representative of the aldehyde-free conformation. Bacterial P5CDH structures, however, provide a counterargument; a few bacterial P5CDHs have an ordered active site in the absence of a ligand in the aldehyde site (e.g., PDB entries 2EHQ, 2BHP, and 3RJL). Nevertheless, the observation that the aldehyde anchor peptide is disordered in two different P5CDHs that were crystallized in unrelated lattices suggests that the disorder may be functionally relevant, at least for eukaryotic P5CDHs. At the very least, the structures provide evidence that the aldehyde-binding loop is inherently flexible, possibly sampling active and inactive conformations in the absence of the substrate. In this view, Put2p would be an example of substrate recognition by conformational selection.41 These results add a new dimension to our understanding of ALDH substrate specificity.42
Disorder in enzyme active sites on the scale described here has precedent, and retinal dehydrogenase II is the most germane example. Also a member of the ALDH superfamily, retinal dehydrogenase II catalyzes the oxidation of retinal to retinoic acid and is thus involved in retinoic acid signaling. As in Put2p, the aldehyde-binding loop is disordered in the crystal structure of retinal dehydrogenase II (PDB entry 1BI9). It has been proposed that the disordered loop plays a role in discriminating retinal from smaller potential substrates.43,44
The discovery that Put2p is hexameric is unexpected. Put2p and HsP5CDH are eukaryotic P5CDHs that have 42% identical amino acid sequences, yet Put2p is hexameric and HsP5CDH dimeric.12 The trimer-of-dimers hexamer described here for Put2p is also formed by TtP5CDH and DrP5CDH,19 although Put2p is only 30% identical to these bacterial P5CDHs. Curiously, other bacterial P5CDHs, such as those from Bacillus species, are dimeric.19 Thus, global sequence identity and domain of life are poor predictors of the oligomeric states of P5CDHs. Instead, we suggest that the hot spot theory of protein–protein association provides a better explanation.45,46
The Put2p structure revealed Trp193 as a potential hot spot residue. Trp193 is located in the same region as the bacterial hexamerization hot spot, where it forms nonpolar, knob-in-hole interactions across the dimer–dimer interface (Figure 6B). Furthermore, Trp, along with Tyr and Arg, is often found in protein–protein interface hot spots.45 Mutation of Trp193 to Ala abrogates hexamer formation, suggesting that these nonpolar interactions (Figure 6B) substitute for the electrostatic interactions that stabilize the bacterial P5CDH hexamers (Figure 6C). Thus, the ALDH4A1 hexamerization hot spot appears to be a unique region of three-dimensional structural space that must be occupied by residues capable of forming attractive intermolecular forces for hexamerization to occur. Interestingly, the precise nature of these forces appears to be less important that than their location.
Finally, the hot spot theory provides a satisfactory explanation for why some P5CDHs are dimeric. A theoretical hexamer built from HsP5CDH dimers has vacant space in the hot spot region instead of the tight knob-in-hole interaction observed in Put2p. The result reflects the fact that the mammalian enzymes have the short residue Thr in place of Trp193. Also, hexamers built from the Bacillus P5CDH dimers show steric clashes of long side chains across the dimer–dimer interface. Thus, the dimeric enzymes do not have an appropriate constellation of residues for building a functional hexamerization hot spot.
Acknowledgments
We thank Kevin Dyer of the SIBYLS beamline of the Advanced Light Source for collecting the SAXS data, Dr. Marjorie Brandriss of the Rutgers New Jersey Medical School for providing the PUT2 clone, and Dr. Jonathan Schuermann of the Northeastern Collaborative Access Team at the Advanced Photon Source for help with diffraction data collection and processing. Part of this work is based upon research conducted at the Advanced Photon Source on the Northeastern Collaborative Access Team beamlines, which are supported by a grant from the National Institute of General Medical Sciences (P41 GM103403) from the National Institutes of Health. Use of the Advanced Photon Source, an Office of Science User Facility operated for the U.S. Department of Energy (DOE) Office of Science by Argonne National Laboratory, was supported by the DOE under Contract DE-AC02-06CH11357. Part of this work was conducted at the Advanced Light Source (ALS), a national user facility operated by Lawrence Berkeley National Laboratory on behalf of the Department of Energy, Office of Basic Energy Sciences, through the Integrated Diffraction Analysis Technologies (IDAT) program, supported by DOE Office of Biological and Environmental Research. Additional support comes from the National Institutes of Health project MINOS (R01GM105404).
Glossary
Abbreviations
- PRODH
proline dehydrogenase
- P5C
Δ1-pyrroline-5-carboxylate
- GSA
γ-glutamate semialdehyde
- P5CDH
Δ1-pyrroline-5-carboxylate dehydrogenase
- PutA
proline utilization A
- Put2p
S. cerevisiae Δ1-pyrroline-5-carboxylate dehydrogenase
- PUT2
gene encoding S. cerevisiae Δ1-pyrroline-5-carboxylate dehydrogenase
- Put1p
S. cerevisiae proline dehydrogenase
- HsP5CDH
human Δ1-pyrroline-5-carboxylate dehydrogenase
- MmP5CDH
mouse Δ1-pyrroline-5-carboxylate dehydrogenase
- TtP5CDH
T. thermophilus Δ1-pyrroline-5-carboxylate dehydrogenase
- DrP5CDH
D. radiodurans Δ1-pyrroline-5-carboxylate dehydrogenase
- SAXS
small-angle X-ray scattering
- THP
tris(hydroxypropyl)phosphine.
Accession Codes
Atomic coordinates and structure factors have been deposited in the Protein Data Bank as entries 4OE6 (Put2p), 4OE4 (Put2p–NAD+ complex), and 4OE5 (HsP5CDH).
Research reported in this publication was supported by the National Institute of General Medical Sciences of the National Institutes of Health via Grant GM065546.
The authors declare no competing financial interest.
Funding Statement
National Institutes of Health, United States
References
- Wanduragala S.; Sanyal N.; Liang X.; Becker D. F. (2010) Purification and characterization of Put1p from Saccharomyces cerevisiae. Arch. Biochem. Biophys. 498, 136–142. [DOI] [PMC free article] [PubMed] [Google Scholar]
- Vasiliou V.; Nebert D. W. (2005) Analysis and update of the human aldehyde dehydrogenase (ALDH) gene family. Hum. Genomics 2, 138–143. [DOI] [PMC free article] [PubMed] [Google Scholar]
- Liang X.; Zhang L.; Natarajan S. K.; Becker D. F. (2013) Proline Mechanisms of Stress Survival. Antioxid. Redox Signaling 19, 998–1011. [DOI] [PMC free article] [PubMed] [Google Scholar]
- Morita Y.; Nakamori S.; Takagi H. (2002) Effect of proline and arginine metabolism on freezing stress of Saccharomyces cerevisiae. J. Biosci. Bioeng. 94, 390–394. [DOI] [PubMed] [Google Scholar]
- Nishimura A.; Nasuno R.; Takagi H. (2012) The proline metabolism intermediate Δ1-pyrroline-5-carboxylate directly inhibits the mitochondrial respiration in budding yeast. FEBS Lett. 586, 2411–2416. [DOI] [PubMed] [Google Scholar]
- Nomura M.; Takagi H. (2004) Role of the yeast acetyltransferase Mpr1 in oxidative stress: Regulation of oxygen reactive species caused by a toxic proline catabolism intermediate. Proc. Natl. Acad. Sci. U.S.A. 101, 12616–12621. [DOI] [PMC free article] [PubMed] [Google Scholar]
- Magasanik B.; Kaiser C. A. (2002) Nitrogen regulation in Saccharomyces cerevisiae. Gene 290, 1–18. [DOI] [PubMed] [Google Scholar]
- Nasuno R.; Hirano Y.; Itoh T.; Hakoshima T.; Hibi T.; Takagi H. (2013) Structural and functional analysis of the yeast N-acetyltransferase Mpr1 involved in oxidative stress tolerance via proline metabolism. Proc. Natl. Acad. Sci. U.S.A. 110, 11821–11826. [DOI] [PMC free article] [PubMed] [Google Scholar]
- Forte-McRobbie C.; Pietruszko R. (1989) Human glutamic-γ-semialdehyde dehydrogenase. Kinetic mechanism. Biochem. J. 261, 935–943. [DOI] [PMC free article] [PubMed] [Google Scholar]
- Forte-McRobbie C. M.; Pietruszko R. (1986) Purification and characterization of human liver “high Km” aldehyde dehydrogenase and its identification as glutamic γ-semialdehyde dehydrogenase. J. Biol. Chem. 261, 2154–2163. [PubMed] [Google Scholar]
- Small W. C.; Jones M. E. (1990) Pyrroline 5-carboxylate dehydrogenase of the mitochondrial matrix of rat liver. Purification, physical and kinetic characteristics. J. Biol. Chem. 265, 18668–18672. [PubMed] [Google Scholar]
- Srivastava D.; Singh R. K.; Moxley M. A.; Henzl M. T.; Becker D. F.; Tanner J. J. (2012) The Three-Dimensional Structural Basis of Type II Hyperprolinemia. J. Mol. Biol. 420, 176–189. [DOI] [PMC free article] [PubMed] [Google Scholar]
- Valle D.; Goodman S. I.; Applegarth D. A.; Shih V. E.; Phang J. M. (1976) Type II hyperprolinemia. Δ1-Pyrroline-5-carboxylic acid dehydrogenase deficiency in cultured skin fibroblasts and circulating lymphocytes. J. Clin. Invest. 58, 598–603. [DOI] [PMC free article] [PubMed] [Google Scholar]
- Geraghty M. T.; Vaughn D.; Nicholson A. J.; Lin W. W.; Jimenez-Sanchez G.; Obie C.; Flynn M. P.; Valle D.; Hu C. A. (1998) Mutations in the Δ1-pyrroline 5-carboxylate dehydrogenase gene cause type II hyperprolinemia. Hum. Mol. Genet. 7, 1411–1415. [DOI] [PubMed] [Google Scholar]
- Phang J. M., Hu C. A., and Valle D. (2001) Disorders of proline and hydroxyproline metabolism. In Metabolic and molecular basis of inherited disease (Scriver C. R., Beaudet A. L., Sly W. S., and Valle D., Eds.) pp 1821–1838, McGraw-Hill, New York. [Google Scholar]
- Inagaki E.; Ohshima N.; Takahashi H.; Kuroishi C.; Yokoyama S.; Tahirov T. H. (2006) Crystal structure of Thermus thermophilus Δ1-pyrroline-5-carboxylate dehydrogenase. J. Mol. Biol. 362, 490–501. [DOI] [PubMed] [Google Scholar]
- Inagaki E.; Ohshima N.; Sakamoto K.; Babayeva N. D.; Kato H.; Yokoyama S.; Tahirov T. H. (2007) New insights into the binding mode of coenzymes: Structure of Thermus thermophilus Δ1-pyrroline-5-carboxylate dehydrogenase complexed with NADP+. Acta Crystallogr. F63, 462–465. [DOI] [PMC free article] [PubMed] [Google Scholar]
- Pemberton T. A.; Tanner J. J. (2013) Structural basis of substrate selectivity of Δ1-pyrroline-5-carboxylate dehydrogenase (ALDH4A1): Semialdehyde chain length. Arch. Biochem. Biophys. 538, 34–40. [DOI] [PMC free article] [PubMed] [Google Scholar]
- Luo M.; Singh R. K.; Tanner J. J. (2013) Structural determinants of oligomerization of Δ1-pyrroline-5-carboxylate dehydrogenase: Identification of a hexamerization hot spot. J. Mol. Biol. 425, 3106–3120. [DOI] [PMC free article] [PubMed] [Google Scholar]
- Martin O.; Brandriss M. C.; Schneider G.; Bakalinsky A. T. (2003) Improved anaerobic use of arginine by Saccharomyces cerevisiae. Appl. Environ. Microbiol. 69, 1623–1628. [DOI] [PMC free article] [PubMed] [Google Scholar]
- Matthews B. W. (1968) Solvent content of protein crystals. J. Mol. Biol. 33, 491–497. [DOI] [PubMed] [Google Scholar]
- Otwinowski Z.; Minor W. (1997) Processing of X-ray diffraction data collected in oscillation mode. Methods Enzymol. 276, 307–326. [DOI] [PubMed] [Google Scholar]
- Kabsch W. (2010) XDS. Acta Crystallogr. D66, 125–132. [DOI] [PMC free article] [PubMed] [Google Scholar]
- Vagin A.; Teplyakov A. (1997) MOLREP: An automated program for molecular replacement. J. Appl. Crystallogr. 30, 1022–1025. [Google Scholar]
- Emsley P.; Cowtan K. (2004) Coot: Model-building tools for molecular graphics. Acta Crystallogr. D60, 2126–2132. [DOI] [PubMed] [Google Scholar]
- Adams P. D.; Afonine P. V.; Bunkoczi G.; Chen V. B.; Davis I. W.; Echols N.; Headd J. J.; Hung L. W.; Kapral G. J.; Grosse-Kunstleve R. W.; McCoy A. J.; Moriarty N. W.; Oeffner R.; Read R. J.; Richardson D. C.; Richardson J. S.; Terwilliger T. C.; Zwart P. H. (2010) PHENIX: A comprehensive Python-based system for macromolecular structure solution. Acta Crystallogr. D66, 213–221. [DOI] [PMC free article] [PubMed] [Google Scholar]
- Hura G. L.; Menon A. L.; Hammel M.; Rambo R. P.; Poole F. L. II; Tsutakawa S. E.; Jenney F. E. Jr.; Classen S.; Frankel K. A.; Hopkins R. C.; Yang S. J.; Scott J. W.; Dillard B. D.; Adams M. W.; Tainer J. A. (2009) Robust, high-throughput solution structural analyses by small angle X-ray scattering (SAXS). Nat. Methods 6, 606–612. [DOI] [PMC free article] [PubMed] [Google Scholar]
- Classen S.; Hura G. L.; Holton J. M.; Rambo R. P.; Rodic I.; McGuire P. J.; Dyer K.; Hammel M.; Meigs G.; Frankel K. A.; Tainer J. A. (2013) Implementation and performance of SIBYLS: A dual endstation small-angle X-ray scattering and macromolecular crystallography beamline at the Advanced Light Source. J. Appl. Crystallogr. 46, 1–13. [DOI] [PMC free article] [PubMed] [Google Scholar]
- Konarev P. V.; Volkov V. V.; Sokolova A. V.; Koch M. H. J.; Svergun D. I. (2003) PRIMUS: A Windows PC-based system for small-angle scattering data analysis. J. Appl. Crystallogr. 36, 1277–1282. [Google Scholar]
- Schneidman-Duhovny D.; Hammel M.; Sali A. (2010) FoXS: A web server for rapid computation and fitting of SAXS profiles. Nucleic Acids Res. 38, W540–W544. [DOI] [PMC free article] [PubMed] [Google Scholar]
- Svergun D. (1992) Determination of the regularization parameter in indirect-transform methods using perceptual criteria. J. Appl. Crystallogr. 25, 495–503. [Google Scholar]
- Liu H.; Hexemer A.; Zwart P. H. (2012) The Small Angle Scattering ToolBox (SASTBX): An open-source software for biomolecular small-angle scattering. J. Appl. Crystallogr. 45, 587–593. [Google Scholar]
- Schuck P. (2000) Size-distribution analysis of macromolecules by sedimentation velocity ultracentrifugation and Lamm equation modeling. Biophys. J. 78, 1606–1619. [DOI] [PMC free article] [PubMed] [Google Scholar]
- Brandriss M. C.; Krzywicki K. A. (1986) Amino-terminal fragments of Δ1-pyrroline-5-carboxylate dehydrogenase direct β-galactosidase to the mitochondrial matrix in Saccharomyces cerevisiae. Mol. Cell. Biol. 6, 3502–3512. [DOI] [PMC free article] [PubMed] [Google Scholar]
- Brandriss M. C.; Magasanik B. (1979) Genetics and physiology of proline utilization in Saccharomyces cerevisiae: Enzyme induction by proline. J. Bacteriol. 140, 498–503. [DOI] [PMC free article] [PubMed] [Google Scholar]
- Brandriss M. C. (1983) Proline utilization in Saccharomyces cerevisiae: Analysis of the cloned PUT2 gene. Mol. Cell. Biol. 3, 1846–1856. [DOI] [PMC free article] [PubMed] [Google Scholar]
- Perez-Miller S. J.; Hurley T. D. (2003) Coenzyme isomerization is integral to catalysis in aldehyde dehydrogenase. Biochemistry 42, 7100–7109. [DOI] [PubMed] [Google Scholar]
- Pelikan M.; Hura G. L.; Hammel M. (2009) Structure and flexibility within proteins as identified through small angle X-ray scattering. Gen. Physiol. Biophys. 28, 174–189. [DOI] [PMC free article] [PubMed] [Google Scholar]
- Rambo R. P.; Tainer J. A. (2013) Accurate assessment of mass, models and resolution by small-angle scattering. Nature 496, 477–481. [DOI] [PMC free article] [PubMed] [Google Scholar]
- Pemberton T. A.; Still B. R.; Christensen E. M.; Singh H.; Srivastava D.; Tanner J. J. (2012) Proline: Mother Nature’s cryoprotectant applied to protein crystallography. Acta Crystallogr. D68, 1010–1018. [DOI] [PMC free article] [PubMed] [Google Scholar]
- Vogt A. D.; Di Cera E. (2013) Conformational selection is a dominant mechanism of ligand binding. Biochemistry 52, 5723–5729. [DOI] [PMC free article] [PubMed] [Google Scholar]
- Riveros-Rosas H.; Gonzalez-Segura L.; Julian-Sanchez A.; Diaz-Sanchez A. G.; Munoz-Clares R. A. (2013) Structural determinants of substrate specificity in aldehyde dehydrogenases. Chem.-Biol. Interact. 202, 51–61. [DOI] [PubMed] [Google Scholar]
- Lamb A. L.; Newcomer M. E. (1999) The structure of retinal dehydrogenase type II at 2.7 Å resolution: Implications for retinal specificity. Biochemistry 38, 6003–6011. [DOI] [PubMed] [Google Scholar]
- Bordelon T.; Montegudo S. K.; Pakhomova S.; Oldham M. L.; Newcomer M. E. (2004) A disorder to order transition accompanies catalysis in retinaldehyde dehydrogenase type II. J. Biol. Chem. 279, 43085–43091. [DOI] [PubMed] [Google Scholar]
- Bogan A. A.; Thorn K. S. (1998) Anatomy of hot spots in protein interfaces. J. Mol. Biol. 280, 1–9. [DOI] [PubMed] [Google Scholar]
- Moreira I. S.; Fernandes P. A.; Ramos M. J. (2007) Hot spots: A review of the protein-protein interface determinant amino-acid residues. Proteins 68, 803–812. [DOI] [PubMed] [Google Scholar]
- Lovell S. C.; Davis I. W.; Arendall W. B. III; de Bakker P. I.; Word J. M.; Prisant M. G.; Richardson J. S.; Richardson D. C. (2003) Structure validation by Cα geometry: ϕ, ψ and Cβ deviation. Proteins 50, 437–450. [DOI] [PubMed] [Google Scholar]


