Abstract
The purpose of this study was to evaluate a novel instrumented mouthguard as a research device for measuring head impact kinematics. To evaluate kinematic accuracy, laboratory impact testing was performed at sites on the helmet and facemask for determining how closely instrumented mouthguard data matched data from an anthropomorphic test device. Laboratory testing results showed that peak linear acceleration (r2 = 0.96), peak angular acceleration (r2 = 0.89), and peak angular velocity (r2 = 0.98) measurements were highly correlated between the instrumented mouthguard and anthropomorphic test device. Normalized root-mean-square errors for impact time traces were 9.9 ± 4.4% for linear acceleration, 9.7 ± 7.0% for angular acceleration, and 10.4 ± 9.9% for angular velocity. This study demonstrates the potential of an instrumented mouthguard as a research tool for measuring in vivo impacts, which could help uncover the link between head impact kinematics and brain injury in American football.
Keywords: Concussion, mTBI, Brain, Angular velocity, Linear acceleration, Translational acceleration, Angular acceleration, Rotational velocity, Gyroscope
INTRODUCTION
Traumatic brain injury (TBI) has been identified as a major health concern by the U.S. Center for Disease Control and Prevention and 75% of reported incidents are categorized as concussion or mild.6 TBI affects a broad swath of the population, from infants to the elderly in falls, and all ages in between due to accidents, violence, and sports. Injury to one’s brain is particularly debilitating as it can affect our most basic functions such as learning, communicating, and memory. Concussion is a mild form of TBI (mTBI) that has risen at an alarming rate in sports and now accounts for an estimated 1.6–3.8 million cases of TBI in the U.S. each year.5,17,32 Among American sports, football is responsible for the most concussions. There are 5 million football players at all levels in the U.S.,8 and injury rates in collegiate football are approximately 5–10 concussions per season per team from our experience and others.11 Recent evidence has shown that concussions and sub-concussive repetitive trauma can have lasting effects on brain function and may ultimately cause neurodegeneration.4,10
To prevent acute concussion and long-term neurodegeneration, we need to understand the underlying injury mechanism. Quantitative measurement of head trauma in longitudinal human studies is necessary to uncover the mechanism of injury. Football offers a natural laboratory to instrument and study human head trauma since head impacts and head injuries are common. The HIT system is an in-helmet acceleration-sensing system that has been used by multiple investigators to carry out such studies.4,12,27 Recently, Breedlove et al.4 used the HIT system to show that, after two seasons of high-school football, the number of accumulated head-blows correlates with neurophysiological changes. Rowson et al.27 used the HIT system to develop injury risk curves based on both linear acceleration and estimated angular accelerations. The injury risk function offers some support for the long held rotational injury hypothesis from early primate studies. 15,19,23 However, the angular acceleration reported from the HIT system is an indirect estimate calculated using linear acceleration measurements. To gain a more detailed understanding of rotational injury mechanism, a full 6-degree-of-freedom (DOF) version of the HIT system was recently developed and tested but has yet to report a concussion.26 More 6-DOF data is necessary to validate the rotational injury hypothesis in humans.
The objective of this study was to evaluate the instrumented mouthguard in measuring 6-DOF head kinematic response during impact. Previous in vivo18 and ex vivo14 studies have employed a 3-DOF accelerometer mouthguard. Higgins et al.14 carried out a laboratory investigation of a 3-DOF accelerometer based mouthguard with impact tests. Since the device in the present investigation had the added capability of measuring rotation using 3 gyroscopes, we introduced a flexible neck in our experiments. The neck allows for significant rotation, therefore, we additionally employed kinematic transformations between mouth and head center of gravity to account for rotational influence on translational measures. Specifically, our laboratory impact tests compared mouthguard estimates of 6-DOF head center of gravity kinematics to that of an anthropomorphic test device. Using a controlled, laboratory setting, we sought to systematically answer the research question: how accurate is the mouthguard in measuring 6-DOF impact kinematics? Our results suggest that an instrumented mouthguard can be a valuable device for building a 6-DOF data set of human mTBI to understand the mechanism of injury.
MATERIALS AND METHODS
Instrumented Mouthguard
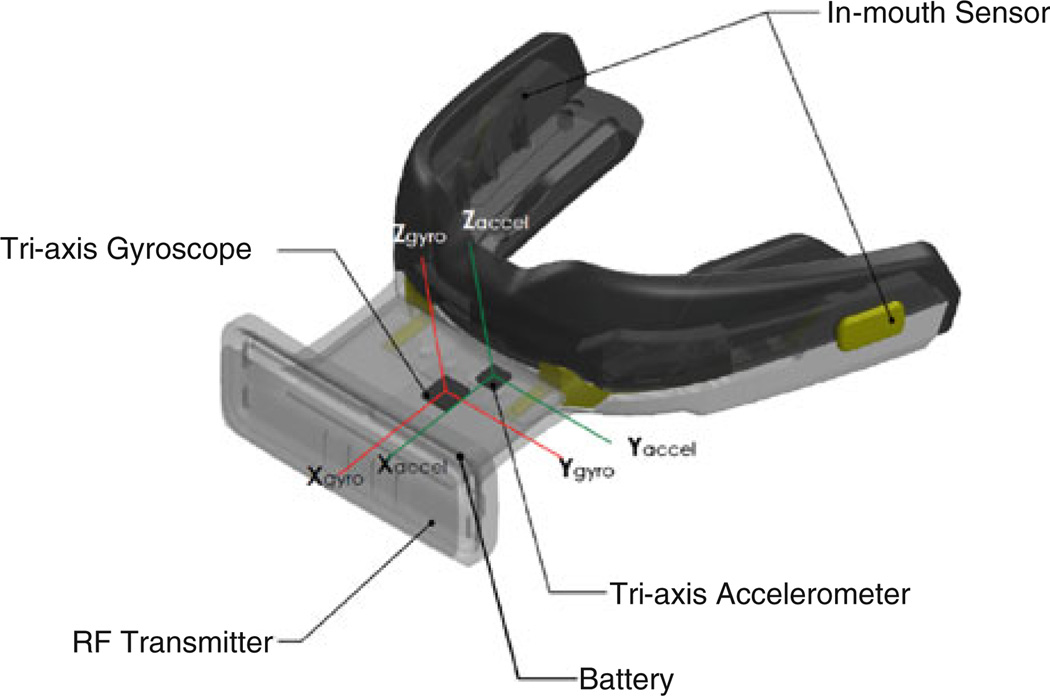
An instrumented mouthguard (DVT3, X2Impact, Inc., Seattle, WA, USA) was developed for measuring linear and angular head kinematics during impact (Fig. 1). Mouthguard sensing is accomplished via a triaxial accelerometer (ADXL377, Analog Devices, Inc., Norwood, MA, USA) with 200g maximum per axis and a tri-axial angular rate gyroscope (L3G4200D, ST Microelectronics, Geneva, Switzerland) with 40 rad/s maximum per axis. Accelerometer and gyroscope data are low-pass filtered at 200 and 110 Hz cutoff respectively. Sensor data is polled by a processor at 1024 Hz and stored in an on-board circular buffer in preparation for an event. The mouthguard is fit through the standard boil-and-bite process.
FIGURE 1.
Instrumented mouthguard. The 6-DOF device has 3 gyroscopes to sense rotation, and 3 accelerometers to sense linear acceleration. Data is transmitted by radio to sideline. In-mouth sensor allows for de-activation when not placed in the mouth.
When a 15g peak linear acceleration magnitude threshold in the instrumented mouthguard coordinates is reached (threshold value chosen near previously- reported threshold trigger value of 14.4g27), 25 pre-trigger and 75 post-trigger samples (1024 Hz sampling rate) of all sensor data are transmitted wirelessly via the mouthguard RF transmitter (Fig. 1) to the base station where data are permanently stored. An in-mouth impedance-based saliva sensor (Fig. 1) is designed in for field use to determine when the mouthguard is present in the mouth to reduce the likelihood of false-positive events.
For physiological relevance, linear acceleration data are transformed from the mouthguard to the center of gravity of a 50th percentile male human head29,31 via the following equation:
| (1) |
where aCG is the linear acceleration vector of the center of gravity of a 50th percentile male human head, aMG is the linear acceleration of the instrumented mouthguard, ω̇MG is the angular acceleration of the mouthguard, r is the vector from the accelerometer on the mouthguard to the center of gravity of a 50th percentile male human head, and ωMG is the angular velocity of the mouthguard. aMG is measured directly from the instrumented mouthguard accelerometer, and ωMG is measured directly from the instrumented mouthguard gyroscope. r is a constant vector which originates from the accelerometer on the instrumented mouthguard and projects posteriorly 105 mm, to the left 4 mm, and superiorly 54 mm. ω̇MG is computed by taking the derivative of ωMG using the five point stencil method.1
Anthropomorphic Test Device (ATD)
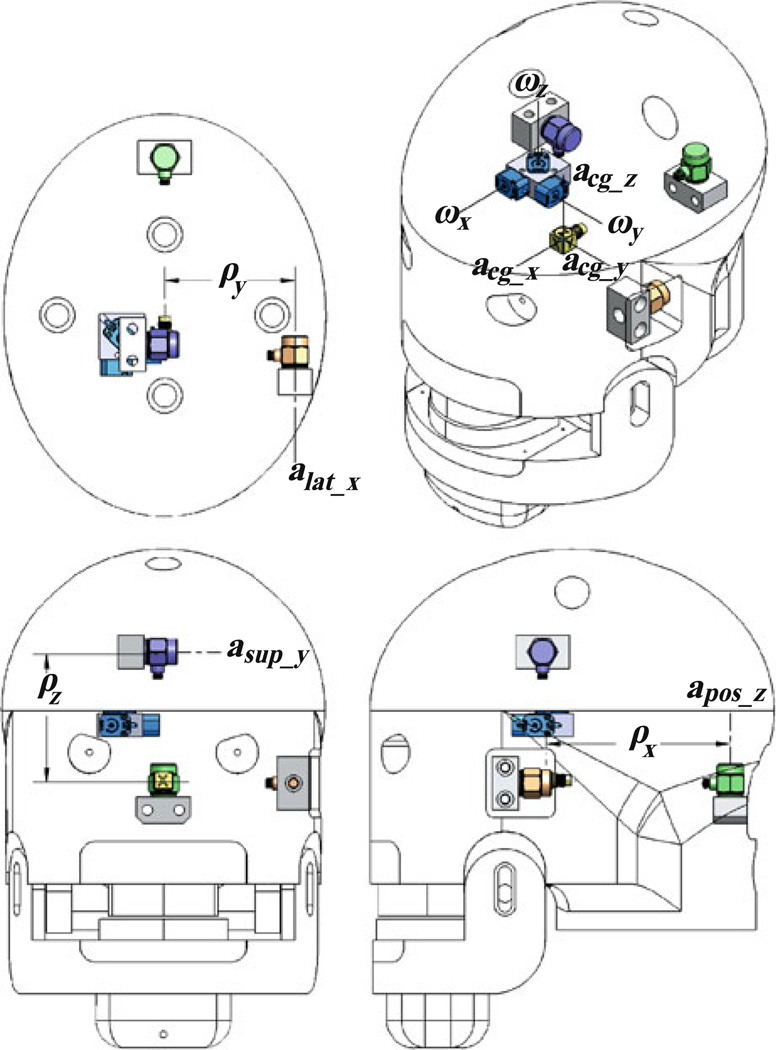
A custom-built anthropomorphic test device (ATD) (Fig. 2) was used to assess the instrumented mouthguard’s ability to measure head center of gravity kinematics during laboratory impact testing. The size, mass and center of gravity location of the ATD were set to approximate a 50th percentile male human head.29,31 The ATD breath, length, and circumference were 152, 191, and 540 mm, respectively, and the mass was 4.0 kg. The center of mass was defined from the nasal root (top of the nose) 79 mm posterior and 14 mm inferior. The moments of inertia were 0.017 kg m2 about the anterior-posterior axis, 0.020 kg m2 about the medial–lateral axis, and 0.014 kg m2 about the inferior-superior axis. The ATD contained a jaw which could open and clamp down into which mouthguards could be firmly attached. The ATD was instrumented with a tri-axial 500g accelerometer (3273A1, Dytran Instruments, Inc., Chatsworth, CA, USA) at the ATD center of gravity (acg_x, acg_y, acg_z) and three single-axis 315 rad/s angular rate gyroscopes (ARS-PRO-18K, 2 kHz, Diversified Technical Systems, Seal Beach, CA, USA) (ωx, ωy, ωz) which were aligned with the axes of the triaxial accelerometer. Three additional single-axis 500g accelerometers (3255A1, Dytran Instruments, Inc., Chatsworth, CA, USA) were offset from each of the orthogonal axes of the center of gravity (Fig. 2). The distance from the axis of the lateral accelerometer, alat_x, to the center of gravity was ρy = 60.7 mm. The distance from the axis of the superior accelerometer, asup_y, to the center of gravity was ρz = 61.7 mm. And, the distance from the axis of the posterior accelerometer, apos_z, to the center of gravity was ρx, = 90.7 mm. Sensor locations and orientations were determined through digitization using a Faro arm device (Faro Technologies, Lake Mary, FL, USA).
FIGURE 2.
Anthropomorphic test device (ATD) with size, weight and center of gravity location set to match a 50th percentile male human head29,31 for assessing instrumented mouthguard performance in laboratory testing. The ATD was instrumented with a triaxial accelerometer at the center of gravity (acg_x, acg_y, acg_z), three single-axis accelerometers (alat_x, asup_y, apos_z) offset orthogonally from the center of gravity (ρx, ρy, ρz), and three single-axis angular rate gyroscopes (ωx, ωy, ωz) which were aligned with the axes of the triaxial accelerometer. Sensor configuration was set to match the previously validated 6a ω configuration.16
During each impact, 1 s of raw data was sampled at 10 kHz and stored using custom Labview (National Instruments, Austin, TX, USA) software. During post-processing, all sensor data were low-pass filtered at CFC 180 (300 Hz cutoff) according to SAE J211 specification.28 Linear acceleration and angular velocity were measured directly from the sensors. Angular acceleration was computed algebraically without differentiation via the following equations16:
| (2) |
| (3) |
| (4) |
This sensor configuration has been shown to compute linear and angular accelerations as accurately as the nine accelerometer package (NAP) configuration24 and measures angular velocity directly through the gyroscope instead of integrating accelerations as is required in the NAP configuration.16
Laboratory Testing
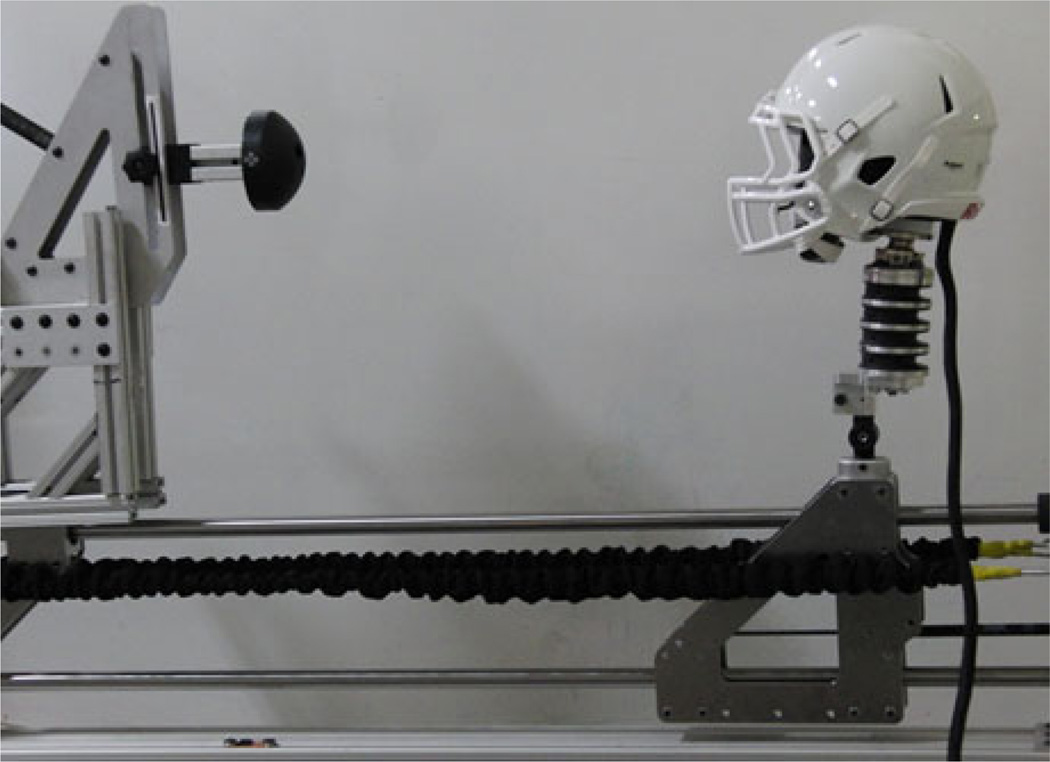
To model the kinematics of football head-impacts, laboratory impact testing was conducted with a spring-loaded horizontal linear impactor striking a helmeted ATD with a biofidelic neck (Fig. 3). The impactor carriage mass is 12.1 kg and contains a 127 mm (5 in.) diameter, 72 mm (2.8 in.) radius-of-curvature impacting surface composed of ultra-high molecular weight polyethylene. The ATD carriage contains a HIII neck whose cable is tensioned to 1.4 Nm (12 in. lb) per the manufacturer’s specification. The impactor was loaded by attaching springs between the impactor carriage and the ATD carriage. Initial impact velocity was adjusted by using different numbers of springs and springs of various stiffnesses. Linear bearings in both carriages allowed sliding movements along the same axis in the horizontal plane. A damper was placed between the ATD carriage and the linear impactor frame to slowly dissipate energy after impact. In preliminary testing, it was determined that the ATD carriage did not move appreciably until after peak impact kinematics, and thus the damper connecting the ATD carriage to the frame did not substantially affect the ATD kinematic response. This has been similarly reported in other linear impactor testing.3 An instrumented mouthguard was inserted into the ATD mouth and the jaw was clamped shut. In-mouth saliva sensing was disabled on the mouthguard for laboratory testing. A new Riddell Revolution Speed Classic helmet (Riddell, Elyria, OH, USA) with a standard 4-point chinstrap and 1 in jaw pads was used for all impact testing. The helmet was fit on the ATD in accordance with the manufacturer’s specifications. After each impact the helmet fit was visually inspected and read-justed as necessary to ensure consistency. High-speed video (1200 frames/s) was used to determine impactor velocity at impact.
FIGURE 3.
Linear impactor for laboratory impact testing. The impactor is loaded by attaching springs between the impactor carriage (on left) and the ATD carriage (on right). Initial impact velocity is adjusted by selecting different numbers of springs and springs of various stiffnesses.
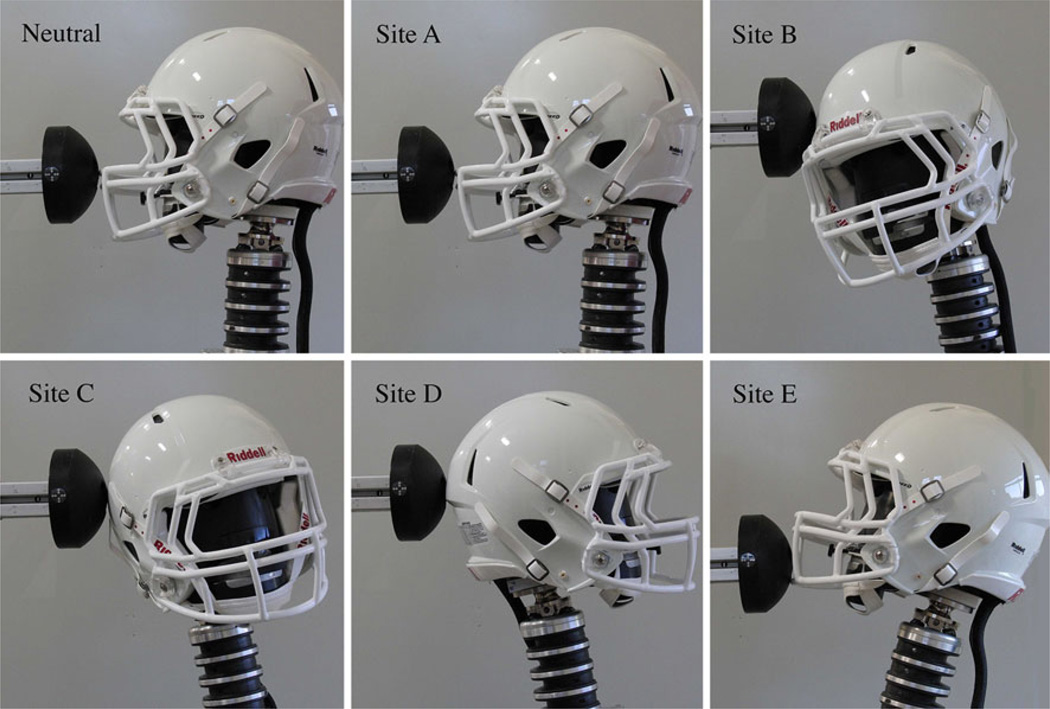
Helmet impact sites were based on National Football League (NFL) video analysis which identified impact sites susceptible to concussion25; these were named Sites A–D. Site E was also examined, because it has previously been identified as a site of increased chinstrap loading.7 Site E was the same as the front face guard, or FFG, impact site defined by the National Operating Committee on Standards for Athletic Equipment (NOCSAE).20 The five impact locations and the neutral position are depicted in Fig. 4 and defined in Table 1. All sites are defined by starting from the neutral position and then rotating about the ATD center of gravity axes, coincident with the tri-axial accelerometer axes (Fig. 2). The ATD is first rotated about its medio-lateral axis, with positive rotations causing the ATD to tilt downward. The ATD is then rotated about its anterior–posterior axis, with positive rotations causing the ATD to point to the left from the neutral position.
FIGURE 4.
Neutral position and impact sites for laboratory linear impactor testing. Exact orientations are defined in Table 1.
TABLE 1.
Impact site definitions.
| Impact site | 1st Rotation about headform medio-lateral axis |
2nd Rotation about headform anterior–posterior axis |
|---|---|---|
| A | 0° | 0° |
| B | 10° | 60° |
| C | 10° | 120° |
| D | 0° | 180° |
| E | −10° | 0° |
Sites were defined by sequential rotations starting from the anthropomorphic test device (ATD) neutral position first about the ATD medio-lateral axis (positive rotation caused the ATD to tilt downward) and second about the ATD anterior–posterior axis (positive rotation caused the ATD to point to the left). ATD sites are visually depicted in Fig. 4.
Eight impact velocities were chosen for testing. Four impact velocities were selected to match the drop height equivalent per standardized drop testing21: 3.0, 4.2, 4.9, and 5.5 m/s. Four additional impact velocities, 2.1, 3.7, 7.0, and 8.5 m/s were chosen to give a more complete picture of the relationship between mouthguard and ATD kinematic measurements. Four impacts were completed for each site and drop height (Table 2). Facemask impact velocities above 4.2 m/s for SitesAand E caused the chinstrap to slip, detach, or tear resulting in potential chin to facemask contact, a known issue for facemask impacts.7 Impact velocities were restricted to 4.2 m/s or less for Sites A and E. This chinstrap phenomenon was not observed for Sites B, C, and D.
TABLE 2.
Number of impacts at each site and impact velocity.
| Impact site |
||||||
|---|---|---|---|---|---|---|
| Impact velocity (m/s) | A | B | C | D | E | Total |
| 2.1 | 4 | 4 | 4 | 4 | 4 | 20 |
| 3.0 | 4 | 4 | 4 | 4 | 4 | 20 |
| 3.7 | 4 | 4 | 4 | 4 | 4 | 20 |
| 4.2 | 4 | 4 | 4 | 4 | 4 | 20 |
| 4.9 | 0 | 4 | 4 | 4 | 0 | 12 |
| 5.5 | 0 | 4 | 4 | 4 | 0 | 12 |
| 7.0 | 0 | 4 | 4 | 4 | 0 | 12 |
| 8.5 | 0 | 4 | 4 | 4 | 0 | 12 |
| Total | 16 | 32 | 32 | 32 | 16 | 128 |
Data Analysis
Linear acceleration, angular acceleration, and angular velocity data were collected for comparative analysis between the instrumented mouthguard and the ATD. Linear regression analysis was performed on peak linear acceleration magnitude, peak angular acceleration magnitude, and peak angular velocity magnitude at each individual impact site, at compiled facemask Sites A and E, compiled non-facemask Sites B, C, and D, and at all compiled Sites A–E. The following regression equation was used, MGmax = m × ATDmax + MG0, where MG is the instrumented mouthguard measurement, ATD is the anthropomorphic test device measurement, and m is the linear regression slope. MG0 was set to zero because both systems start from zero before contact. The coefficient of determination (r2) was computed as a measure of goodness of fit for each regression.
Additionally, the ATD and instrumented mouthguard time traces were compared during each impact. The ATD filtered data were down sampled to 1024 Hz to match the mouthguard sampling rate and the peaks of the two traces were aligned to compute error values. The root mean square (RMS) error and normalized root mean square (NRMS) error were computed over 25 data points (24.4 ms)26 centered on the peaks based on the following equations:
| (5) |
| (6) |
where MGi and ATDi are the ith data points of the instrumented mouthguard and ATD, respectively. n is the number of data points analyzed over the time trace. ATDmax and ATDmin are the maximum and minimum values recorded from the ATD over the time trace.
RESULTS
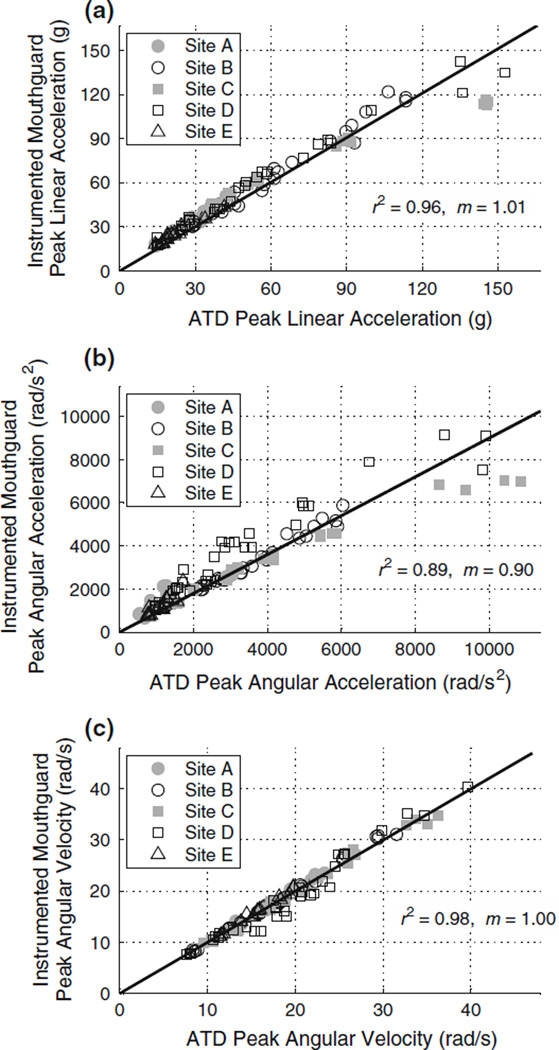
Peak linear acceleration measurements from the instrumented mouthguard and the ATD were correlated across all 128 impacts, r2 = 0.96 (Fig. 5a). Peak linear acceleration for individual impact sites, and sites grouped by facemask impact and non-facemask impact were similarly correlated (Table 3). The linear regression slope, m, was 1.01 indicating a close prediction of the instrumented mouthguard compared to the ATD.
FIGURE 5.
Peak linear acceleration (a), peak angular acceleration (b), and peak angular velocity (c) for all impacts during laboratory testing. Measurements between the instrumented mouthguard and the ATD were correlated for each data set. r2, coefficient of determination, m, linear regression slope, ATD, Anthropomorphic test device.
TABLE 3.
Tabular results for mouthguard errors in predicting ATD kinematics. Linear regression slope (m) and coefficient of determination (r2) for peak linear acceleration, peak angular acceleration, and peak angular velocity across all impact sites during laboratory impact testing.
| Linear acceleration |
Angular acceleration |
Angular velocity |
||||
|---|---|---|---|---|---|---|
| Impact site | m | r2 | m | r2 | m | r2 |
| A | 1.21 | 0.96 | 1.44 | 0.71 | 1.02 | 0.99 |
| B | 1.06 | 0.98 | 0.90 | 0.98 | 1.01 | 0.99 |
| C | 0.92 | 0.97 | 0.77 | 0.98 | 0.99 | 0.99 |
| D | 1.04 | 0.97 | 1.05 | 0.92 | 0.98 | 0.96 |
| E | 1.13 | 0.95 | 1.12 | 0.80 | 1.02 | 0.99 |
| Facemask: A, E | 1.17 | 0.94 | 1.27 | 0.61 | 1.02 | 0.99 |
| Non-facemask: B, C, D | 1.00 | 0.95 | 0.89 | 0.87 | 0.99 | 0.98 |
| All: A, B, C, D, E | 1.01 | 0.96 | 0.90 | 0.89 | 1.00 | 0.98 |
Peak angular accelerations were also correlated between the instrumented mouthguard and ATD across all impacts, r2 = 0.89 (Fig. 5b). Individual impact sites showed correlation values between r2 = 0.71–0.98 (Table 3). The linear regression slope was 0.90 indicating an under prediction by the instrumented mouthguard.
Peak angular velocity was correlated between the instrumented mouthguard and the ATD across all impacts, r2 = 0.98 (Fig. 5c). All impact sites and site groups were highly correlated (Table 3). The linear regression slope was 1.00 indicating a close prediction of the instrumented mouthguard compared to the ATD.
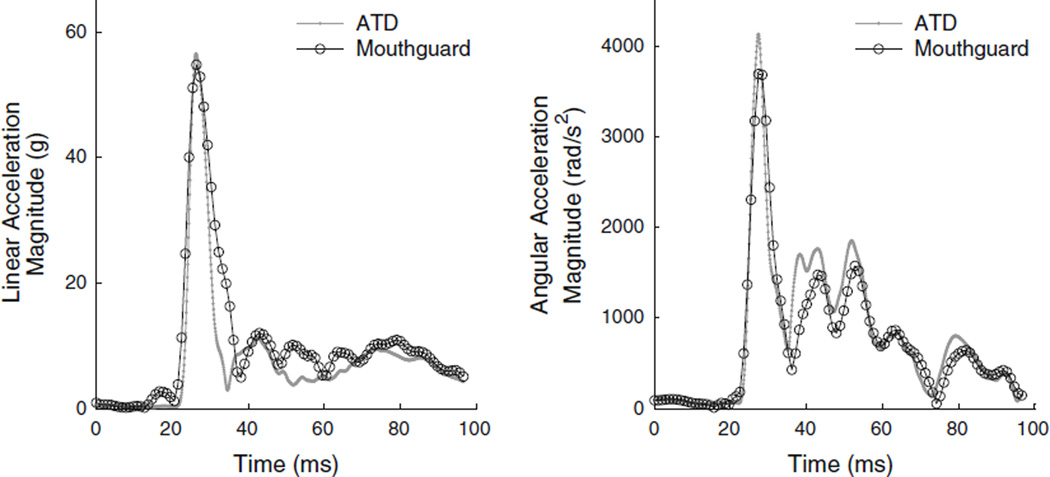
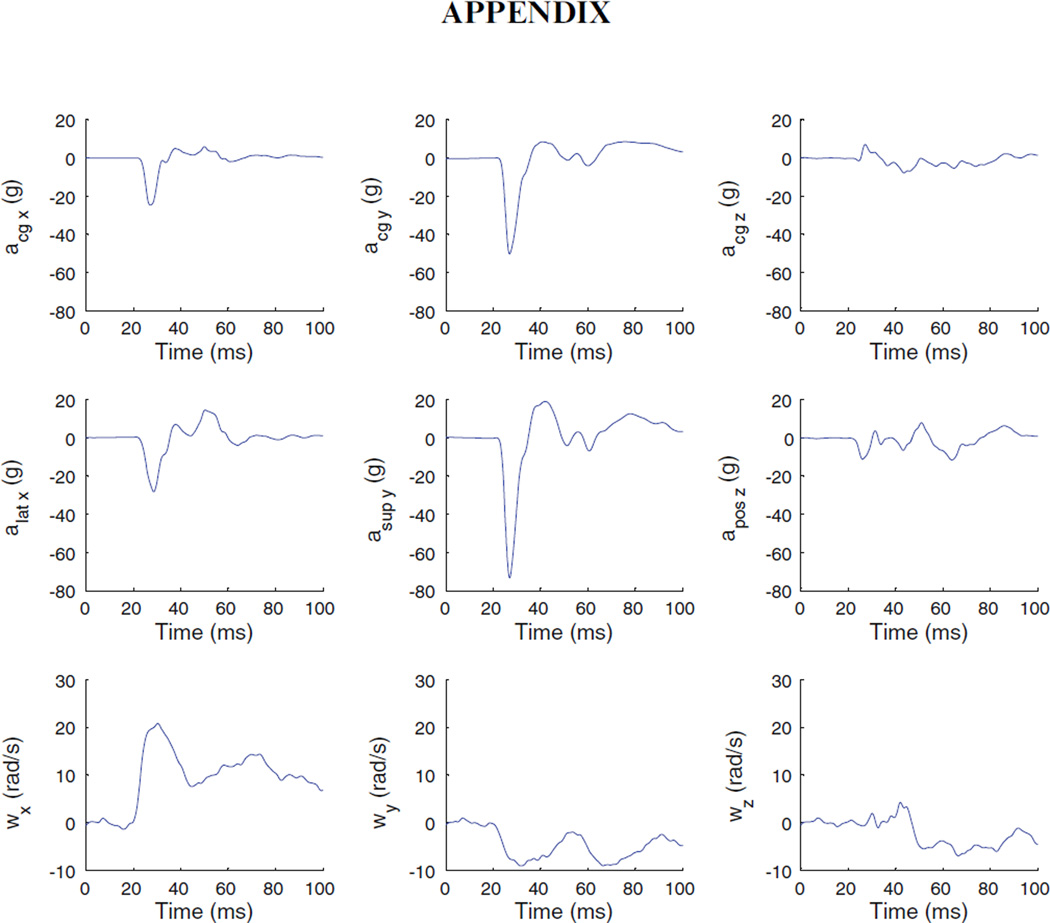
Overall, the average RMS time trace errors (±standard deviation) for linear acceleration and angular acceleration were 3.9 ± 2.1g and 202 ± 120 rad/s2, respectively. This corresponded to average NRMS time trace errors for linear acceleration of 9.9 ± 4.4% and angular acceleration of 9.7 ± 7.0%. Figure 6 depicts typical linear and angular acceleration magnitude time traces during an impact (see Fig. 7 for individual mouthguard traces). The RMS error for angular velocity was 1.0 ± 0.8 rad/s and the NRMS was 10.4 ± 9.9%.
FIGURE 6.
Typical time traces for linear and angular acceleration magnitude. These traces were from a Site B impact with impact velocity of 5.5 m/s. The peak linear acceleration error (3.1%), peak angular acceleration error (10.7%), linear acceleration RMS error (4.4g), and angular acceleration RMS error (276 rad/s2) for these traces are near the average values for all impacts. While the overall traces match closely, the angular acceleration peak is slightly under predicted by the instrumented mouthguard.
FIGURE 7.
Individual sensor traces of the ATD for the typical impact shown in Fig. 6 (Site B, impact velocity: 5.5 m/s). Sensor locations are depicted in Fig. 2.
DISCUSSION
The purpose of this study was to evaluate the instrumented mouthguard as a research device for measuring head impact kinematics. We sought to determine how closely instrumented mouthguard estimates of head center of gravity kinematics resembled actual head center of gravity measurements in an anthropomorphic test device (ATD). Results from this study showed that peak linear acceleration, peak angular acceleration, and peak angular velocity measurements are correlated between the instrumented mouthguard and the ATD, r2 = 0.96, 0.90, and 0.98, respectively (Table 3). Peak angular velocity predictions were excellent across all sites (maximum 2% average prediction error, all r2 > 0.96), while predictions for linear and angular accelerations varied more by impact site.
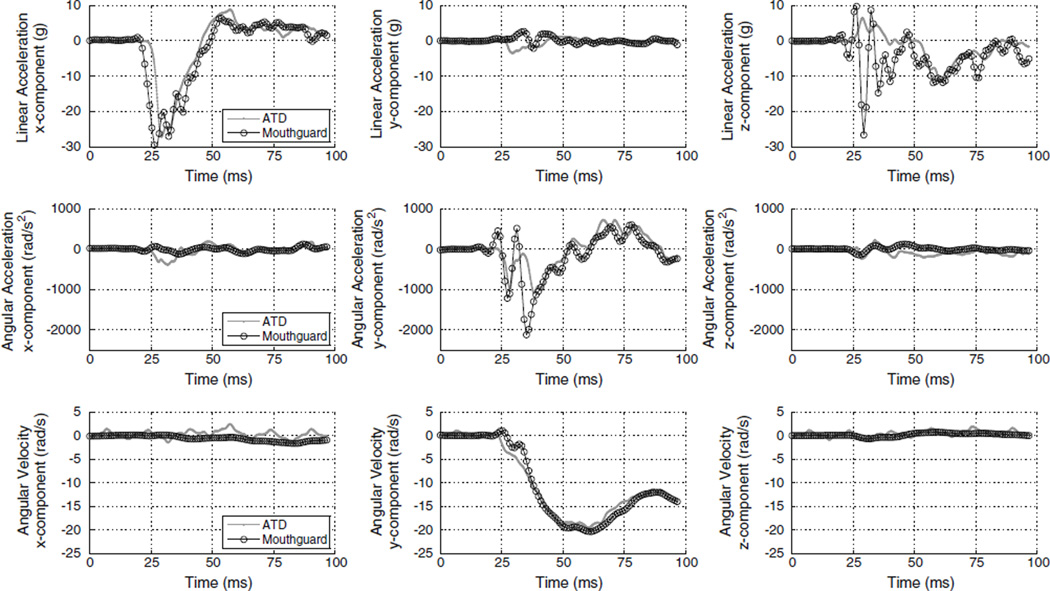
Peak angular acceleration correlations were worse for facemask (r2 = 0.61) and better for non-facemask (r2 = 0.87) impact sites (Table 3). The instrumented mouthguard on average under predicted peak angular accelerations by 10%, though facemask impacts were overpredicted by 12–44%. A unique aspect of facemask impacts is that the loads are not directly transferred from the helmet to the head, but rather are transferred through the chinstrap to the mandible.7 Therefore, the mouthguard overprediction for facemask impacts was likely due to excitation of a resonance (approximately 150 Hz, see Fig. 8), in the mouthguard cantilever tab (Fig. 1) which contains the sensors. Facemask impacts were also confined to the sagittal plane, for which the moment of inertia of the mouthguard cantilevered tab is lowest and therefore the resonant frequency is lowest. Similar to facemask SitesAand E, SiteDis also purely in the sagittal plane (see Fig. 5), and several of these measurements contain a similar oscillating signal leading to over-prediction of angular acceleration. Therefore, mouthguard tab resonance in the sagittal plane is a likely source of over-prediction error. Angular acceleration over-prediction has also been observed with in-helmet sensing where peak angular acceleration was overpredicted by up to 500% for facemask impacts.3
FIGURE 8.
Example facemask impact (Site A, impact velocity: 3.7 m/s) showing the approximately 150 Hz resonance in the linear acceleration z-component and angular acceleration y-component. Facemask impacts occured in the sagittal plane, for which the moment of inertia of the mouthguard cantilevered tab (Fig. 1) is lowest and therefore the resonant frequency is lowest. Mouthguard tab resonance in the sagittal plane is a likely source of the 13–44% over-prediction error (Table 3). Over-prediction errors have also been observed with in-helmet sensing where peak angular acceleration was overpredicted by up to 500% for facemask impacts.3
While face-mask impacts over-predict angular acceleration, non-facemask impacts tend to under-predict, especially at higher impact velocities. These under predictions are likely due to high frequency signal attenuation, as can be seen by the rounded peak in Fig. 6b. The angular acceleration calculation from the mouthguard angular velocity uses a 5-point derivative which attenuates higher frequency signals present in the gyroscope (which is only capable of 110 Hz bandwidth before differentiation). However, the spectrum of higher frequency signals in the field is not known, nor is it well established which frequencies are of physiological relevance. Therefore, it is difficult to ascertain if errors due to high frequency content in a laboratory test are meaningful or irrelevant. If these higher frequency peaks in angular acceleration were found to be relevant for brain injury, then the device could be re-designed to collect this information. However, analytical and experimental models of strains in human brain tissue have predicted that head impacts in sports occur in an injury-tolerance region that is more sensitive to angular velocity than angular acceleration.19
Peak angular velocity measurements were highly correlated for all impact locations and initial velocities (Fig. 5c, Table 3). Any resonances did not result in appreciable error in angular velocity peaks, but of course wereamplified in differentiation and therefore are present in angular acceleration errors. While angular velocity is not typically measured for in vivo head impact sensing studies forAmerican football,we believe it is a promising kinematic parameter based on the previously-suggested sensitivity of brain injury to angular kinematics inanimal, human cadaver, and computational studies.13,19,23,30 To evaluate the relative importance of angular velocity and angular acceleration in football, more injury and noninjury field data are necessary, in addition to more information on stress–strain tolerance for human concussion with respect to brain-skull dynamics.
Predictions for peak linear accelerations for nonfacemask sites were within 1% but facemask sites over-predicted by 17% (likely due to resonance as seen in angular acceleration) as shown in Table 3. However, peak linear accelerations were highly correlated across all impact sites (r2 = 0.96). The correlation in peak linear acceleration between the instrumented mouthguard andATDcenter of gravity in this study corroborates the peak linear acceleration correlation reported in a previous mouthpiece accelerometer study.14 However, this previous mouthguard study employed a rigid neck and did not employ kinematic transforms to account for any rotation. Therefore, the present study extends our knowledge of mouthguard acceleration measurement accuracy to the case of head rotation during impact. These results on acceleration are consistent with previous work showing correlations between an in-helmet accelerometer sensing system (HIT system) and head center of gravity measurements.3,26
Normalized temporal errors were similar among kinematic measures with the NRMS values ranging from 9.9 to 10.4%. Differences in error among linear acceleration, angular acceleration, and angular velocity are much smaller for NRMS than they are for the peak values because the peaks are a relatively short portion of the signal. The linear accelerationRMSin this study was 3.9 ± 2.1g which is similar to linear acceleration RMS values reported for instrumented boxing head gear, 5.9 ± 2.6g2 and for a 6 degree-of-freedominstrumented helmet tested over 0–80 g peak linear acceleration range, 3.7 ± 4.3g.26 Angular acceleration RMS values reported in this study, 202 ± 120 rad/s2 were similar to those reported by the instrumented helmet over the same 0–80g range, 252 ± 267 rad/s2,26 and less than from the instrumented boxing head gear, 595 ± 405 rad/s2.2
The resulting errors from the kinematic measures investigated in this study give confidence in deploying this device for field research. Testing was performed with a single helmet and demonstrated that the instrumented mouthguard most accurately and precisely calculated ex vivo head impact kinematics during front boss and rear impacts while lower accuracy and precision were found for facemask and rear boss impacts. It appears that under prediction errors are associated with mouthguard bandwidth limitations and that over predictions errors are associate with mouthguard tab resonance.
An important limitation of the study is that it was performed under idealized laboratory test conditions. The ATD jaw was clamped shut and we therefore did not assess human sources of noise such as mandible motion. A clamped mandible may be a reasonable approximation of field conditions because both custom and ‘‘boil-and-bite’’ mouthguards are tightly formed to the upper dentition and require manual force to remove or displace. Nevertheless, further research is necessary to characterize sources of in vivo noise that do not represent the head motion signals of interest. Noise from non-head acceleration events presents an additional challenge in that it may not only corrupt the kinematic estimates but can also result in false positive detection of head impact events. Validation of impact detection accuracy should be carried out not only on this mouthguard system, but for any such system aimed at detecting head impacts.
In estimating in vivo head kinematics, there are tradeoffs between the approach of instrumenting a mouthguard as presented here, and the more widely used in-helmet instrumentation approach.3,9,26 Because in-helmet accelerometers are attached to the helmet via springs which compress the sensors against the head, kinematic estimation errors can occur during impact when the helmet slides relative to or, in extreme cases, separates from the head.3,26 The instrumented mouthguard is not susceptible to these errors since it is coupled directly to the skull through the upper teeth and maxilla. Nevertheless, the instrumented mouthguard is subject to kinematic errors related to motion of the device in the mouth that is not associated with head movement. In-helmet sensing would not be prone to mouth-related artifact since the sensing system is mostly decoupled from the jaw, other than the chinstrap. The present study did not directly investigate in vivo mouth-related motion artifacts; therefore, further research is needed to characterize these potential sources of error.
An important feature of the mouthguard is complete 6-DOF temporal sensor data in a package that can conveniently be deployed in football and other sports. The commercially available in-helmet sensing HIT system computes 3-DOF temporal linear acceleration, but the angular acceleration is a single value estimate of peak magnitude based on the linear accelerations.3,27 An experimental version of the in-helmet sensing HIT system has been developed with additional accelerometers to provide temporal measurements in all 3 linear and 3 angular DOF.26 These 6-DOF systems may offer new insights into human mTBI injury mechanism through examination of time duration of impact, and any differences in rotational sensitivity about anatomical axes. Although the rotational acceleration of the mouthguard contains errors introduced in the differentiation process, one benefit is that the gyroscope directly senses angular velocity. Angular velocity is a kinematic parameter which bears further investigation, and direct measurement of this quantity avoids any integration error from purely accelerometer based systems.22 Given that laboratory studies have found tradeoffs between in-helmet sensing and the instrumented mouthguard, future studies might employ both systems in tandem to investigate sources of error.
In this work, we presented an instrumented mouthguard for measuring head kinematics during impact. Laboratory testing demonstrated the efficacy of measuring peak values and temporal traces of linear acceleration, angular acceleration, and angular velocity. Because of the minimal footprint, the instrumented mouthguard could potentially be deployed in a variety of populations outside American football including soccer, lacrosse, rugby, hockey, and field hockey athletes. If an injury mechanism can be identified, sports which mandate the use of mouthguards could require such an instrumented device as a diagnostic aid to identify injured athletes. Knowledge of mTBI injury mechanism would also enable preventative measures in other sectors such as transportation and military where mTBI is highly prevalent.
ACKNOWLEDGMENTS
The authors would like to thank X2Impact for donation of devices and equipment required for laboratory testing. This work was supported in part by the NIH Clinical and Translational Science Award 1UL1 RR025744 for the Stanford Center for Clinical and Translational Education and Research (Spectrum) and by the Lucile Packard Foundation for Children’s Health.
Footnotes
CONFLICT OF INTEREST
The authors have no personal financial conflict of interests related to this study.
REFERENCES
- 1.Abramowitz M, Stegun IA. Handbook of Mathematical Functions: With Formulas, Graphs, and Mathematical Tables. Vol. 55. Dover Publications; 1965. [Google Scholar]
- 2.Beckwith JG, Chu JJ, Greenwald RM. Validation of a noninvasive system for measuring head acceleration for use during boxing competition. J. Appl. Biomech. 2007;23:238–244. doi: 10.1123/jab.23.3.238. [DOI] [PubMed] [Google Scholar]
- 3.Beckwith JG, Greenwald RM, Chu JJ. Measuring head kinematics in football: correlation between the head impact telemetry system and hybrid III headform. Ann. Biomed. Eng. 2012;40:237–248. doi: 10.1007/s10439-011-0422-2. [DOI] [PMC free article] [PubMed] [Google Scholar]
- 4.Breedlove EL, Robinson M, Talavage TM, Morigaki KE, Yoruk U, O’Keefe K, King J, Leverenz LJ, Gilger JW, Nauman EA. Biomechanical correlates of symptomatic and asymptomatic neurophysiological impairment in high school football. J. Biomech. 2012;45:1265–1272. doi: 10.1016/j.jbiomech.2012.01.034. [DOI] [PubMed] [Google Scholar]
- 5.Collins MW, Grindel SH, Lovell MR, Dede DE, Moser DJ, et al. Relationship between concussion and neuropsychological performance. JAMA. 1999;282(10):964–970. doi: 10.1001/jama.282.10.964. [DOI] [PubMed] [Google Scholar]
- 6.Coronado VG, Xu L, Basavaraju SV, McGuire LC, Wald MM, et al. Surveillance for traumatic brain injury— related deaths—United States, 1997–2007. CDC Surveill. Summ. 2011;60(5):1–32. [PubMed] [Google Scholar]
- 7.Craig MJ. Biomechanics of jaw loading in football helmet impacts. Dissertation. Detroit, MI: Wayne State University; 2007. [Google Scholar]
- 8.Daniel RW, Rowson S, Duma S. Head impact exposure in youth football. Ann. Biomed. Eng. 2012;40:976–981. doi: 10.1007/s10439-012-0530-7. [DOI] [PMC free article] [PubMed] [Google Scholar]
- 9.Duma SM, Manoogian SJ, Bussone WR, Brolinson PG, Goforth MW, Donnenwerth JJ, Greenwald RM, Chu JJ, Crisco JJ. Analysis of realtime head accelerations in collegiate football players. Clin. J. Sport Med. 2005;15:3–8. doi: 10.1097/00042752-200501000-00002. [DOI] [PubMed] [Google Scholar]
- 10.Goldstein LE, Fisher AM, Tagge CA, Zhang XL, Velisek L, et al. Chronic traumatic encephalopathy in blast-exposed military veterans and a blast neurotrauma mouse model. Sci. Transl. Med. 2012;4:134–194. doi: 10.1126/scitranslmed.3003716. [DOI] [PMC free article] [PubMed] [Google Scholar]
- 11.Guskiewicz KM, Weaver NL, Padua DA, Garrett WE., Jr Epidemiology of concussion in collegiate and high school football players. Am. J. Sports Med. 2000;28(5):643–650. doi: 10.1177/03635465000280050401. [DOI] [PubMed] [Google Scholar]
- 12.Gysland SM, Mihalik JP, Register-Mihalik JK, Trulock SC, Shields EW, Guskiewicz KM. The relationship between subconcussive impacts and concussion history of clinical measures of neurologic function in collegiate football players. Ann. Biomed. Eng. 2012;40:14–22. doi: 10.1007/s10439-011-0421-3. [DOI] [PubMed] [Google Scholar]
- 13.Hardy WN, Mason MJ, Foster CD, Shah CS, Kopacz JM, et al. A study of the response of the human cadaver head to impact. Stapp Car Crash J. 2007;51:17–80. doi: 10.4271/2007-22-0002. [DOI] [PMC free article] [PubMed] [Google Scholar]
- 14.Higgins M, Halstead PD, Snyder-Mackler L, Barlow D. Measurement of impact acceleration: mouthpiece accelerometer versus helmet accelerometer. J. Athl. Train. 2007;42:5–10. [PMC free article] [PubMed] [Google Scholar]
- 15.Holbourn AHS. Mechanics of head injuries. Lancet. 1943;2:438–441. [Google Scholar]
- 16.Kang YS, Moorhouse K, Bolte JH. Measurement of six degrees of freedom head kinematics in impact conditions employing six accelerometers and three angular rate sensors. J. Biomech. Eng. 2011;133(11):111007. doi: 10.1115/1.4005427. [DOI] [PubMed] [Google Scholar]
- 17.Langlois JA, Rutland-Brown W, Wald MM. The epidemiology and impact of traumatic brain injury: a brief overview. J. Head Trauma Rehabil. 2006;21:375–378. doi: 10.1097/00001199-200609000-00001. [DOI] [PubMed] [Google Scholar]
- 18.Lewis LM, Naunheim R, Standeven J, Lauryssen C, Richter C, Jeffords B. Do football helmets reduce acceleration of impact in blunt head injuries? Acad. Emerg. Med. 2001;8(6):604–609. doi: 10.1111/j.1553-2712.2001.tb00171.x. [DOI] [PubMed] [Google Scholar]
- 19.Margulies SS, Thibault LE. A proposed tolerance criterion for diffuse axonal injury in man. J. Biomech. 1992;25(8):917–923. doi: 10.1016/0021-9290(92)90231-o. [DOI] [PubMed] [Google Scholar]
- 20.National Operating Committee on Standards for Athletic Equipment (NOCSAE) Standard linear impact test method and equipment used in evaluating the performatnce characteristics of protective headgear and face guards. NOCSAE DOC (ND) 081-04m04. 2006 [Google Scholar]
- 21.National Operating Committee on Standards for Athletic Equipment (NOCSAE) Standard test method and equipment used in evaluating the performance characteristics of protective headgear/equipment. NOCSAE DOC (ND) 001-08m10. 2009 [Google Scholar]
- 22.Newman JA, Beusenberg MC, Shewchenko N, Withnall C, Fournier E. Verification of biomechanical methods employed in a comprehensive study of mild traumatic brain injury and the effectiveness of American football helmets. J. Biomech. 2005;38:1469–1481. doi: 10.1016/j.jbiomech.2004.06.025. [DOI] [PubMed] [Google Scholar]
- 23.Ommaya AK, Gennarelli TA. Cerebral concussion and traumatic unconsciousness. Brain. 1974;97:633–654. doi: 10.1093/brain/97.1.633. [DOI] [PubMed] [Google Scholar]
- 24.Padgaonkar AJ, Kreiger KW, King AI. Measurement of angular accelerations of a rigid body using linear accelerometers. J. Appl. Mech. 1975;42:552–556. [Google Scholar]
- 25.Pellman EJ, Viano DC, Tucker AM, Casson IR. Concussion in professional football: location and direction of helmet impacts—part 2. Neurosurgery. 2003;53:799–814. doi: 10.1227/01.neu.0000093499.20604.21. [DOI] [PubMed] [Google Scholar]
- 26.Rowson S, Beckwith JG, Chu JJ, Leonard DS, Greenwald RM, Duma SM. A six degree of freedom head acceleration measurement device for use in football. J. Appl. Biomech. 2011;27:8–14. doi: 10.1123/jab.27.1.8. [DOI] [PubMed] [Google Scholar]
- 27.Rowson S, Duma SM, Beckwith JG, Chu JJ, Greenwald RM, et al. Rotational head kinematics in football impacts: an injury risk function for concussion. Ann. Biomed. Eng. 2012;40:1–13. doi: 10.1007/s10439-011-0392-4. [DOI] [PMC free article] [PubMed] [Google Scholar]
- 28.SAE. Instrumentation for Impact Test, Part 1: Electronic Instrumentation. SAE J211/1, Society of Automotive Engineers. 2007 [Google Scholar]
- 29.Walker LB, Harris EH, Pontius UR. Mass, volume, center of mass, and mass moment of inertia of head and head and neck of human body; Proceedings of Stapp Car Crash Conference SAE 730985; 1973. [Google Scholar]
- 30.Weaver AA, Danelson KA, Stitzel JD. Modeling brain injury response for rotational velocities of varying directions and magnitudes. Ann. Biomed. Eng. 2012;40:2005–2018. doi: 10.1007/s10439-012-0553-0. [DOI] [PubMed] [Google Scholar]
- 31.Yoganandan N, Pintar FA, Zhang J, Baisden JL. Physical properties of the human head: mass, center of gravity and moment of inertia. J. Biomech. 2009;42:1177–1192. doi: 10.1016/j.jbiomech.2009.03.029. [DOI] [PubMed] [Google Scholar]
- 32.Zhao L, Han W, Steiner C. Sports Related Concussions. HCUP Statistical Brief #114. 2011 [Google Scholar]


