

Abstract
Background
Vagus nerve stimulation (VNS) has antidepressant effects in treatment resistant major depression (TRMD); these effects are poorly understood. This trial examines associations of subacute (3 months) and chronic (12 months) VNS with cerebral metabolism in TRMD.
Objective
17Fluorodeoxyglucose positron emission tomography was used to examine associations between 12-month antidepressant VNS response and cerebral metabolic rate for glucose (CMRGlu) changes at 3 and 12 months.
Methods
Thirteen TRMD patients received 12 months of VNS. Depression assessments (Hamilton Depression Rating Scale [HDRS]) and PET scans were obtained at baseline (pre-VNS) and 3/12 months. CMRGlu was assessed in eight a priori selected brain regions (bilateral anterior insular [AIC], orbitofrontal [OFC], dorsolateral prefrontal [DLPFC], and anterior cingulate cortices [ACC]). Regional CMRGlu changes over time were studied in VNS responders (decreased 12 month HDRS by ≥50%) and nonresponders.
Results
A significant trend (decreased 3 month CMRGlu) in the right DLPFC was observed over time in VNS responders (n = 9; P = 0.006). An exploratory whole brain analysis (Puncorrected = 0.005) demonstrated decreased 3 month right rostral cingulate and DLPFC CMRGlu, and increased 12 month left ventral tegmental CMRGlu in responders.
Conclusions/Limitations
VNS response may involve gradual (months in duration) brain adaptations. Early on, this process may involve decreased right-sided DLPFC/cingulate cortical activity; longer term effects (12 months) may lead to brainstem dopaminergic activation. Study limitations included: a) a small VNS nonresponders sample (N = 4), which limited conclusions about nonresponder CMRGlu changes; b) no control group; and, c) patients maintained their psychotropic medications.
Keywords: Treatment resistant depression, Vagus nerve stimulation, Positron emission tomography, Depression, Antidepressant
Introduction
Vagus nerve stimulation (VNS; intermittent electrical stimulation of the left cervical vagus nerve via an implanted electrical pulse generator) has demonstrated antidepressant efficacy in treatment resistant major depression (TRMD) patients, with one year response rates ranging from 27 to 53% [1–4]. Further, unlike ECT and other preferred TRMD treatments, patients who respond to VNS tend to maintain their response [5].
Clinical studies of VNS in TRMD demonstrate that the antidepressant effects of VNS are typically delayed: many patients do not respond (i.e., decrease depression scale score by ≥ 50%) to treatment of less than 6 months. In a naturalistic, one-year, open-label extension of a multicenter trial, Rush et al. [4] found that 15% of TRMD patients responded to VNS at 3 months, 18% at 6 months, 23% at 9 months, and 30% at 12 months. These cumulative increases over a period of sustained VNS suggest that VNS may bring about a gradual and cumulative change in the brain, as is observed for VNS in epilepsy [6].
Currently, how VNS brings about its antidepressant effects is not known. Neuroimaging studies have begun to inform us of the mechanism of VNS in TRMD. The majority of these studies has assessed the effects of immediate stimulation and has noted VNS-induced change in the orbitofrontal, anterior cingulate, dorsolateral prefrontal and insular cortices, striatum, cerebellum, and brainstem [7–11]. Fewer studies have assessed chronic VNS effects on brain activity [9,12–14]. These longer-term studies vary considerably in VNS duration (1–20 months) and the findings are somewhat disparate: decreases in medial frontal and limbic activity have been found at 4 weeks [14]; decreases in insular and precuneus regional cerebral blood flow have been found at 10 weeks [12]; and metabolic/blood flow decreases in the subgenual cingulate and ventromedial prefrontal cortex have been found at one year [13]. The only 12 month VNS neuroimaging study was not able to correlate antidepressant outcome with change in regional cerebral glucose metabolic rate (CMRGlu), secondary to small response rate (2/8 subjects responding at 12 months [13]).
The afferent vagal pathway enters the CNS at the medulla terminating in the nucleus tractus solitarius NTS [15]. From the NTS, the largest collection of fibers travels to the parabrachial nucleus (PBN); alternatively, NTS fibers can bypass the PBN and synapse in the ventro-posteriormedial thalamic nucleus (VPMpc; [16]). PBN and VPMpc projections connect to many brain regions intimately involved in depression including: the hypothalamus, amygdala, and the bed nucleus of the stria terminalis [17]. Additionally, the VPMpc carries vagal afferent information to the anterior insular cortex [18]. The insular cortex then communicates with more rostral regions of the cortex (orbital and ventrolateral prefrontal cortex), and also indirectly communicates with the medial prefrontal cortex [19].
In this study, we assessed changes in brain activity at subacute (3 months) and chronic (12 months) time points in 15 TRMD VNS subjects using 17fluorodeoxyglucose positron emission tomography (FDG-PET). Subjects underwent serial FDG-PET scans at 3 time points during their VNS course: baseline (following implantation, but prior to initiation of stimulation) and after 3 and 12 months of sustained VNS. Mean relative cerebral glucose metabolism (CMRGlu) was obtained from eight a priori selected regions of interest (ROI): bilateral orbitofrontal cortex (OFC), dorsolateral prefrontal cortex (DLPFC), anterior insular cortex (AIC), and anterior cingulate cortex (ACC). These regions were selected because they are components of the VNS afferent pathway (especially the AIC, OFC, and indirectly the ACC [17–19] have previously been identified in TRMD-VNS imaging studies [7–9,12,13], and are critical regions in existing depression models [20]. Longitudinal comparisons of regional CMRGlu (for both responders and nonresponders) over these three time periods were made. Additionally, exploratory analyses, including a whole brain, voxelwise analysis of regional CMRGlu brain change, and an analysis of brainstem (ventral tegmental area) CMRGlu change was performed to further examine/understand the effects of VNS response.
Methods and materials
Subjects
The study was approved by the institutional review board of Washington University School of Medicine, and written informed consent was obtained. Subjects were recruited from community psychiatrists (n = 10) or as participants in the VNS D-21 (n = 15) entitled “Randomized comparison of outcomes in patients with treatment-resistant depression who receive VNS therapy administered at different amounts of electrical charge,” (sponsored by Cyberonics, Inc., Houston, Texas, USA) occurring simultaneously at Saint Louis University. Subjects were diagnosed with unipolar TRMD. A telephone screen was used to identify potential study candidates and final determination was made following a structured clinical interview (and verification of treatment resistance via chart review).
Because of the nature of the study treatment (permanent device placement and long term stimulation), stringent criteria were followed in selecting subjects. For study inclusion, TRMD was defined as: a current diagnosis of major depressive disorder, as defined by DSM-IV (confirmed using the Structured Clinical Interview for DSM-IV [21]); at least 2 adequate dose-duration medication trial failures in the current depressive episode; and a minimum of 4 lifetime anti-depressant treatment trial failures. Medication treatment failures were defined using a modification of the Antidepressant Treatment History Form (ATHF; [22]). Using this ATHF, each medication was scored on a 1–4 scale according to the Antidepressant Resistance Rating (ARR) scale. Each subject required a score ≥ 3 on the ARR scale for each failed treatment trial and an exposure to this antidepressant dosage for at least eight weeks (ATHF requires 4 weeks). Failed adequate duration trials of proven antidepressant augmentation agents (aripiprazole, thyroid hormone, and lithium augmentation) were also included. The classes of failed antidepressant trials included: selective serotonin reuptake inhibitors, venlafaxine, buproprion, duloxetine, mirtazipine, heterocyclic/tricyclics, monoamine oxidase inhibitors, electroconvulsive therapy (ECT), nefazodone. Additionally, all subjects required a baseline (pre-VNS implantation) score of >18 on the Hamilton Depression Rating Scale-24 item (HDRS; [23]) and were 18–85 years of age.
Exclusion criteria included: other co-morbid active Axis I DSM-IV diagnosis, pregnancy, history of stroke, traumatic or closed head injury, brain malformation, MRI contraindications, acute suicidal intention, recent history of serious suicide attempt, recent substance abuse/dependence (12 months), and personality disorder.
Chronic/severe personality disorders (especially DSM-IV cluster B) are frequently characterized by chronic dysphoria which can be misidentified as TRMD and introduce significant bias in TRMD studies [24]. For this reason, stringent criteria were followed to ensure exclusion of individuals with chronic/severe co-morbid personality disorders. This was accomplished by conversations with the referring psychiatrists, careful review of psychiatric medical records, and in-person interviews with a licensed psychiatrist or psychologist.
In our clinical experience, TRMD patients frequently resist discontinuation of their existing psychotropic/antidepressant medications (e.g., they express that the medication is minimally helping them and keeping them from becoming suicidal). For this reason, it was determined to keep subjects on their existing psychotropic medications (Table 1S); however, subjects were instructed not to modify these medications throughout the study duration. The number of psychotropic medications/subject is summarized in Table 1, the exact psychotropic medications are summarized in Table 1S.
Table 1.
Participant demographic characteristics and depression history.
| Total (N = 13) | Responders (n = 9) | Nonresponders (n = 4) | P-value | |
|---|---|---|---|---|
| Age | 46.1 (12.1) | 47.1 (10.5) | 44.0 (16.8) | 0.69 |
| Female | 77% (10) | 67% (6) | 100% (4) | 0.50 |
| Caucasian race | 92% (12) | 89% (8) | 100% (4) | 1.0 |
| Age of depression onset | 19.2 (11.3) | 19.0 (10.2) | 19.7 (15.1) | 0.92 |
| No. of depression episodes | 2.8 (2.9) | 3.2 (3.5) | 1.7 (1.0) | 0.43 |
| Years of current episode | 14.0 (13.7) | 14.3 (14.9) | 13.4 (12.4) | 0.91 |
| Lifetime depression years | 23.3 (14.1) | 26.7 (14.1) | 15.8 (12.7) | 0.21 |
| No. of failed medication trials | 7.1 (2.5) | 6.9 (2.0) | 7.7 (3.9) | 0.60 |
| History of ECT (yes) | 69% (9) | 67% (6) | 75% (3) | 1.0 |
| History of suicide attempt (yes) | 23% (3) | 11% (1) | 50% (2) | 0.20 |
| No. of lifetime hospitalizations | 2.1 (2.7) | 1.8 (1.5) | 3.0 (4.8) | 0.65 |
| No. of psychotropic medications | 4.2 (1.7) | 3.8 (1.3) | 5.2 (2.2) | 0.28 |
| No. of antipsychotic medications | 0.6 (0.6) | 0.7 (0.7) | 0.5 (0.6) | 0.69 |
| No. of benzodiazepine medications | 0.9 (0.8) | 0.8 (0.7) | 1.2 (1.0) | 0.32 |
Mood assessments
The Hamilton Depression Rating Scale – 24 item (HDRS) was administered at baseline (within 2 weeks of VNS implantation but prior to VNS), and after 3 and 12 months of VNS. Treatment response was a priori defined as ≥50% decrease from the baseline HDRS score; treatment remission as an HDRS score of ≤9 (as these measures have previously been defined in VNS treatment outcome studies [4,25]).
Imaging and scan acquisition
MRI scans
All study scans were performed at the Washington University School of Medicine Clinical Center for Imaging Research. Prior to implantation, all subjects underwent a 3 T MRI scan on a Siemens Trio MRI scanner with the following parameters: 3-D fast gradient echo MR acquisition, magnetization prepared rapid gradient echo (MPRAGE); orientation = sagittal; TR = 10 ms; TE = 4 ms; inversion time = 300 ms; Flip angle = 8; 1 slab = 160 mm; 3D partitions = 128; slice thickness = 1.25 mm; matrix = 256 × 256; scan time = 11.04 min; voxel size = 1 × 1 × 1.25.
Pet scans
All subjects underwent three FDG-PET scans. The first scan occurred within 2 weeks of implantation, but prior to initiation of stimulation. The second and third scans occurred following 3 and 12 months (within ± 5 days) of VNS respectively. These scans were obtained using a Siemens Biograph 40 TruePoint PET/CT scanner (Siemens, Berlin) in three-dimensional acquisition mode.
All FDG-PET scans were performed in the morning, and patients were instructed to fast prior to the scan (to avoid fluctuations in serum glucose), as well to hold morning psychotropic medications until after the scan. For the first PET scan (baseline), the VNS device had not yet been activated. At the 3 and 12 months scans, subjects arrived 1 h prior to their scans and their devices were turned off for 1 h (during which they reclined quietly in a dimly lit room). Following this hour, subjects were intravenously injected with approximately 10 mCi of FDG. Subjects then reclined in a quiet, dimly lit, visually neutral room for 40 min and were instructed to remain awake (eyes open) in a resting, comfortable state, and to avoid anxiety- or mood-related thoughts. Following this 40 min incubation, subjects were positioned supine in the scanner with scanning planes oriented to the canthomeatal line and were instructed to keep their eyes open and fixed on a set point and stay awake. A computed tomography (CT) scan was obtained for attenuation correction. A 20 min emission PET scan was then obtained.
VNS device activation
Following the baseline PET scan, each subject had their device activated and adjusted (over the course of the first 2 weeks) to tolerate the highest tolerable current (starting at 0.25 mA and increasing by 0.25 mA increments). All changes to VNS device parameters, including pulse width, frequency, and duty cycle, were recorded. To ensure protection of the dose-finding trial, the 5 subjects from this study had their devices turned on in a blinded fashion (i.e., both patient and research team were not aware of the initial electrical parameters). Once the dose-finding trial was completed, we were allowed access to the dosing parameters of these five subjects.
Data processing and analysis
PET images were reconstructed (DIFT algorithm) using Siemens (Berlin, Germany) software. The algorithm used to preprocess reconstructed time-binned PET data, including correction for head motion and atlas registration, has been previously described in detail [26]. Briefly, within-session head motion correction was achieved by mutual co-registration of the four 5 min frames. The PET images then were intensity normalized to obtain a whole-brain mean value of 5000. The intensity-normalized PET data then were registered across sessions and the cross-session sum was registered to the individual's structural MRI. The MRI was registered (12-parameter affine transform) to a template representing Talairach atlas space [27] as defined by the spatial normalization method of Lancaster et al. [28]. The sequence of transforms linking the PET data to the atlas was composed and the PET data then were resampled in atlas space (2 mm cubic voxels). Finally, the data were smoothed (Gaussian filter 10 mm FWHM) before statistical analysis.
Eight ROIs were selected a priori to assess for CMRGlu: bilateral (left and right) ACC, AIC, OFC, and the DLPFC. Masks of each ROI were created by manual demarcation on each subjects'; MRI (Analyze® software, Mayo Foundation, Rochester, MN, USA), with verification of anatomical demarcations by a neuroanatomist (JLP). Standardized methodologies were used for each regional demarcation: orbitofrontal cortex: Brodmann's area (BA) 10/11/47 traced in the coronal plane using the boundaries defined by Ballmaier et al. [29] dorsolateral prefrontal cortex: BA 9/46 traced using the boundaries described by Rajkowksa and Goldman-Rakic [30]; anterior cingulate cortex: traced in the coronal plane using the methodology described by McCormick et al. [31]; anterior insular cortex: traced in transverse and coronal planes as defined by Naidich et al. [32]. Fig. 1 displays the boundaries of these ROIs.
Figure 1.
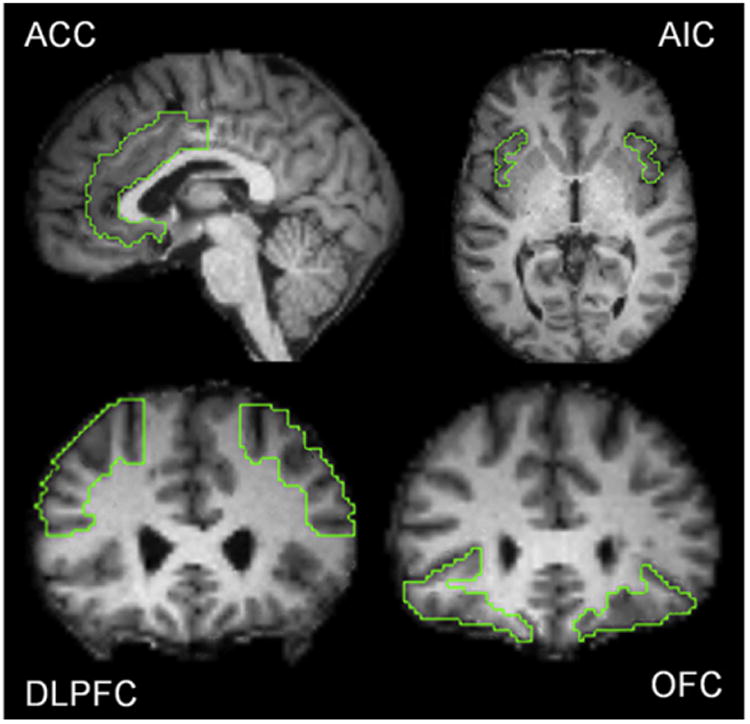
Depiction of regions of interest (ROI) locations; for description of methodology of ROI tracing see “Methods and materials”. Abbreviations: ACC = anterior cingulate cortex; AIC = anterior insular cortex; DLPFC = dorsolateral prefrontal cortex; OFC = orbitofrontal cortex.
Imaging statistical analysis
Only data from subjects who completed 12 months of VNS were analyzed. Using the 3 dimensional ROI created using each subject's MRI within Analyze®, regional CMRGlu activity was extracted for each ROI from their FDG-PET scans at each timepoint (baseline, 3 and 12 months). Statistical analysis of the extracted PET regional data was performed using SPSS (version 19.0, IBM Corporation, 2010). Changes in HDRS and CMRGlu across the three time points (baseline, 3 and 12 months) were evaluated using repeated measures analysis of variance (ANOVA). CMRGlu change (within each ROI) was evaluated separately in 12-month responders (n = 9 with ≥50% decrease in HDRS between baseline and 12 months) and nonresponders (n = 4) using polynomial trend analysis within the ANOVA to evaluate significance of linear and quadratic trends. The P-value for significance was set at < 0.00625 (0.05/8) in order to accommodate multiple comparisons in the primary analyses. For specific ROIs, correlation coefficients were calculated between change in CMRGlu (baseline to 3 months, baseline to 12 months) and change in HDRS (baseline to 12 months).
Exploratory analyses
Whole brain, voxelwise comparison over time
To determine if regional changes were occurring with VNS treatment outside of our ROIs, an exploratory whole brain, voxelwise comparison of VNS responders and nonresponders was also conducted using Statistical Parametric Mapping software (SPM8, Welcome Trust Center for Neuroimaging). Paired t-tests were done comparing pre-treatment baseline CMRGlu to 3 and 12 months VNS for both responders and nonresponders. Regions of CMRGlu change associated with subacute and chronic VNS (3 months versus baseline and 12 months versus baseline) were assessed using general linear models (Puncorrected = 0.005 for peak voxel threshold). For a cluster to be considered significant, it had to exceed the “minimum expected cluster size” (as calculated by SPM8 based on Gaussian random field theory and the smoothness of image data and listed in the SPM output file [33]).
Substantia nigra (ventral tegmental area) subregional analysis
The whole brain voxel-wise analysis identified that VNS-responders (but not nonresponders) had increased CMRGlu activity in the left substantia nigra (ventral tegmental area [VTA]) that approached our established threshold (Puncorrected = 0.005). We selected to further explore chronological VTA changes in CMRGlu for several reasons. First, the VTA is a critical component in the reward and mood systems and previous studies have suggested increased dopaminergic activity with VNS in TRMD [20,34,35]. Second, studies suggest that other neurostimulation modalities (e.g., deep brain stimulation and transcranial magnetic stimulation) activate the dopaminergic reward pathways including the substantia nigra/VTA [36,37]. As described in the primary ROI analysis above, CMRGlu data were extracted from the VTA and statistical comparisons (ANOVA) were employed. Additionally, a correlation analysis between change in VTA and change in depression was performed.
Results
Sample description
Of the 15 subjects who were consented and received the pretreatment FDG PET scan, 13 completed the trial (of the 2 lost to follow-up, one developed an implant site infection and required device explantation, and the other voluntarily withdrew prior to 3 month follow-up without explanation). Study demographics and depression history of subjects who completed the study are summarized in Table 1. The sample had an early mean age of onset of depression (19.2 years, S.D. = 11.3), many years of depression (mean = 23.3, S.D. = 14.2), and numerous failed antidepressant trials (mean = 7.1, S.D. = 2.5). The mean number of current psychotropic medications for the entire sample completing the trial was 4.2, and there was no statistical difference (P = 0.28) in psychotropic medication count between VNS responders and nonresponders.
Initially, all stimulation cycles were set to 30 s of stimulation every 5 min (30/5). Other VNS parameters were set to the participant's highest tolerable current or by the parameters of the multicenter dose-finding study. Parameter adjustments were allowed, where clinically indicated, during the study. However, little variation in settings occurred. At 3-month follow-up, mean current was 1.04 mA (S.D. = 0.37), mean signal frequency was 21.5 Hz (S.D. = 3.8), and mean pulse width was 298.5 μs (S.D. = 119.5); all stimulation cycles were 30/5. Mean values at 12-month follow-up were 1.27 mA (S.D. = 0.44), 21.5 Hz (S.D. = 3.8), 365.4 μs (S.D. = 165.1), and 30/4.3 (S.D. = 0/1.1). There were no statistically significant differences in any of the VNS electrical parameters between VNS responders and nonresponders. All subjects who were concomitantly in the dose-finding trial finished as VNS responders.
Mood assessments
At the end of 12 months of VNS, there were nine VNS responders (>50% HDRS improvement) and 4 nonresponders. Of the 9 responders, 5 were remitters (HDRS score ≤ 9). HDRS scores declined significantly and linearly from baseline (mean = 27.6, S.D. = 3.4) to 3 months (mean = 21.8, S.D. = 9.1) to 12 months (mean = 13.1, S.D. = 10.8), F(1,12) = 34.1, P < 0.001. Only two of the nine 12 month responders had achieved response by 3 months.
Primary outcome results
CMRGlu changes at 3 and 12 months
CMRGlu values for all eight ROIs from baseline to 3 and 12 months are summarized in Table 2. A significant quadratic (v-shaped) trend in CMRGlu change in the right DLPFC was noted for responders (P = 0.006), but not nonresponders (p = 0.87). A scatterplot depicting the change in CMRGlu occurring in the right DLPFC in the sample is depicted in Fig. 2.
Table 2.
Change in CMRGlu in 4 regions of interest (right vs. left) at baseline, 3 months, and 12 months in responders and nonresponders.
| ROI | Group | Side | CMRGlu | Trend analyses | |||||
|---|---|---|---|---|---|---|---|---|---|
|
|
|
||||||||
| Baseline | 3 months | 12 months | F linear | P | F quadratic | P | |||
| ACC | Rsp | R | 5863 (287) | 5792 (233) | 5842 (285) | .15 | 0.71 | 8.59 | 0.019 |
| L | 5904 (261) | 5883 (242) | 5899 (298) | .01 | 0.94 | 0.65 | 0.44 | ||
| NRsp | R | 5951 (72) | 5929 (61) | 5911 (145) | .46 | 0.55 | 0.01 | 0.93 | |
| L | 6071 (53) | 6051 (73) | 6033 (140) | .39 | 0.58 | 0 | 0.98 | ||
| AIC | Rsp | R | 5635 (168) | 5561 (220) | 5622 (305) | .03 | 0.87 | 4.35 | 0.07 |
| L | 5699 (197) | 5742 (257) | 5753 (218) | .75 | 0.41 | 0.10 | 0.76 | ||
| NRsp | R | 5985 (82) | 5897 (80) | 5938 (104) | .71 | 0.46 | 5.53 | 0.10 | |
| L | 5909 (120) | 5863 (201) | 5884 (190) | .21 | 0.68 | 0.31 | 0.62 | ||
| DLPFC | Rsp | R | 6295 (214) | 6092 (237) | 6236 (278) | .68 | 0.44 | 13.44 | 0.006a |
| L | 6326 (189) | 6290 (202) | 6390 (327) | .49 | 0.50 | 1.49 | 0.26 | ||
| NRsp | R | 6145 (116) | 6153 (383) | 6123 (278) | .05 | 0.84 | 0.03 | 0.87 | |
| L | 6320 (144) | 6244 (254) | 6270 (183) | 1.00 | 0.39 | 0.34 | 0.60 | ||
| OFC | Rsp | R | 5916 (292) | 5825 (167) | 5944 (242) | .17 | 0.69 | 5.63 | 0.045 |
| L | 5978 (268) | 5964 (215) | 6032 (226) | .56 | 0.47 | 0.77 | 0.40 | ||
| NRsp | R | 5654 (267) | 5644 (324) | 5676 (299) | .28 | 0.63 | 0.09 | 0.78 | |
| L | 5740 (160) | 5715 (298) | 5704 (244) | .46 | 0.55 | 0.01 | 0.92 | ||
ACC = anterior cingulate cortex; AIC = anterior insular cortex; CMRGlu = mean cerebral metabolic rate for glucose; DLPFC = dorsolateral prefrontal cortex; NRsp = nonresponders (n = 4); OFC = orbitofrontal cortex; ROI = region of interest; Rsp = responders (n= 9).
All CMRGlu values are normalized to 5000 (see “Methods”).
Statistically significant at P= 0.0065.
Figure 2.

Scatterplot depicting individual subject change in CMRGlu in the right DLPFC (baseline to 3 months = diamonds; 3–12 months = circles) versus percent change in Hamilton Depression Rating Scale score from baseline to 12 months. Vertical bars identify individual subjects. Solid markers = responders; open markers = nonresponders. Note the quadratic (v-shaped) change evident for 7/9 responders: decreased CMRGlu baseline to 3 months, increased CMRGlu 3–12 months; nonresponders demonstrated no consistent pattern of change. BL = baseline; CMRGlu = cerebral metabolic rate for glucose; HDRS = Hamilton Depression Rating Scale (24 item).
Exploratory analyses
Whole brain voxelwise change in CMRGlu at 3 and 12 months
For the combined 13 subjects, there were no identified regional changes noted at either 3 or 12 months. There were changes (whole brain, thresholded at Puncorrected = 0.005, minimal cluster size = 142 voxels) identified for responders. As summarized in Table 3, CMRGlu decreased from baseline to 3 months in the right dorso-lateral prefrontal cortex (BA 9), dorsomedial prefrontal cortex (BA 9), rostral anterior cingulate cortex (BA 32), and right superior temporal gyrus (BA 42)/right posterior insular cortex. From baseline to 12 months, CMRGlu decreased in the right superior temporal gyrus (BA 42) and right posterior insular cortex and increased in the left inferior temporal gyrus and cerebellar hemisphere. PET images demonstrating these changes are seen in Fig. 3. There was a third region of increased CMRGlu localizing to the right brainstem (substantia nigra, ventral tegmental area [VTA]) which approached statistical significance (peak voxel = 0.001, t = 4.4), but did not achieve the minimal cluster size required (minimum voxels = 142, actual cluster size 136 voxels). Finally, although not achieving statistical significance, the exploratory whole brain analysis also demonstrated left-sided increased CMRGlu in the left hypothalamus in VNS-responders, but not in nonresponders.
Table 3.
Exploratory, whole brain, voxelwise analysis results for VNS responders (n = 9): change in CMRGlu from baseline.
| Time | Direction of change | Region | BA | Cluster size | t-score | P | Talairach coordinates | ||
|---|---|---|---|---|---|---|---|---|---|
|
|
|||||||||
| x | y | z | |||||||
| BL – 3 months | Increased CMRGlu | none | |||||||
| Decreased CMRGlu | R superior temp gyrus/insula | 42/n/a | 796 | 5.9 | <0.001 | 54 | −10 | 6 | |
| R dorsomedial PFC/rostral ACC | 9/32 | 335 | 4.8 | 0.001 | 9 | 47 | 25 | ||
| R DLPFC | 9 | 136 | 3.8 | 0.003 | 31 | 34 | 35 | ||
| BL –12 months | Increased CMRGlu | L inferior temp gyrus | 20 | 517 | 9.6 | <0.001 | −54 | −39 | −17 |
| L cerebellar hemisphere | n/a | 297 | 5.0 | 0.001 | −17 | −77 | −42 | ||
| Left substantia nigra (VTA) | n/a | 136 | 4.4a | 0.001 | −9 | −23 | −4 | ||
| Decreased CMRGlu | R superior temp Gyrus/insula | 42/n/a | 430 | 5.5 | <0.001 | 57 | −31 | 20 | |
ACC = anterior cingulate cortex; BA= Brodmann's area; BL = baseline; CMRGlu = mean cerebral metabolic rate for glucose; DLPFC = dorsolateral prefrontal cortex; L = left; na = not applicable; R = right; VTA = ventral tegmental area.
Whole brain t-tests were run with a threshold of Puncorrected of 0.005; minimal cluster size = 142.
Approached statistical significance (peak voxel P = 0.001, t = 4.4), but did not achieve minimal cluster size required (minimum cluster size = 142 voxels; VTA actual cluster size = 136 voxels).
Figure 3.
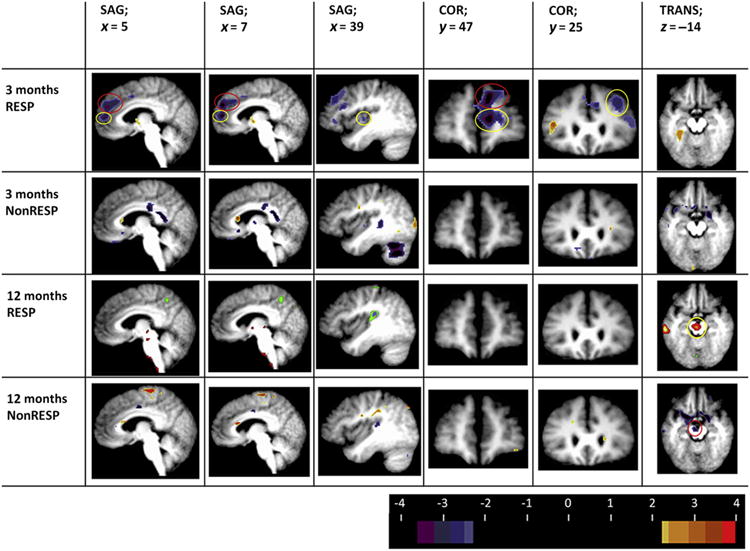
FDG-PET changes (responders vs. nonresponders; t statistic images; thresholdedat Puncorrected = 0.005, minimal cluster size 142 voxels) at 3 and 12 months. Columns 1 and 2 depict sagittal sections at Talairach slices x = 5 and 7. Note the right-sided decreased CMRGlu in the dorsomedial (BA 9; red circle) and rostral anterior cingulate cortex (BA 32; yellow circle) noted at 3 months in responders, but not in nonresponders. Further, these changes are not seen later in the course of VNS (12 months). Column 3 depicts a sagittal section at Talairach slice x = 39. Note the 3 month decrease in right posterior insular/superior temporal CMRGlu (yellow circle) in responders. Column 4 depicts a coronal sections at Talairach slice y = 47. Note the decreased CMRGLu in the rostral anterior cingulate (BA32, yellow circle) and dorsomedial and dorsolateral PFC (column 5; BA9; red circle) in responders only at 3 months VNS. Column 5 depicts a coronal section at Talairach slice y = 25. Note the decreased CMRGlu in the dorsolateral PFC(BA9; yellow circle) at 3 months in VNS responders only. Column 6 depicts a transverse section at Talairach slice z = −14. Note the increased CMRGlu in the left substantia nigra (VTA; yellow circle) at 12 months in the VNS responders; conversely, a decrease in CMRGlu is observed in nonresponders at 12 months in VNS nonresponders (red circle). All images in neurological format (viewer right/left = subject right/left). Although changes in the responders-only group did reach our established threshold, the small sample size (N = 4) of VNS nonresponders prohibits making conclusive determinations. Abbreviations: COR = coronal; SAG = sagittal; TRANS = transverse; RESP = VNS responder at 12 months; NonRESP = VNS nonresponder at 12 months. Images are thresholded at t = 2.7 for pattern illustrative purposes (t = 3.8 for statistical significance). (For interpretation of the references to color in this figure legend, the reader is referred to the web version of this article.)
Substantia nigra (ventral tegmental area) subregional analysis
As shown in Table 4, a clear linear trend emerged for CMRGlu for the VTA among responders (P = 0.002, uncorrected). An opposite linear trend was noted in the nonresponders, but it did not reach statistical significance due to the limited number of VNS nonresponders. Of the 9 VNS responders, 7 demonstrated increased CMRGlu at 3 months and 8/9 demonstrated increased CMRGlu at 12 months (relative to baseline). In contrast, 3/4 VNS nonresponders demonstrated decreased VTA CMRGlu at 3 months and 3/4 demonstrated decreased VTA at 12 months, relative to baseline. The pattern of change was suggestive of a cross-over interaction effect. Therefore, a mixed-model ANOVA was calculated that compared CMRGlu change over time as a function of response group (responders vs. nonresponders). An interaction effect was observed for the linear trend, F(1,11) = 18.6, P = 0.001. Fig. 4C displays the cross-over interaction. As a final analysis, CMRGlu change scores for the substantia nigra (baseline to 3 months, baseline to 12 months) were correlated with HDRS change scores (baseline to 12 months). CMRGlu 3-month change was correlated with HDRS change at r = −0.60, P = 0.03; CMRGlu 12-month change was correlated with HDRS change at r = −0.61, P = 0.027 (both r probability values uncorrected). These relationships are depicted in Fig. 4A and B. Fig. 5 compares the 12 month CMRGlu left sided VTA and hypothalamic change observed in VNS responders versus nonresponders.
Table 4.
Change in CMRGlu in substantia nigra (ventral tegmental area) ROI at baseline, 3 months, and 12 months in responders and nonresponders.
| Group | Substantia nigra CMRGlu | Trend analyses | |||||
|---|---|---|---|---|---|---|---|
|
|
|
||||||
| Baseline | 3 months | 12 months | F linear | P | F quadratic | P | |
| Rsp | 4863 (501) | 4988 (395) | 5067 (500) | 20.96 | .002a | .12 | .74 |
| NRsp | 5068 (326) | 4976 (341) | 4844 (153) | 3.82 | .146 | .11 | .76 |
CMRGlu = mean cerebral metabolic rate for glucose; NRsp = nonresponders (n = 4); ROI = region of interest; Rsp = responders (n = 9).
Uncorrected.
Figure 4.

(A) Scatterplot of the association between change in left ventral tegmental area (VTA) CMRGlu and change in HDRS score at 3 months VNS. (B) Scatterplot of the association between change in left VTA CMRGlu and change in HDRS at 12 months VNS. (C) Depicts the apparent reciprocal relationship between VNS response status and change in left VTA CMRGlu over time. VTA CMRGlu increases over time in VNS responders and appears to decrease with time in VNS nonresponders; however, limited sample size of VNS nonresponders prohibits making a definitive conclusion.
Figure 5.
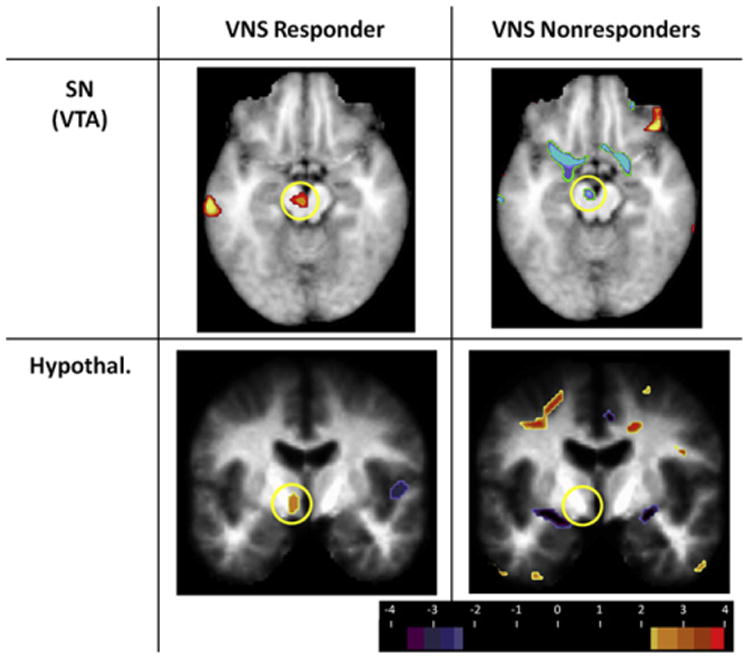
Differences in 12 month substantia nigra/VTA and hypothalamic CMRGlu in VNS responders vs. nonresponders. The top row depicts increased left-sided VTA CMRGlu in the 12 month VNS responders (left column; yellow circle) and decreased VTA CMRGlu in the nonresponders (right column; yellow circle). The bottom row depicts the increased left-sided hypothalamic CMRGlu in VNS responders (left column; yellow circle) and absence of observable change in CMRGlu in the VNS nonresponders (right column; yellow circle). Images are thresholded at t = 2.7 for pattern illustrative purposes (t = 3.8 for statistical significance). Abbreviations: SN = substantia nigra; VTA = ventral tegmental area; Hypothal = hypothalamus. (For interpretation of the references to color in this figure legend, the reader is referred to the web version of this article.)
Discussion
In subjects who responded to VNS for TRMD at 12 months, a significant trend of decreasing mean regional CMRGlu was identified in the right DLPFC over time. This change followed a “v-shaped” quadratic pattern, with a decrease in right DLPFC CMRGlu at 3 months and returning to approach baseline at 12 months. These findings suggest a transient subacute flux state occurring with VNS in TRMD at or prior to 3 months of stimulation. Exploratory analyses suggested further areas of change, most notably the VTA.
These findings stand in contrast to the only other 12 month FDG-PET study of VNS in TRMD [13], which noted decreasing ventromedial prefrontal CMRGlu over 12 months. Several marked differences in design and antidepressant outcome exist between the current study and the Pardo et al. [13] study that may explain the discrepancy: (a) Pardo et al. [13] studied 8 subjects, only 2 of whom were responders with no remitters; (b) they had very wide windows of PET scanning time points (e.g., “chronic scan 1” PET scan range was 4–6 months, “chronic scan 2” PET scan range was 9–14 months), wherein only 4/8 subjects had the first chronic scan (and 2 of whom were eventual responders); and (c) only the baseline to 12 month scan comparison contained all 8 subjects (again, with only 2 responders). Thus, with the absence of 4 “datapoints” at the 6 month scan, the Pardo et al. study had limited ability to identify trends in CMRGlu change from baseline to 12 months; changes in responders would have been nearly impossible to detect with n = 2 responders; and variation in PET imaging acquisition and missing PET data would have increased error variance. In contrast this study had a larger sample size (13 vs. 8), precise scan time points (3 and 12 months ± 5 days), a considerably earlier “midpoint” scan (3 months), much higher response rate (69% vs. 25%), and treatment remitters (38% vs. 0%). If, as we propose, a relatively early change event occurs (3 months) in those patients responding to VNS, the Pardo et al. study design would likely have missed that event (2nd chronic scan occurring between 4 and 6 months).
Dorsolateral and dorsomedial prefrontal cortex deactivation associated with VNS
Similar to the findings of this trial, several VNS TRMD neuroimaging studies have demonstrated DLPFC changes. Mu et al. [8], using blood oxygen level dependent functional MRI (BOLD-fMRI), found acute deactivation of the left DLPFC at low pulse width VNS (150 μs) and increased left DLPFC/medial PFC activity with higher pulse width VNS (300 and 500 μs). Neuroimaging studies of the sustained effects of VNS in TRMD also implicate the right-sided DLPFC. Nahas et al. [9], using BOLD-fMRI, studied the effects of sustained VNS (100 weeks) on the TRMD brain's immediate response to stimulation (activated and measured VNS brain responses in real time). Initially, immediate VNS coincided with activation in the right DLPFC (BA 46); however, with additional sustained stimulation, immediate VNS stimulation led to predominantly deactivation (deactivation “switch” occurred at 30 weeks VNS, approximately the time patients frequently denote antidepressant improvement). Using linear regression it was determined that immediate VNS (applied sequentially over time) was associated with decreased activation in the right DLPFC. Similarly, Zobel et al. [14], using single photon emission-computed tomography (SPECT), found a significant decrease in the right (but not the left) DLPFC after 10 weeks of VNS.
Numerous studies have demonstrated baseline decreases in DLPFC activity associated with depression; others have demonstrated that these baseline DLPFC decreases resolve with antidepressant medication treatment [38]. Conversely, similar to this VNS study, Nobler et al. [39], using FDG-PET, found bilateral DLPFC decreases in regional metabolic activity after a course of ECT. Similarly, Goldapple et al. [40], found bilateral DLPFC decreases in regional cerebral metabolic activity following a course of 15–20 cognitive behavioral therapy sessions.
Antidepressant effects of VNS evolve over extended time frame
Studies in both TRMD [4] and epilepsy [6] demonstrate that the therapeutic effects of VNS occur with sustained stimulation. The findings of this neuroimaging trial suggest significant regional metabolic changes occur early (at least in the first 3 months) of VNS in TRMD. Interestingly, for our selected ROIs, the CMRGlu values trend back toward baseline values; however, for the VTA, CMRGlu increases continued through month 12 in responders. Hence, early (largely right-sided decreases) in CMRGlu may be necessary for subsequent brainstem (VTA) changes.
Difference in left and right hemispheric changes in CMRGlu
Data from this study demonstrate a clear hemispheric dichotomous pattern, with early (3 months) VNS treatment predominantly associated with decreased CMRGlu on the right (especially in the DLPFC, rostral ACC, and dorsomedial PFC) and increased CMRGlu on the left. This right-decrease, left-increase activity pattern has been observed in most previous chronic VNS neuroimaging studies regardless of the duration of stimulation [9,12,13]. Kosel [12], using [99mTc]-HMPAO SPECT before and after 10 weeks of VNS in TRMD, found deactivation in the right precuneus, cuneus, and lingual gyrus. Nahas et al. [9], in the previously described BOLD fMRI study, found decreased immediate in-scanner stimulation response in multiple right-sided structures including the right insula and DLPFC (BA 46) with greater VNS chronicity (months).
The right versus left hemispheric specificity of CMRGlu change observed predominantly at 3 months of VNS in responders is consistent with several lines of evidence suggesting an inter-hemispheric imbalance in depression [41]. These models posit that depression is associated with right hemispheric hyperactivation/left hemispheric hypoactivation. Numerous neuroimaging studies (PET, fMRI) have demonstrated prefrontal cortex (especially DLPFC) hypoactivity on the left and hyperactivity on the right in MDD [41]. In fact, one recent fMRI challenge study demonstrated that depression severity correlated with right hemisphere hyperactivity [42]. Further, efforts to selectively modulate left vs. right cortical activity (using transcranial direct current stimulation or transcranial magnetic stimulation) follow this paradigm of attempting to increase cortical activity on the left and decrease activity on the right [43,44]. Finally, hemispheric lateralization may be critical to understanding treatment-resistance in MDD. Bruder et al. [45] found that SSRI-resistant depressives were more likely to demonstrate right-sided EEG hyperactivity than SSRI-responders. Similarly, our group found that increased right anterior insular CMRGlu correlated with antidepressant nonresponse to VNS in TRMD [46].
The early left-right asymmetrical changes we observed suggest that VNS in TRMD may engage an opponent interaction between the left and right sides of the AIC/ACC core control network. This matches an evolving model which associates left/right asymmetry with approach/avoidance behavior [47], positive/negative affect [41,48,49], and parasympathetic/sympathetic functions [50]. Thus, hyperactivation on the right in MDD, signifying negative affect and cortisol release, may be reduced by VNS activation on the left, which generates positive affect, increased immune function, and most importantly, de-activates the right hemisphere.
Brainstem activations observed at 12 months in VNS responders
One of the more compelling, although highly preliminary, findings of this longitudinal neuroimaging trial was an increase in CMRGlu in the VTA region of the left substantia nigra in VNS-responders at 12 months. The VTA is a small region in the ventromedial mesencephalon, which contains dopaminergic cell bodies that extend medially from the pars compacta of the substantia nigra (SN). Together with the medial substantia nigra, the VTA provides dopaminergic projections to several limbic-related brain regions, including the nucleus accumbens and other ventromedial parts of the striatum, and the prefrontal cortex [35]. These dopaminergic pathways are believed to have a central role in reward processing and addictions, presumably by signaling the presence of reward [35]. The observed VNS-responder-specific increase in VTA CMRGlu further suggests that increased dopaminergic function may be a critical part of the mechanism of action of VNS in TRMD. This is consistent with the findings of Carpenter et al. [34] who found increased cerebrospinal fluid (CSF) homovanillic acid (a metabolite of dopamine) following VNS inTRMD; CSF metabolites of serotonin/norepinephrine were unchanged. However, given the small number of VNS nonresponders, these findings are highly preliminary and will require replication.
Limitations and future directions
The sample size was relatively small, with 13 of 15 subjects completing 12 months of follow-up, with 9 responders and only 4 nonresponders. Thus, statistical power was inadequate to detect smaller differences and multivariate data analysis was restricted. For example, although we did not observe similar early (3 month) decreases in regional CMRGlu in the VNS nonresponder group, the small number of VNS nonresponders (n = 4) prohibited us from making any definitive conclusions. However, collection of large groups of well-characterized, VNS-implanted TRMD subjects is very difficult. To our knowledge, this sample is the largest longitudinal VNS TRMD imaging sample (12 months) gathered to date. We knew at the study design phase that assembling a large sample size was cost prohibitive. Further, to minimize the chance of type 1 errors, we a priori limited the number of brain areas to be compared between groups to only 8. Furthermore, we adjusted P values using the stringent Bonferroni correction. Importantly, this study lacked a control group, i.e., all subjects received active VNS; hence, we cannot conclusively state the CMRGlu changes occurred as a result of VNS or that these CMRGlu changes reflect the effects of VNS. It is possible that the changes observed could have been unrelated to sustained VNS or an interaction coming about as a result of the clinical change.
Study subjects were on adjunct psychotropic medications. Studies have demonstrated that whole brain metabolism can be reduced by benzodiazepines and antipsychotic drugs, which could potentially confound interpretations of absolute and normalized values [51,52]. It would be optimal to have all subjects medication-free; however, we chose to allow subjects to continue their medications because many TRMD patients are clinically fragile and the medication combinations they are on protect them from dangerous behaviors (suicidal behaviors, e.g., 25% of study subjects had history of a suicide attempt). To minimize variability, subjects remained unchanged on their psychotropic medications throughout the 12-month trial and were instructed to postpone morning psychotropics until after their PET scans; however, it is conceivable that subjects varied their situational medication use (e.g., benzodiazepines) during the study.
Our VNS antidepressant response rate (9/13 completers = 69%) was considerably higher than the rate seen in the multicenter trials (27–53%). We attribute this higher rate of anti-depressant response to more rigorous screening for potential TRMD confounding factors (specifically comorbid significant personality disorder and substance abuse). This high response rate is consistent with our previous experience: of the 54 VNS implants performed at our institutions for TRMD (St. Louis University and Washington University Schools of Medicine), 67% (36) have responded at one year (unpublished data).
Lastly, evidence exists that MDD may lead to structural changes (primarily regional decreases) in depression-related brain regions, including regions in the current study [53]. These structural changes could lead to misestimations of the magnitude of the changes in regional metabolic activity due to partial volume averaging [54]. In an effort to address this issue, we drew individual ROIs based on each subject's MRI scan (rather than using a nonspecific atlas-based regional mask).
Supplementary Material
Acknowledgments
The authors thank Helen Mayberg, MD, (Emory University School of Medicine) for her consultative advice on this project. We also thank JoAnn Filla-Taylor, RN (research coordinator at St. Louis University), Jon Christensen and Lars Couture (image processing and analysis), and Betsy Thomas (subject scheduling) for their invaluable assistance with this project.
This work was supported by funding from the National Institute of Mental Health CRC K08 award (1K08MH078156-01A1) and YIS K24 award (9K24MH07951006), the National Institute of Neurological Disorders and Stroke P30NS048056, as well as funding from CRC's National Alliance for Research in Schizophrenia and Affective Disorders (NARSAD) Young Investigators Award, and the Sidney R. Baer, Jr. Foundation. Cyberonics (Houston, TX) donated three cost-free devices to subjects in this trial.
Financial disclosures: CRC has previously received grant funding for research from Cyberonics, the maker of the VNS device. He did not receive any funding from Cyberonics for this study. CRC is on the speaker's bureau for Merck and Bristol-Myers Squibb. CRC is receiving research grant funding from Bristol-Myers Squibb. MAM is an employee of Avid Radiopharmaceuticals. RDB receives royalty interest from Medtronics for licensing intellectual property in the manufacture of the StealthStation. YIS, DCP, JJC, ADC, JLP, MAG, LAG, MEC, and AZS have no financial relationships to disclose.
Footnotes
Supplementary material: Supplementary material related to this article can be found, in the online version, at http://dx.doi.org/10.1016/j.brs.2012.11.006.
References
- 1.Bajbouj M, Merkl A, Schlaepfer TE, Frick C, Zobel A, Maier W, et al. Two-year outcome of vagus nerve stimulation in treatment-resistant depression. J Clin Psychopharmacol. 2010;30(3):273–81. doi: 10.1097/JCP.0b013e3181db8831. [DOI] [PubMed] [Google Scholar]
- 2.Marangell LB, Rush AJ, George MS, Sackeim HA, Johnson CR, Husain MM, et al. Vagus nerve stimulation (VNS) for major depressive episodes: one year outcomes. Biol Psychiatry. 2002;51(4):280–7. doi: 10.1016/s0006-3223(01)01343-9. [DOI] [PubMed] [Google Scholar]
- 3.Rush AJ, George MS, Sackeim HA, Marangell LB, Husain MM, Giller C, et al. Vagus nerve stimulation (VNS) for treatment-resistant depressions: a multi-center study. Biol Psychiatry. 2000;47(4):276–86. doi: 10.1016/s0006-3223(99)00304-2. [DOI] [PubMed] [Google Scholar]
- 4.Rush AJ, Sackeim HA, Marangell LB, George MS, Brannan SK, Davis SM, et al. Effects of 12 months of vagus nerve stimulation in treatment-resistant depression: a naturalistic study. Biol Psychiatry. 2005;58(5):355–63. doi: 10.1016/j.biopsych.2005.05.024. [DOI] [PubMed] [Google Scholar]
- 5.Nahas Z, Marangell LB, Husain MM, Rush AJ, Sackeim HA, Lisanby SH, et al. Two-year outcome of vagus nerve stimulation (VNS) for treatment of major depressive episodes. J Clin Psychiatry. 2005;66(9):1097–104. doi: 10.4088/jcp.v66n0902. [DOI] [PubMed] [Google Scholar]
- 6.Morris GL, 3rd, Mueller WM. Long-term treatment with vagus nerve stimulation in patients with refractory epilepsy. The vagus nerve stimulation study group E01-E05. Neurology. 1999;53(8):1731–5. doi: 10.1212/wnl.53.8.1731. [DOI] [PubMed] [Google Scholar]
- 7.Conway CR, Sheline YI, Chibnall JT, George MS, Fletcher JW, Mintun MA. Cerebral blood flow changes during acute vagus nerve stimulation for depression. Psychiatry Res Neuroimaging. 2006;146(2):179–84. doi: 10.1016/j.pscychresns.2005.12.007. [DOI] [PubMed] [Google Scholar]
- 8.Mu Q, Bohning DE, Nahas Z, Walker J, Anderson B, Johnson KA, et al. Acute vagus nerve stimulation using different pulse widths produces varying brain effects. Biol Psychiatry. 2004;55(8):816–25. doi: 10.1016/j.biopsych.2003.12.004. [DOI] [PubMed] [Google Scholar]
- 9.Nahas Z, Teneback C, Chae JH, Mu Q, Molnar C, Kozel FA, et al. Serial vagus nerve stimulation functional MRI in treatment-resistant depression. Neuropsychopharmacology. 2007;32(8):1649–60. doi: 10.1038/sj.npp.1301288. [DOI] [PubMed] [Google Scholar]
- 10.Lomarev M, Denslow S, Nahas Z, Chae JH, George MS, Bohning DE. Vagus nerve stimulation (VNS) synchronized BOLD fMRI suggests that VNS in depressed adults has frequency/dose dependent effects. J Psychiatr Res. 2002;36(4):219–27. doi: 10.1016/s0022-3956(02)00013-4. [DOI] [PubMed] [Google Scholar]
- 11.Bohning D, Lomarev M, Denslow S, Nahas Z, Shastri A, George MS. Feasibility of vagus nerve stimulation–synchronized blood oxygenation level– dependent functional MRI. Invest Radiol. 2001;36(8):470–9. doi: 10.1097/00004424-200108000-00006. [DOI] [PubMed] [Google Scholar]
- 12.Kosel M, Brockmann H, Frick C, Zobel A, Schlaepfer TE. Chronic vagus nerve stimulation for treatment-resistant depression increases regional cerebral blood flow in the dorsolateral prefrontal cortex. Psychiatry Res. 2011;191(3):153–9. doi: 10.1016/j.pscychresns.2010.11.004. [DOI] [PubMed] [Google Scholar]
- 13.Pardo JV, Sheikh SA, Schwindt GC, Lee JT, Kuskowski MA, Surerus C, et al. Chronic vagus nerve stimulation for treatment-resistant depression decreases ventromedial prefrontal glucose metabolism. Neuroimage. 2008;42(2):879–89. doi: 10.1016/j.neuroimage.2008.04.267. [DOI] [PMC free article] [PubMed] [Google Scholar]
- 14.Zobel A, Joe A, Freymann N, Clusmann H, Schramm J, Reinhardt M, et al. Changes in regional cerebral blood flow by therapeutic vagus nerve stimulation in depression: an exploratory approach. Psychiatry Res. 2005;139(3):165–79. doi: 10.1016/j.pscychresns.2005.02.010. [DOI] [PubMed] [Google Scholar]
- 15.Beckstead RM, Norgren R. An autoradiographic examination of the central distribution of the trigeminal, facial, glossopharyngeal, and vagal nerves in the monkey. J Comp Neurol. 1979;1184(3):455–72. doi: 10.1002/cne.901840303. [DOI] [PubMed] [Google Scholar]
- 16.Beckstead RM, Morse JR, Norgren R. The nucleus of the solitary tract in the monkey: projections to the thalamus and brain stem nuclei. J Comp Neurol. 1980;190(2):259–82. doi: 10.1002/cne.901900205. [DOI] [PubMed] [Google Scholar]
- 17.Henry TR. Therapeutic mechanism of vagus nerve stimulation. Neurology. 2002;59(Suppl. 4):S3–14. doi: 10.1212/wnl.59.6_suppl_4.s3. [DOI] [PubMed] [Google Scholar]
- 18.Carmichael ST, Price JL. Sensory and premotor connections of the orbital and medial prefrontal cortex. J Comp Neurol. 1995;363(4):642–64. doi: 10.1002/cne.903630409. [DOI] [PubMed] [Google Scholar]
- 19.Ongür D, Price JL. The organization of networks within the orbital and medial prefrontal cortex of rats, monkeys and humans. Cereb Cortex. 2000;10:206–19. doi: 10.1093/cercor/10.3.206. [DOI] [PubMed] [Google Scholar]
- 20.Price JL, Drevets WL. Neurocircuitry of mood disorders. Neuropsychopharmacology. 2010;35:192–216. doi: 10.1038/npp.2009.104. [DOI] [PMC free article] [PubMed] [Google Scholar]
- 21.First MB, Spitzer RL, Gibbon M, Williams JBW. Structured clinical interview for DSM-IV axis I disorders, patient edition (SCID-P) Version 2. New York: New York State Psychiatric Institute, Biometrics Research; 1995. [Google Scholar]
- 22.Prudic J, Haskett RF, Mulsant B, Malone KM, Pettinati HM, Stephens S, et al. Resistance to antidepressant medications and short-term clinical response to ECT. Am J Psychiatry. 1996;153(8):985–92. doi: 10.1176/ajp.153.8.985. [DOI] [PubMed] [Google Scholar]
- 23.Hamilton M. Development of a rating scale for primary depressive illness. Br J Soc Clin Psychol. 1967;6(4):278–96. doi: 10.1111/j.2044-8260.1967.tb00530.x. [DOI] [PubMed] [Google Scholar]
- 24.Zanarini MC, Frankenburg FR, DeLuca CJ, Hennen J, Khera GS, Gunderson JG. The pain of being borderline: dysphoric states specific to borderline personality disorder. Harv Rev Psychiatry. 1998;6(4):201–7. doi: 10.3109/10673229809000330. [DOI] [PubMed] [Google Scholar]
- 25.Rush JA, Marangell LB, Sackeim HA, George MS, Brannan SK, Davis SM, et al. Vagus nerve stimulation for treatment-resistant depression: a randomized, controlled acute phase trial. Biol Psychiatry. 2005;58:347–54. doi: 10.1016/j.biopsych.2005.05.025. [DOI] [PubMed] [Google Scholar]
- 26.Eisenstein SA, Koller JM, Piccirillo M, Kim A, Antenor-Dorsey JA, Videen TO, et al. Characterization of extrastriatal D2 in vivo specific binding of [18F] (N-methyl)benperidol using PET. Synapse. 2012;66(9):770–80. doi: 10.1002/syn.21566. [DOI] [PMC free article] [PubMed] [Google Scholar]
- 27.Talairach J, Tournoux P. Co-planar stereotaxic atlas of the human brain. New York: Thieme; 1988. [Google Scholar]
- 28.Lancaster JL, Glass TG, Lankipalli BR, Downs H, Mayberg H, Fox PT. A modality-independent approach to spatial normalization of tomographic images of the brain. Hum Brain Mapp. 1995;3:209–23. [Google Scholar]
- 29.Ballmaier M, Toga AW, Blanton RE, Sowell ER, Lavretsky H, Peterson J, et al. Anterior cingulate, gyrus rectus, and orbitofrontal abnormalities in elderly depressed patients: an MRI-based parcellation of the prefrontal cortex. Am J Psychiatry. 2004;161(1):99–108. doi: 10.1176/appi.ajp.161.1.99. [DOI] [PubMed] [Google Scholar]
- 30.Rajkowska G, Goldman-Rakic PS. Cytoarchitectonic definitionofprefrontal areas in the normal human cortex: II. Variability in locations of areas 9 and 46 and relationshiptotheTalairachcoordinatesystem. Cereb Cortex. 1995;5(4):323–37. doi: 10.1093/cercor/5.4.323. [DOI] [PubMed] [Google Scholar]
- 31.McCormick LM, Ziebell S, Nopoulos P, Cassell M, Andreasen NC, Brumm M. Anterior cingulate cortex: an MRI-based parcellation method. Neuroimage. 2006;32(3):1167–75. doi: 10.1016/j.neuroimage.2006.04.227. [DOI] [PubMed] [Google Scholar]
- 32.Naidich TP, Kang E, Fatterpekar GM, Delman BN, Gultekin SH, Wolfe D, et al. The insula; anatomic study and MR imaging display at 1.5T. AJNR Am J Neuroradiol. 2004;25(2):222–32. [PMC free article] [PubMed] [Google Scholar]
- 33.Friston KJ, Worsley KJ, Frackowiak RSJ, Mazziotta JC, Evans AC. Assessing the significance of focal activations using their spatial extent. Hum Brain Mapp. 1994;1:214–20. doi: 10.1002/hbm.460010306. [DOI] [PubMed] [Google Scholar]
- 34.Carpenter LL, Moreno FA, Kling MA, Anderson GM, Regenold WT, Labiner DM, et al. Effect of vagus nerve stimulation on cerebrospinal fluid monoamine metabolites, norepinephrine, and gamma-aminobutyric acid concentrations in depressed patients. Biol Psychiatry. 2004;56(6):418–26. doi: 10.1016/j.biopsych.2004.06.025. [DOI] [PubMed] [Google Scholar]
- 35.Schultz W, Dayan P, Montague PR. A neural substrate of prediction and reward. Science. 1997;275(5306):1593–9. doi: 10.1126/science.275.5306.1593. [DOI] [PubMed] [Google Scholar]
- 36.Friedman A, Frankel M, Flaumenhaft Y, Merenlender A, Pinhasov A, Feder Y, et al. Programmed acute electrical stimulation of the ventral tegmental area alleviates depressive-like behavior. Neuropsychopharmacology. 2009;34:1057–66. doi: 10.1038/npp.2008.177. [DOI] [PubMed] [Google Scholar]
- 37.Keck ME, Welt T, Muller MB, Erhardt A, Ohl F, Toschi N, et al. Repetitive transcranial magnetic stimulation increases the release of dopamine in the mesolimbic and mesostriatal system. Neuropharmacology. 2002;43:101–9. doi: 10.1016/s0028-3908(02)00069-2. [DOI] [PubMed] [Google Scholar]
- 38.Drevets WC, Gadde K, Krishnan KRR. Neuroimaging studies of depression. In: Charney DS, Nestler EJ, editors. Neurobiology of mental illness. 3rd. Oxford University Press; 2009. pp. 461–90. [Google Scholar]
- 39.Nobler MS, Oquendo MA, Kegeles LS, Malone KM, Campbell CC, Sackeim HA. Decreased regional brain metabolism after ECT. Am J Psychiatry. 2001;158(2):305–8. doi: 10.1176/appi.ajp.158.2.305. [DOI] [PubMed] [Google Scholar]
- 40.Goldapple K, Segal Z, Garson C, Lau M, Bieling P, Kennedy S, et al. Modulation of Cortical-Limbic Pathways in Major Depression: treatment-specific effects of cognitive behavioral therapy. Arch Gen Psych. 2004;61(1):34–41. doi: 10.1001/archpsyc.61.1.34. [DOI] [PubMed] [Google Scholar]
- 41.Hecht D. Depression and the hyperactive right-hemisphere. Neurosci Res. 2010;68(2):77–87. doi: 10.1016/j.neures.2010.06.013. [DOI] [PubMed] [Google Scholar]
- 42.Grimm S, Beck J, Schuepbach D, Hell D, Boesiger P, Bermpohl F, et al. Imbalance between left and right dorsolateral prefrontal cortex in major depression is linked to negative emotional judgment: an fMRI study in severe major depressive disorder. Biol Psychiatry. 2008;63(4):369–76. doi: 10.1016/j.biopsych.2007.05.033. [DOI] [PubMed] [Google Scholar]
- 43.Loo CK, Sachdev P, Martin D, Pigot M, Alonzo A, Malhi GS, et al. A double-blind, sham-controlled trial of transcranial direct current stimulation for the treatment of depression. Int J Neuropsychopharmacol. 2010;13(1):61–9. doi: 10.1017/S1461145709990411. [DOI] [PubMed] [Google Scholar]
- 44.Fitzgerald PB, Hoy K, Daskalakis ZJ, Kulkarni J. A randomized trial of the anti-depressant effects of low- and high-frequency transcranial magnetic stimulation in treatment-resistant depression. Depress Anxiety. 2009;26(3):229–34. doi: 10.1002/da.20454. [DOI] [PubMed] [Google Scholar]
- 45.Bruder GE, Sedoruk JP, Stewart JW, McGrath PJ, Quitkin FM, Tenke CE. Electroencephalographic alpha measures predict therapeutic response to a selective serotonin reuptake inhibitor antidepressant: pre- and post-treatment findings. Biol Psychiatry. 2008;63(12):1171–7. doi: 10.1016/j.biopsych.2007.10.009. [DOI] [PMC free article] [PubMed] [Google Scholar]
- 46.Conway CR, Chibnall JT, Gangwani S, Mintun MA, Price JL, Hershey T, et al. Pretreatment cerebral metabolic activity correlates with antidepressant efficacy of vagus nerve stimulation in treatment-resistant major depression: a potential marker for response? J Affect Disord. 2012;139(3):283–90. doi: 10.1016/j.jad.2012.02.007. [DOI] [PMC free article] [PubMed] [Google Scholar]
- 47.MacNeilage PF, Rogers LJ, Vallortigara G. Origins of the left and right brain. Sci Am. 2009;301(1):60–7. doi: 10.1038/scientificamerican0709-60. [DOI] [PubMed] [Google Scholar]
- 48.Davidson RJ. Well-being and affective style: neural substrates and bio-behavioural correlates. Philos Trans R Soc Lond B Biol Sci. 2004;359(1449):1395–411. doi: 10.1098/rstb.2004.1510. [DOI] [PMC free article] [PubMed] [Google Scholar]
- 49.Heilman KM. Emotional experience: a neurological model. In: Lane RD, Nadel L, editors. Cognitive neuroscience of emotion. New York: Oxford University Press; 2000. pp. 328–44. [Google Scholar]
- 50.Craig AD. Forebrain emotional asymmetry: a neuroanatomical basis? Trends Cogn Sci. 2005;9(12):566–71. doi: 10.1016/j.tics.2005.10.005. [DOI] [PubMed] [Google Scholar]
- 51.Lesser IM, Mena I, Boone KB, Miller BL, Mehringer CM, Wohl M. Reduction of cerebral blood flow in older depressed patients. Arch Gen Psychiatry. 1994;51(9):677–86. doi: 10.1001/archpsyc.1994.03950090009002. [DOI] [PubMed] [Google Scholar]
- 52.Silfverskiöld P, Risberg J. Regional cerebral blood flow in depression and mania. Arch Gen Psychiatry. 1989;46(3):253–9. doi: 10.1001/archpsyc.1989.01810030059008. [DOI] [PubMed] [Google Scholar]
- 53.Sheline YI. 3D MRI studies of neuroanatomic changes in unipolar major depression: the role of stress and medical comorbidity. Biol Psychiatry. 2002;48(8):791–800. doi: 10.1016/s0006-3223(00)00994-x. [DOI] [PubMed] [Google Scholar]
- 54.Mazziotta JC, Phelps ME, Plummer D, Kuhl DE. Quantitation in positron emission computed tomography: 5. physical–anatomical effects. J Comput Assist Tomogr. 1981;5(5):734–43. doi: 10.1097/00004728-198110000-00029. [DOI] [PubMed] [Google Scholar]
Associated Data
This section collects any data citations, data availability statements, or supplementary materials included in this article.