Abstract
The transcription factors c-Myc and N-Myc encoded by Myc and Mycn, respectively, regulate cellular growth1 and are required for embryonic development2,3. A third paralog, Mycl1, is dispensable for normal embryonic development but its normal biologic function has remained unclear4. To examine the in vivo function of Mycl1, we generated an inactivating Mycl1gfp allele that also reports Mycl1 expression. We found that Mycl1 was selectively expressed in dendritic cells (DCs) of the immune system and controlled by IRF8, and that during DC development, Mycl1 expression was initiated in the common DC progenitor5 (CDP) concurrent with reduction in c-Myc expression. Mature DCs lacked expression of c-Myc and N-Myc, but maintained L-Myc expression even in the presence of inflammatory signals, such as GM-CSF. All DC subsets developed in Mycl1-deficient mice, but several DC subsets, such as migratory CD103+ cDCs in the lung and liver, were significantly reduced at steady state. Importantly, loss of L-Myc by DCs caused a significant decrease in the in vivo T-cell priming during infection by Listeria monocytogenes and vesicular stomatitis virus. The replacement of c-Myc by L-Myc in immature DCs may provide for Myc transcriptional activity in the setting of inflammation that is required for optimal T-cell priming6.
c-Myc regulates cellular proliferation, metabolism, and maintenance of progenitor populations7,8 and globally amplifies transcription by direct interactions with RNA polymerases I, II and III, accounting for its regulation of disparate and context-dependent target loci across cell types9-11. Forced expression of L-Myc exerts weaker effects than c-Myc for cell growth, apoptosis and transformation12 but is more efficient in reprogramming fibroblasts toward induced pluripotent stem cells13. However, the in vivo function of L-Myc has not been established4.
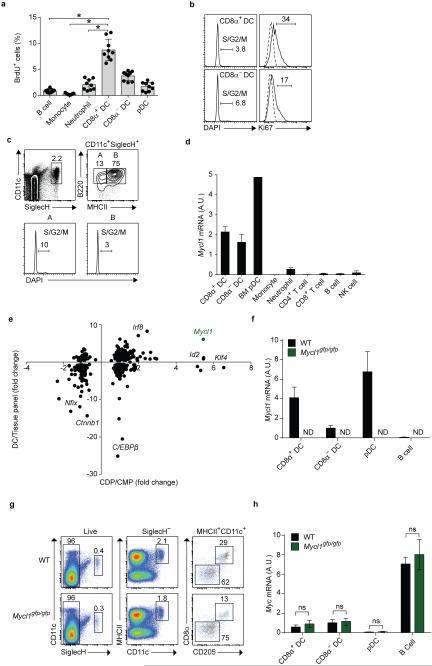
Mature DCs exhibit substantial proliferative activity14,15. In a 4-hour in vivo 5'-bromo-2'-deoxyuridine (BrdU) pulse labeling, B cells, monocytes and neutrophils showed a low rate of ~1% BrdU uptake (Extended Data Fig. 1a), while splenic cDC subsets showed 4-8% BrdU uptake, consistent with previous studies14,15. In agreement, 4-7% of cDCs were in S/G2/M phase by DAPI staining and 17-34% were in cell cycle by Ki67 staining (Extended Data Fig. 1b). Although splenic pDCs had little proliferative capacity, a significant fraction of pDCs in bone marrow (BM) were in S/G2/M phase by DAPI staining (Extended Data Fig 1c).
Extended Data Figure 1. Mycl1 expression within the immune system is restricted to dendritic cells.
a, Shown is the percent of BrdU+ cells within each indicated lineage from WT mice 4 hours after BrdU administration. Data are from 2 independent experiments (bars, SD; n = 9 mice per group, one-way analysis of variance (ANOVA) Tukey's post hoc test). b, Shown are single-color histograms of DAPI and Ki67 expression for indicated cell types from the spleen of WT mice. Dotted lines represent isotype control staining. Numbers represent percent of cells in the indicated gate. Data are representative of 3 independent experiments. c, Shown are two-color histograms of CD11c and SiglecH expression for all live BM cells from WT mice, or B220 and MHCII expression for CD11c+SiglecH+ cells, which were evaluated for DAPI expression (bottom panels). d, Relative Mycl1 mRNA expression was determined by quantitative real-time PCR (qPCR) in pDCs isolated from BM and other indicated cell types isolated from the spleen of WT mice. Shown is a graph of Mycl1 values normalized to Hprt values (bar, SD; n=3 biological replicates per cell type). e, CMP and CDP populations described in Methods Summary were analyzed by gene expression microarray. Shown are transcription factor probe sets with normalized linear expression value in the CDP greater than 100. The horizontal axis indicates the ratio of gene expression in the CMP compared to the CDP, and the vertical axis indicates the ratio of the mean expression in CD8α+ cDCs, CD11b+ cDCs and pDCs compared to a tissue panel excluding DCs (described in Methods). f, Relative Mycl1 mRNA expression was determined by qPCR for indicated mice. Shown is a graph of Mycl1 values normalized to Hprt values (bar, SD; n=3 biological replicates per cell type). g, Splenocytes from WT and Mycl1gfp/gfp mice on the C57BL/6 genetic background were stained for analysis, and pDCs (CD11cintSiglecH+), CD8α+ DCs (CD11c+MHCII+CD8α+CD205+SiglecH−), and CD8α− DCs (CD11c+MHCII+CD8α−CD205-SiglecH−) were identified. Shown are two-color histograms of CD11c and SiglecH expression, MHCII and CD11c expression, and CD8α and CD205 expression for pre-gated cells as indicated above the plots. Numbers represent percent of cells in the indicated gate. Data are representative of at least 5 independent experiments. h, Relative Myc mRNA expression was determined by qPCR for indicated mice. Shown is a graph of Myc values normalized to Hprt values (bar, SD; n=3 biological replicates per cell type, Student's t-test). *, p<0.05; ns, p>0.05; ND, not detected.
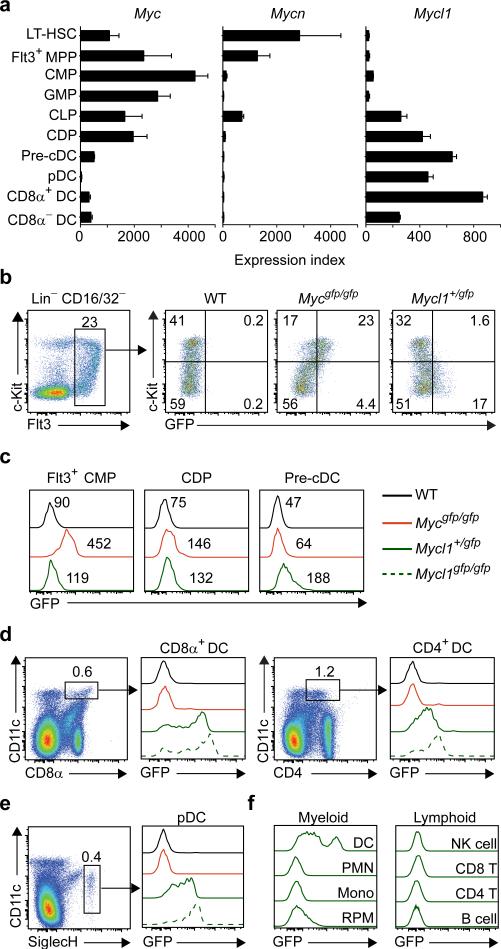
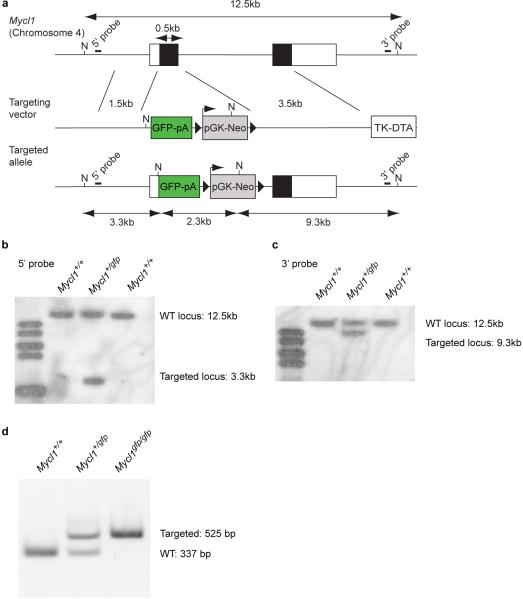
Myc and Mycn were highly expressed in various hematopoietic progenitor populations but were significantly reduced in mature DCs (Fig. 1a). In contrast, Mycl1 was expressed by the CDP, the committed precursors to cDCs5 (pre-cDCs), and by mature splenic DCs (Fig. 1a), but not other hematopoietic lineages8 (Extended Data Fig. 1d,e), indicating that L-Myc expression replaces c-Myc and N-Myc during DC development. We compared c-Myc to L-Myc expression at a single-cell resolution using Mycgfp reporter mice16 encoding a GFP-c-Myc N-terminal fusion protein and a novel L-Myc allele, Mycl1gfp, that substitutes Gfp for the first coding exon (Extended Data Fig. 1f, Extended Data Fig. 2). c-Myc protein was highly expressed in Flt3+ common myeloid progenitors (CMPs), was greatly reduced in CDPs and pre-cDCs (Fig. 1b,c) and undetectable in mature splenic DCs (Fig. 1d,e). In contrast, Mycl1gfp was absent in CMPs, became detectible in CDPs and precDCs (Fig. 1b,c), and was highly expressed in mature splenic CD8α+ cDCs, CD8α− cDCs, and pDCs, but not neutrophils, monocytes, red pulp macrophages, NK cells and T and B cells (Fig. 1d-f), consistent with Mycl1 mRNA expression (Extended Data Fig. 1d).
Figure 1. Dendritic cells selectively express Mycl1 but not Myc or Mycn.
a, Shown are mean values for Myc, Mycn and Mycl1 expression in progenitors and DC subsets as described in the Methods (bars, s.d., n = 2-4 biological replicates). b, c-Kit and GFP expression by Flt3+ Lin-CD16/32− BM cells from WT, Mycgfp/gfp and Mycl1+/gfp mice. c, c-Myc-GFP and L-Myc-GFP expression in the indicated progenitors and mice. Numbers indicate mean fluorescent intensities. d-f, GFP expression for mice in (c) for the indicated cell populations. Data representative of at least 4 experiments (n=10 mice).
Extended Data Figure 2. Generation of Mycl1gfp/gfp mice by homologous recombination.
a, The genomic context for Mycl1, the targeting vector, and targeted allele are shown. NotI restriction digest of the WT locus generates a 12.5 kb fragment detectable by either 5' or 3' probes. NcoI restriction digest of the targeted locus generates a 3.3 kb fragment detected by the 5' probe, a 2.3 kb fragment containing most of the GFP-Neo cassette, and a 9.3 kb fragment detected by the 3' probe. b, c, Southern blot analysis of NcoI-digested total DNA using the 5' probe (b) and 3' probe (c). Shown are results obtained from genomic DNA of WT (Mycl1+/+) and heterozygous (Mycl1+/gfp) mice. d, Genotyping PCR using genomic DNA of WT (Mycl1+/+), heterozygous (Mycl1+/gfp), and homozygous (Mycl1gfp/gfp) mice. The WT allele yields a 337 bp product and the targeted allele yields a 525 bp product.
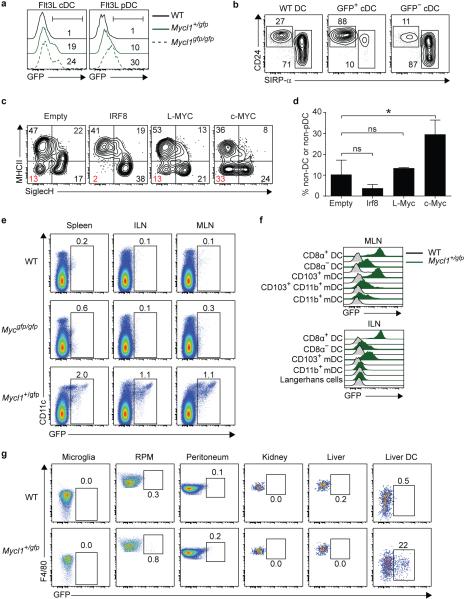
DC subsets that developed in Mycl1gfp/gfp (L-Myc-deficient) mice showed no compensatory induction of Myc expression (Extended Data Fig. 1g, h). Mycl1gfp expression was observed in DCs that developed from Flt3 ligand (Flt3L)-treated BM cultures in vitro (Extended Data Fig. 3a, b). Retroviral overexpression of c-Myc, but not L-Myc, into Flt3+ CMPs reduced the proportion of mature cDCs and pDCs that developed in Flt3-ligand (FLT3L) cultures (Extended Data Fig. 3c, d), suggesting that L-Myc may be non-redundant with c-Myc for DC development.
Extended Data Figure 3. Mycl1 expression is restricted to dendritic cells in lymphoid and non-lymphoid tissues.
a, Shown are single-color histograms of GFP expression for the indicated cells derived from WT, Mycl1+/gfp, and Mycl1gfp/gfp BM cells cultured in FMS-like tyrosine kinase 3 ligand (Flt3L) for 10 days. cDCs (Flt3L cDC) were gated as CD11c+MHCII+SiglecH− and pDCs (Flt3L pDC) were gated as CD11cintSiglecH+. Numbers represent GFP+ cells as a percent of live cells. Data are representative of 3 independent experiments. b, Shown are two-color histograms of CD24 and SIRP-α expression for Flt3L cDCs as described in (a) from BM of WT mice (left panel) and Mycl1+/gfp mice (middle and right panels). Flt3L cDCs from BM of Mycl1+/gfp mice were pre-gated as either GFP+ or GFP−. Numbers represent the percent of cells in the indicated gate. c, Flt3+ CMPs purified by cell sorting from WT BM cells were cultured in Flt3L for 12 hours before transduction with control (Empty) retrovirus or with retrovirus expressing IRF8, L-Myc, or c-Myc. Cells were cultured for an additional 5 days and then stained for analysis. Shown is a two-color histogram of MHCII and SiglecH expression for each indicated transduction. cDCs are gated as MHCII+SiglecH− and pDCs are gated as MHCII−SiglecH+. Numbers represent the percent of cells in the quadrant gate. d, Shown is a quantitation of undifferentiated (non-cDC or non-pDC) cells from (c). Data are from 4 independent transductions per retrovirus (bar, SD; n=4, one-way ANOVA Tukey's post hoc test). e, Cells from the spleen (left panel), inguinal lymph nodes (ILN, middle panel), and mesenteric lymph nodes (MLN, right panel) of WT, Mycgfp/gfp, and Mycl1+/gfp mice were stained for analysis. Shown are two-color histograms of CD11c and GFP expression for non-autofluorescent cells. Numbers represent percent of cells in the indicated gate. Data are representative of at least 5 independent experiments. f, Shown are single-color histograms of GFP expression for resident DCs (CD11c+MHCIIint, DC) and migratory DCs (CD11cintMHCII+, mDC) from mesenteric lymph nodes (MLN, top panel) and inguinal lymph nodes (ILN, bottom panel) of WT (grey lines) and Mycl1+/gfp mice (green lines). Resident DCs were further gated as CD24+SIRP-α− (CD8α+ DC) and CD24−SIRP-α+ (CD8α− DC). MLN mDCs were gated as CD103+CD11b− (CD103+ mDC), CD103+CD11b+ (CD103+CD11b+ mDC), and CD103−CD11b+ (CD11b+ mDC). ILN mDCs were gated as CD103+CD11b− (CD103+ mDC), CD103−CD11b+ (CD11b+ mDC), and CD103−CD11bint/− (Langerhans cells). g, Cells from the brain, spleen, peritoneum, kidney, and liver of WT and Mycl1+/gfp mice were stained for analysis. Shown are two-color histograms of F4/80 and GFP expression for microglia (CD45intCD11b+), splenic red pulp macrophages (F4/80+autofluorescenthigh, RPM), peritoneum macrophages (F4/80+CD11b+), liver and kidney macrophages (F4/80+CD11bint), and liver DCs (CD11c+MHCII+). Live hematopoietic cells were pre-gated in all non-lymphoid tissues as CD45+/int7AAD−. Numbers represent percent of cells in the indicated gate. Data are representative of 2-3 independent experiments(n=4 mice). *, p<0.01; ns, p>0.05.
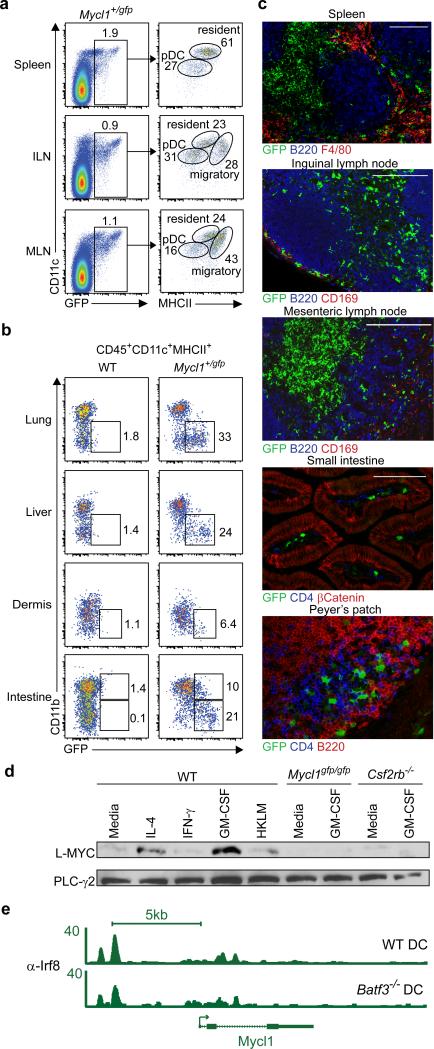
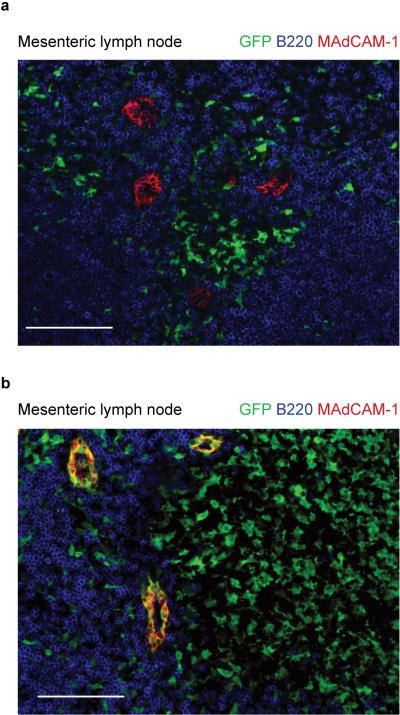
We also compared Mycgfp and Mycl1gfp expression in other tissues. In inguinal and mesenteric lymph nodes, Mycl1gfp, but not Mycgfp, was expressed by pDCs and by migratory and resident cDCs (Fig. 2a, Extended Data Fig. 3e, f). In the lung, liver, and dermis, Mycl1gfp was expressed predominantly by CD11b− cDCs, but, in the small intestine, Mycl1gfp was expressed by CD11b+ and CD11b− cDCs (Fig. 2b). Mycl1gfp was more highly expressed in resident CD8α+ and the migratory CD103+ cDCs than in CD11b+ cDC subsets (Extended Data Fig. 3f) and was absent in macrophages in the peritoneum, kidney and liver (Extended Data Fig. 3g). Mycl1gfp-expressing DCs were abundant in the T-cell zones of spleen and lymph nodes, and less frequent within B cell follicles and the splenic red pulp (Fig. 2c). Sparse Mycl1gfp-expressing DCs were present in the sub-capsular sinus of inguinal lymph nodes where Zbtb46+ cDCs reside17 (Fig. 2c). In addition, Mycl1gfp was expressed by CD4−B220− cells in small intestinal lamina propria, inside villi and within Peyer's patches (Fig. 2c). Mycl1gfp expression was not expressed in vascular endothelium, unlike Zbtb46gfp (Extended Data Fig. 4a, b). Thus, Myclgfp expression identifies DCs in both lymphoid and non-lymphoid peripheral tissues.
Figure 2. Mycl1 is restricted to dendritic cells in lymphoid and peripheral tissues and regulated by IRF8 and GM-CSF.
a, CD11c and MHCII expression is shown for GFP+ cells from spleen, inguinal lymph node (ILN), and mesenteric lymph node (MLN) from Mycl1+/gfp mice (n=5 mice). b, CD11b and GFP expression in CD45+CD11c+MHCII+ cells from indicated tissues of WT and Mycl1+/gfp mice (n=5mice). c, Immunofluorescence for indicated markers from Mycl1+/gfp mice. Scale bars, 200 μM. d, Western analysis for L-MYC and PLC-γ2 from Flt3L-derived DCs from WT, Mycl1gfp/gfp, and Csf2rb−/− mice, treated as indicated for 24 h. e, IRF8 binding in the Mycl1 locus determined by ChIP-Seq in WT or Batf3−/− DCs. Numbers represent normalized reads. Data representative of at least 3 experiments.
Extended Data Figure 4. Mycl1 expression is restricted to dendritic cells.
Mesenteric lymph nodes from Mycl1+/gfp (a) and Zbtb46+/gfp (b) mice were analyzed for expression of B220 (blue), MAdCAM-1 (red) and GFP (green). Scale bar, 100 μm (Mesenteric lymph node).
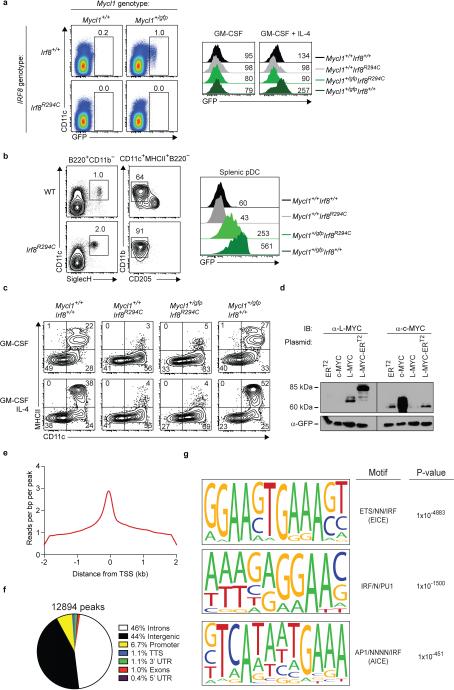
Mycl1 expression by CMPs was reported to be IRF8-dependent18. In mice homozygous for the Irf8R294C point mutation19 that interrupts IRF8-PU.1 interactions, Mycl1gfp expression was absent in DC progenitors and substantially reduced in pDCs (Extended Data Fig. 5a,b). Moreover, Mycl1gfp was expressed in DCs differentiated from WT, but not Irf8R294C, Ly6Chi monocytes using IL-4 and GM-CSF17,20 (Extended Data Fig. 5a,c). L-Myc protein was maintained in cDCs under various inflammatory conditions including treatment with IFN-β or IFN-γ and increased by treatment with GM-CSF (Fig. 2d, Extended Data Fig. 5d). ChIP-Seq analysis identified several IRF8 binding regions across the Mycl1 that did not require the transcription factor BATF3 (ref 21) (Fig. 2e, Extended Data Fig. 5e-g). Together, these results support a role for IRF8–PU.1 interactions in Mycl1 expression.
Extended Data Figure 5. IRF8 regulates the expression of Mycl1 in multiple dendritic cell lineages.
a, (left panels) BM cells and splenocytes from Mycl1+/+Irf8+/+, Mycl1+/gfpIrf8+/+, Mycl1+/+Irf8R294C, and Mycl1+/gfpIrf8R294C mice were stained for analysis. Shown are two-color histograms of GFP and CD11c expression. Numbers represent the percent of cells in the indicate gates. Data are representative of 3 independent experiments. (right panels) Ly6C+CD11b+ BM monocytes were isolated by cell sorting from Mycl1+/+Irf8+/+(black line), Mycl1+/+Irf8R294C(grey line), Mycl1+/gfpIrf8R294C(light green line), Mycl1+/gfpIrf8+/+mice (dark green line) and differentiated for 4 days either with GM-CSF (left panel) or with GM-CSF and IL-4 (right panel). Shown are single-color histograms of GFP expression for pre-gated live CD11c+ cells from the indicated genotypes. b, Splenocytes from WT (top panels) and Irf8R294C (bottom panels) mice on the C57BL/6 genetic background were stained for analysis. Shown are two-color histograms of CD11c and SiglecH expression (left panels), and CD11b and CD205 expression (right panels), for cells pre-gated as either B220+CD11b− or CD11c+MHCII+B220−. pDCs were gated as CD11c+SiglecH+B220+CD11b−. Numbers represent the percent of cells in the indicated gates. Data are representative of 2 independent experiments. c, Ly6C+ BM monocytes were isolated by cell sorting from Mycl1+/+Irf8+/+, Mycl1+/+Irf8R294C, Mycl1+/gfpIrf8R294C, and Mycl1+/gfpIrf8+/+ mice. Monocytes were cultured either with GM-CSF or with GM-CSF and IL-4 for 4 days and then stained for analysis. Shown are two-color histograms of MHCII and CD11c expression for differentiated monocytes. Numbers represent the percent of cells in the quadrant gate. Data are representative of 2 independent experiments. d, Phoenix-E cells were transfected with murine stem cell virus (MSCV) retroviral plasmids expressing the mutant human estrogen receptor (ERT2), murine Myc (c-MYC), murine Mycl1 (L-MYC), and a fusion between Mycl1 and the mutant human estrogen receptor (L-MYC-ERT2). Whole-cell extracts were prepared 2 days after transfection and Western blot analysis was performed. Shown are blots probed for L-MYC (left, α-L-MYC) and c-MYC (right, α-c-MYC) for the indicated transfections. Blots were stripped and re-probed for GFP (bottom, α-GFP). e, IRF8 DNA binding was assayed by ChIP-Seq. Shown is a histogram of normalized reads per bp per peak within a 4-kb window centered on transcriptional start sites (TSS). f, Uniquely mapped IRF8 ChIP-Seq reads were evaluated for peak discovery by Model-based Analysis of ChIP-Seq (MACS) as described in Methods and peaks were annotated by the Homer software package using default annotation settings. Shown is the distribution of peak annotations within introns, intergenic regions, promoters, transcription termination sites (TTS), 3'-untranslated regions (3'UTR), exons, and 5'-untranslated regions (5'UTR). Numbers represent the percent of annotations in each category. g, Peaks identified in (f) were evaluated for de novo motif discovery using the Homer software package as described in Methods. Analysis was performed 3 separate times to identify the most significant motifs. Shown are the top 3 DNA motifs conserved in IRF8-bound loci along with the closest known motif and associated p-value (cumulative binomial distribution).
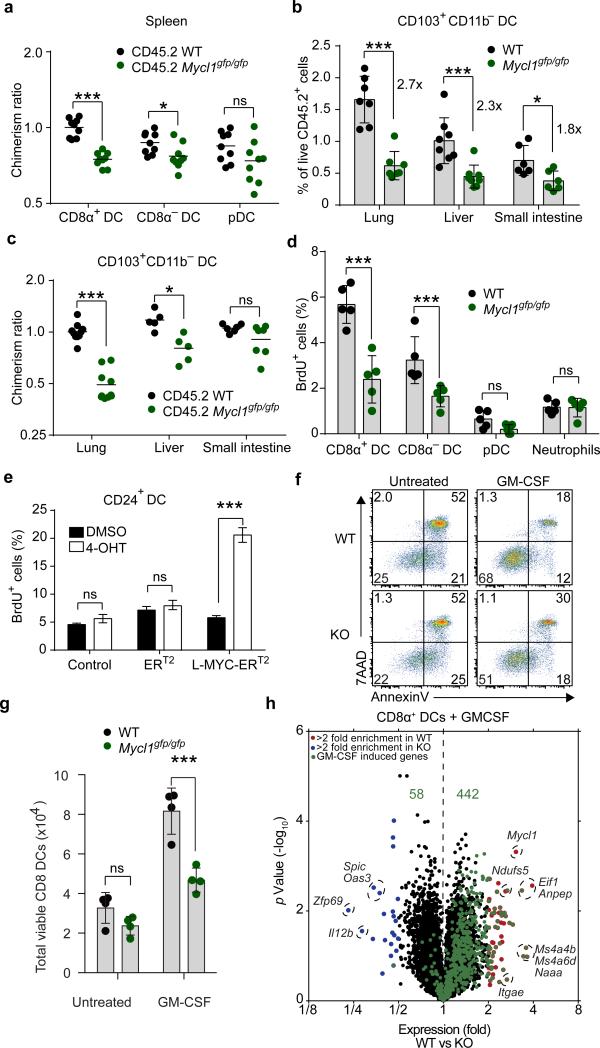
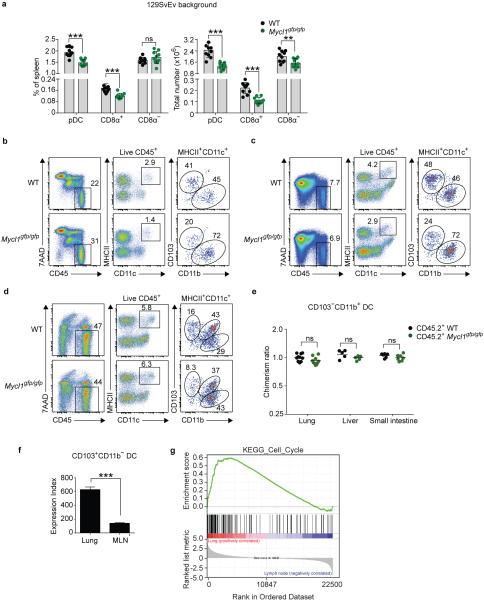
In lymphoid and peripheral tissues, absence of L-Myc decreased the total number and relative frequency of DCs, which competitive mixed BM chimeras suggest is due to a cell-intrinsic defect (Fig. 3a-c, Extended Data Fig. 6). The largest reduction was to the CD103+CD11b− cDCs in the lung, an organ rich in GM-CSF22. Gene Set Enrichment Analysis (GSEA) also revealed significant enrichment of cell-cycle–related transcripts in lung CD103+CD11b− cDCs as compared to migratory CD103+CD11b− cDCs in draining lymph nodes (Extended Data Fig. 6f,g). Thus, variations in the abundance of cell-extrinsic factors such as GM-CSF in the local tissue microenvironment result in different homeostatic requirements for DCs that are revealed by the loss of L-Myc.
Figure 3. Mycl1 regulates DC proliferation and survival.
a, Normalized donor contribution for indicated DC subsets in mixed BM chimeras. (bar, s.d., n=9 mice). b, CD103+CD11b− DCs from tissues from the indicated mice as percentage of CD45.2+ cells. (bar, s.d., n=5-7 mice). c, Donor contribution of CD103+CD11b− DCs as in (a) shown for indicated tissues. d, 1 hour BrdU incorporation for indicated cells and mice. (bar, s.d., n = 5). e, BrdU incorporation of CD24+ cDCs expressing ERT2 or L-MYC-ERT2 fusion proteins in response to tamoxifen (4-OHT) treatment (bar, s.d., n=4). f, 7AAD/AnnexinV staining of splenic CD8α+ DCs from WT or Mycl1gpf/gfp (KO) mice treated with GM-CSF. g, Viable splenic CD8α+ DCs from (f) for WT or Mycl1gpf/gfp (KO) mice (bar, s.d, n=4). h, Volcano plot of WT and Mycl1gpf/gfp (KO) CD8α+ DCs treated with or without GM-CSF. Shown are genes increased >2-fold (red) or decreased >2-fold (blue) in WT relative to Mycl1gpf/gfp (KO) mice. Top 500 genes induced in WT cells by following GM-CSF treatment are shown (green). (n=3 biological replicates). *, p<0.05, ***, p<0.001, ns, p>0.05. Data representative of 2-3 experiments.
Extended Data Figure 6. Mycl1 regulates the homeostasis of CD8α+ DCs and peripheral tissue CD103+ DCs.
a, Splenic DC subsets as gated in (Extended Data Fig. 1e) were quantitated from WT (black dots) and Mycl1gfp/gfp (green dots) mice on the 129SvEv genetic background. Shown are graphs of total cell number per spleen for the indicated DC subsets (right panels) and of each DC subset as a percent of all splenocytes (left panels). Data are from 3 independent experiments (bar, SD: n=10 biological replicates, Student's t-test). b, c, d, Cells from the liver (b), lung (c), and small intestine (d) of WT and Mycl1gfp/gfp mice on the C57BL/6 genetic background were stained for analysis. Shown are two-color histograms of 7AAD and CD45 expression, MHCII and CD11c expression, and CD103 and CD11b expression. Hematopoietic cells were gated as 7AAD−CD45+ (Live CD45+) and DCs were gated as MHCII+CD11c+. e, Cells from the lung, liver and small intestine of mixed BM chimeras described in (Fig. 3a, c) were analyzed for relative donor contribution. Shown is the contribution of CD45.2+ WT BM or CD45.2+ Mycl1gpf/gfp BM to CD103−CD11b+ DCs in the indicated peripheral tissues as a ratio of peripheral blood neutrophils from the same animal. Data are representative of 3 independent experiments (bar, SD; n=5-10 mice, Mann-Whitney U test). f, Shown is relative Mycl1 mRNA expression determined by gene expression microarrays of lung-resident CD103+CD11b− DCs and of migratory CD103+CD11b− DCs from mediastinal lymph nodes (MLN) (bar, SD; n=3 biological replicate arrays, Student's t-test). g, Differences in microarray-based gene expression data between lung-resident CD103+CD11b− DCs (Lung, red) and migratory CD103+CD11b− DCs (Lymph node, blue) were analyzed for enrichment of a set of cell cycle genes (KEGG_Cell_Cycle) by Gene Set Enrichment Analysis (GSEA). Shown is a GSEA plot of running enrichment score (top), gene set member ranks (middle), and ranked list metric values (bottom) (signal-to-noise metric, n=3 biological replicate arrays per group). **, p<0.01, ***, p<0.001; ns, p>0.05.
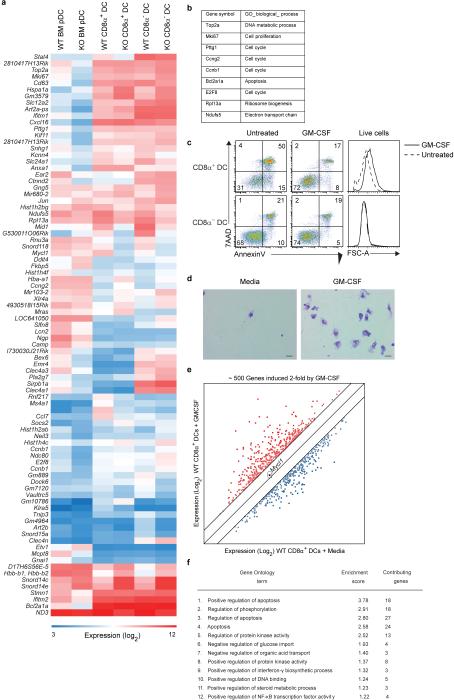
Analysis of gene expression microarrays from WT and L-Myc-deficient pDCs, CD8α+ cDCs, and CD8α− cDCs identified a few presumed L-Myc target genes associated with cellular proliferation and apoptosis (Extended Data Figs. 7a,b). In agreement, splenic CD8α+ cDCs from L-Myc-deficient mice showed a 50% reduction in in vivo BrdU incorporation relative to WT mice (Fig. 3d). Also, a tamoxifen-activated L-Myc (L-MYC-ERT2 fusion protein) markedly and specifically increased proliferation of CD8α+ cDCs (Fig. 3e), suggesting L-Myc can regulate DC proliferation. GM-CSF, a cytokine known to regulate DC homeostasis, increased CD8α+ cDC cell size and expression of >500 genes, including many involved in regulation of apoptosis (Extended Data 7c-f). Notably, the ability of GM-CSF to increase CD8α+ cDCs survival was impaired in the absence of L-Myc (Fig. 3f,g). Genes that appear to be targets of L-Myc in CD8α+ cDCs include eukaryotic translation initiation factor 1 (Eif1) and NADH dehydrogenase (ubiquinone) Fe-S protein 5 (Ndufs5) which could impact global protein translation and energy metabolism. Furthermore, of the 500 genes induced by GM-CSF treatment in WT DCs (Extended Data Fig. 7e), 442 are reduced in expression in L-Myc-deficient CD8α+ cDCs (Fig. 3h), suggesting that the absence L-Myc broadly limits inducible genes expressed in activated CD8α+ cDCs.
Extended Data Figure 7. GM-CSF treatment and L-Myc deficiency in bone marrow pDCs, splenic CD8α+ DCs and CD8α− DCs.
a, Shown is a Venn diagram of probe sets changed at least 2-fold in expression between the indicated WT and L-Myc-deficient DC populations on gene expression microarray analysis. Indicated in each zone of the diagram is the number of probe sets. b, Shown are gene symbols and Gene Ontology (GO) biological process annotations for selected growth-related genes obtained from the analysis in (a). c, CD8α+ DCs (CD11c+MHCII+CD24+SIRPα−B220−) and CD8α− DCs (CD11c+MHCII+SIRPα+CD24−B220−) were purified by cell sorting from the spleen of WT mice and cultured with media alone (Untreated) or with GM-CSF as indicated. After 24 h, cells were analyzed for viability. Shown are two-color histograms of 7AAD and AnnexinV expression. Numbers indicate the percent of cells in each quadrant gate. Also shown are single-color histograms of forward scatter (FSC-A) for live cells (AnnexinV−7AAD−) to determine relative size for the indicated treatments. Data are representative of 3 independent experiments. d, Shown are Wright-Giemsa stains of cytospins prepared from CD8α+ DCs described in (c). Scale bars represent 20 μm. e, Gene expression microarray analysis was performed using CD8α+ DCs described in (c). Shown is an M-plot of log2-transformed normalized expression values for probe sets either increased (red) or decreased (blue) at least 2-fold in expression on treatment with GM-CSF, omitting probe sets lacking gene annotations. f, Functional annotations for 500 probe sets most induced by GM-CSF treatment (e, red) were clustered using the highest classification stringency by DAVID Bioinformatics Resources. Shown are the associated GO term, enrichment score, and number of contributing genes for the top 12-enriched clusters.
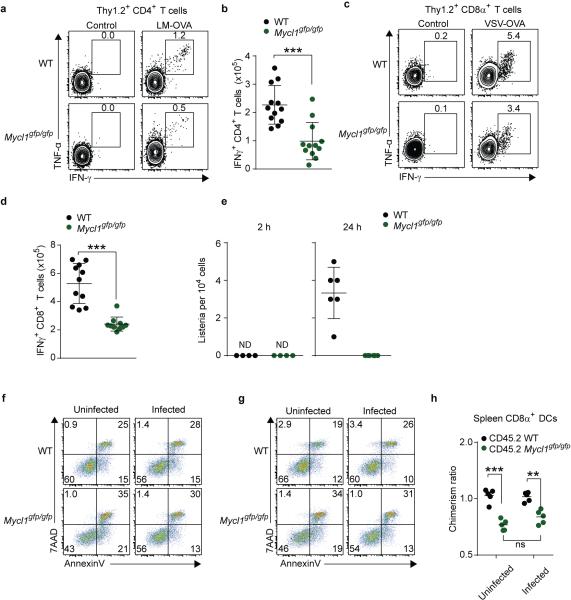
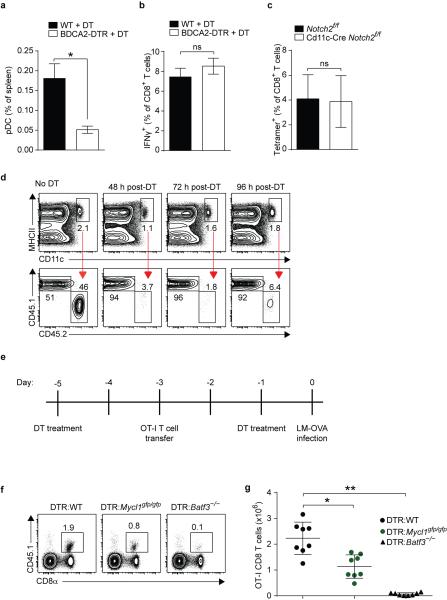
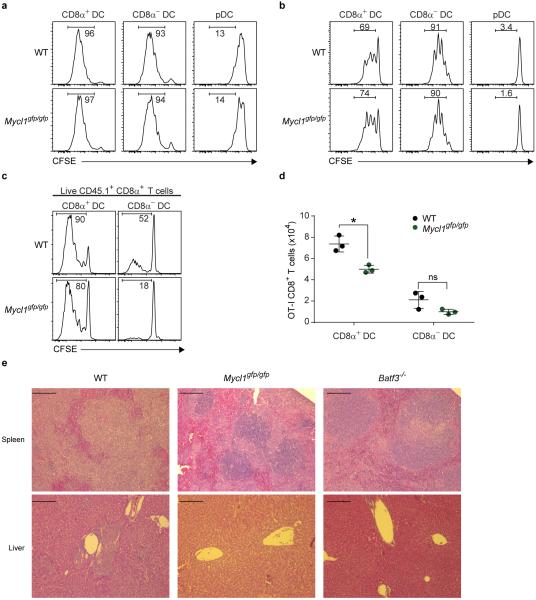
Finally, we assessed whether L-Myc expression was required for T cell priming and other functions attributed to DCs23,24. We measured antigen-specific CD8+ and CD4+ T cell responses after infection with L. monocytogenes expressing soluble ovalbumin (LM-OVA). Loss of L-Myc significantly decreased the total number of IFN-γ-producing OVA-specific CD8+ and CD4+ T cells (Fig. 4a,b, Extended Data Fig. 8a,b). To demonstrate that these effects were not the result of a requirement for L-Myc in T cells, we adoptively transferred congenically marked L-Myc-sufficient OT-I CD8+ T cells into WT and L-Myc-deficient mice. After infection with LM-OVA, OT-I CD8+ T cell expansion was dramatically reduced in L-Myc-deficient mice as compared to WT mice (Fig. 4c,d). L-Myc-deficient mice also showed impaired CD8+ T cell priming after infection with vesicular stomatitis virus expressing ovalbumin (VSV-OVA) (Extended Data Fig. 8c,d). These priming defects were attributable to the action of L-Myc in CD8α+ cDCs, as depletion of pDCs25 or Notch2-dependent CD11b+ cDCs26,27 had no impact on CD8+ T cell priming after infection with LM-OVA (Extended Data Fig. 9a-c). Further, the defect did not appear to involve processing and presentation of soluble antigen (Extended Data Fig. 10a,b). Mixed chimera analysis using Zbtb46-DTR mice26 indicated that priming defect is intrinsic to cDCs (Extended Data 9d-g).
Figure 4. Mycl1 supports normal T cell priming by DCs following infection but mediates resistance to lethal Listeria monocytogenes challenge.
a-b, CD8+ T cells from wild type (WT) and Mycl1gfp/gfp (KO) mice infected with LM-OVA treated with SIINFEKL were analyzed for TNF-α and IFN-γ production (a). Data (a-b) are from 2 independent experiments (bar, s.d., n=12). c, CD45.1 OT-I T cells transferred into the indicated mice and infected with LM-OVA were measured after 7 days. Numbers are OT-I T cells as a percent of all splenocytes. d, Total OT-I CD8+ T cells were measured from the indicated recipient mice after infection as described in (c). (bar, s.d., n=8). e, Survival of WT and Myclgfp/gfp (KO) mice after infection with L. monocytogenes. (bar, s.d., n=15). f, L. monocytogenes was measured in purified CD8α+ DCs after 2 h or 24 h of infection from (e) as described52. g, Splenic CD8α+ DCs from mice infected for 2 h were cultured in vitro in media with the indicated antibiotic for 12 h and viable intracellular bacteria quantitated as described52. (bar, s.d., n=4). h, Viable intracellular bacteria was measured as in (g) from the indicated cells from WT and Mycl1gfp/gfp (KO) mice infected with L. monocytogenes for 60 h. (bar, s.d., n=3). **, p<0.001, ns, p>0.05.
Extended Data Figure 8. Mycl1 is necessary for normal T cell priming by dendritic cells during infection.
a, WT mice (top panels) and Mycl1gfp/gfp mice (bottom panels) were infected intravenously with 3×10³ LM-OVA. Splenocytes were harvested 7 days after infection, re-stimulated with LLO190-201 peptide in vitro for 5 hours, and stained for analysis. Splenocytes from uninfected mice (control, left panel) served as a staining control. Shown are two-color histograms of TNF-α and IFN-β expression for cells pre-gated as Thy1.2+CD4+. Numbers represent the percent of cells in the indicated gate. Data are from 2 independent experiments. b, Shown is the total number of IFN-γ+ CD4+ T cells per spleen from the experiment described in (a). Data are from 2 independent experiments (bar, SD; n=12 biological replicates, Student's t-test). c, WT mice (top panels) or Mycl1gfp/gfp mice (bottom panels) were infected intravenously with 5×10⁶ pfu VSVOVA. Splenocytes were harvested 7 days after infection, re-stimulated with SIINFEKL peptide in vitro for 5 hours, and stained for analysis. Splenocytes from uninfected mice (control, left panel) served as a staining control. Shown are two-color histograms of TNF-α and IFN-γ expression for cells pre-gated gated as Thy1.2+CD8α+. Numbers represent the percent of cells in the indicated gate. Data are representative of 2 independent experiments. d, Shown is the total number of IFN-γ+ CD8+ T cells per spleen from the experiment described in (d). Data are from 2 independent experiments (bar, SD; n=11 biological replicates, Student's t-test). e, WT mice (black dots) and Mycl1gfp/gfp mice (green dots) were infected as described in (Fig. 4f) and CD8α− DCs (CD11c+MHCII+SIRPα+CD24−B220−) were purified by cell sorting. Shown is the amount of viable intracellular bacteria determined for the indicated time points. Data are from 2 independent experiments (bar, SD; n = 4-6 biological replicates). f, g, CD8α+ DCs purified from infected mice described in (Fig. 4f) were cultured for 12 h in media containing either gentamicin (f) or penicillin/streptomycin (g). CD8α+ DCs purified from uninfected mice were used as controls (uninfected, left panels). Cells were assessed for viability as in (Fig. 3f). Shown are two-color histograms of 7AAD and AnnexinV for the indicated conditions. Data are representative of 2 independent experiments. h, Mixed BM chimeras described in (Fig. 3a, c) were infected intravenously with 5×10⁷ LM-EGD and splenocytes were analyzed for relative donor chimerism after 24 h. Uninfected chimeras served as controls. Shown is the contribution of CD45.2+ WT BM or CD45.2+ Mycl1gpf/gfp BM to splenic CD8α+ DCs as a ratio of peripheral blood neutrophils from the same animal (bar, SD; n=5, Mann-Whitney U test). *, p<0.05; **, p<0.01; ***, p<0.001; ns, p>0.05; ND, not detected.
Extended Data Figure 9. Mycl1 expression in CD8α+ DCs is necessary for normal T cell priming.
a, WT mice (black box) and BDCA2-DTR transgenic mice (open box) were treated with 125 ng diphtheria toxin (DT) per mouse 1 day before infection with 3×10³ LM-OVA. DT treatment was continued on days 1, 3, and 5 after infection, and splenocytes harvested on day 7 were stained for analysis. Shown is the quantitation of pDCs as a percent of all splenocytes to confirm efficiency of deletion (bar, SD; n=4 biological replicates per group, Student's t-test). b, Splenocytes described in (a) were re-stimulated with SIINFEKL peptide in vitro for 5 h. Shown is the quantitation of IFN-γ+ cells as a percent of CD8+ T cells (gated as Thy1.2+ CD8α+) (bar, SD; n=4 biological replicates, Student's t-test). c, Peripheral blood from Notch2f/f mice (black box) and Cd11c-Cre Notch2f/f mice (open box) was collected on day 7 after infection with 3×10³ LM-OVA. After red blood cell lysis, CD8+ T cells were stained with H-2Kb-SIINFEKL tetramer. Shown is the frequency of tetramer+ cells as a percent of CD8+ T cells (bar, SD; n=4 biological replicates, Student's t-test). d, BM from CD45.1+ WT mice and BM from CD45.2+ Zbtb46dtr/dtr mice were mixed in a 50:50 ratio and injected into lethally irradiated WT recipient mice. Ten weeks after transplant, 400 ng DT was administered to each chimeric mouse and splenocytes harvested at 48 h, 72 h and 96 h after DT treatment were stained for analysis. Shown are two-color histograms of CD45.1 and CD45.2 expression for pre-gated DCs (CD11c+MHCII+, top panels) to determine relative donor chimerism and efficiency of deletion. e, Shown is an experimental outline for LM-OVA infection of BM chimeras following DC depletion and replenishment. f, BM chimeras were generated using a 50:50 ratio of Zbtb46dtr/dtr BM and WT BM (DTR:WT), or of Zbtb46dtr/dtr BM and Mycl1gfp/gfp BM (DTR:Mycl1gfp/gfp), or of Zbtb46dtr/dtr BM and Batf3−/− BM (DTR: Batf3−/−). Twelve weeks after lethal irradiation and transplant, BM chimeras were infected according to the time course outlined in (e). Expansion of donor CD45.1+ OT-I CD8+ T cells was evaluated 7 days after infection with 300 LM-OVA. g, Shown is the total number of OT-I CD8+ T cells from infected DTR:WT, DTR:Mycl1gfp/gfp , and DTR:Batf3−/− chimeric mice described in (e, f). Data are from 2 independent experiments (bar, SD; n=8 infected biological replicates, one-way ANOVA Tukey's post hoc test). *, p<0.05; **, p<0.01; ns, p>0.05.
Extended Data Figure 10. L-Myc-deficient dendritic cells process and present soluble antigens efficiently.
a, b, CD8α+ DCs, CD8α− DCs, and pDCs were isolated by cell sorting from the spleen of WT mice (top panels) and Mycl1gfp/gfp mice (bottom panels). OT-I CD8+ T cells and OT-II CD4+ T cells were isolated by cell sorting from the spleen of CD45.1+ OT-I transgenic and CD45.1+ OT-II transgenic mice, respectively, and T cells were then labeled with CFSE. DCs were pulsed with whole ovalbumin protein (Ova) for 2 h at 37°C, then washed extensively before co-culture with OT-I CD8+ T cells (a) or OT-II CD4+ T cells (b) at a DC:T cell ratio of 1:5. Ova257-264 (OT-I CD8+ T cell epitope) and Ova323-339 (OT-II CD4+ T cell epitope) were used as positive controls (panels not shown). Cells were analyzed 3 days later for CFSE dilution. Shown are single-color histograms of CFSE for pre-gated live T cells. Data are representative of 2 independent experiments. c, WT mice (black dots) and Mycl1gfp/gfp mice (green dots) were infected with 105 L. monocytogenes expressing ovalbumin (LM-OVA). After 24 h, CD8α+ DCs and CD8α− DCs were purified from infected spleens and co-cultured with CFSE-labeled OT-I CD45.1+ CD8+ T cells. Cells were analyzed 60 h later for CFSE dilution. Shown are single-color histograms of CFSE for live OT-I T cells gated as CD45.1+CD8α+. d, Shown is the quantitation (described in Methods) of live OT-I CD8+ T cells from (c) after co-culture with the indicated DCs from WT (black dots) and Mycl1gfp/gfp (green dots). Data are from 2 independent experiments (bar, SD; n = 3 biological replicates, Student's t-test). e, Histopathology (H&E) of spleens (top panels) and livers (bottom panels) from WT (left panels), Mycl1gfp/gfp (middle panels), and Batf3−/− (right panels) mice 3 days after infection (105 L. monocytogenes i.v.). Scale bars 200 μm. *, p<0.01; ns, p>0.05.
We recently showed that CD8α+ cDCs are required for L. monocytogenes to establish infection in mice via the intravenous route, since Batf3−/− mice lacking these cells are entirely resistant to lethal infection28. Further, for the first 24 h after infection, bacteria grow entirely within CD8α+ cDCs29, which are the initial reservoir for bacterial expansion. Since L-Myc is most highly expressed in the CD8α+ cDCs in spleen, we asked whether L-Myc deficiency might influence infection by L. monocytogenes. L-Myc-deficient mice were remarkably resistant to lethal infection by L. monocytogenes relative to WT mice (Fig. 4e). This resistance was caused by significant reduction in the intracellular growth of bacteria within L-Myc-deficient CD8α+ cDCs, and not due to reduced bacterial capture or DC viability during the first 24 h of infection (Fig. 4f, Extended Data Fig. 8e-h). This reduced growth of L. monocytogenes is cell-intrinsic to CD8α+ cDCs (Fig. 4g) and is sufficient to prevent the subsequent spread of bacteria to other lineages (Fig. 4h, Extended Data Fig. 10e).
The functional relationship of L-Myc to other Myc factors has remained uncertain4. We show that L-Myc is selectively expressed in DCs, maintained during inflammation, and required by cDCs for optimal priming of T cells in bacterial and viral infection. Since c-Myc is repressed by interferons30, and inducible genes can depend on c-Myc, L-Myc provide a means to support transcriptional responses, for example by GM-CSF, required during T cell priming by cDCs.
Methods Summary
Mice
Wild-type (WT) 129S6/SvEv mice were from Taconic. WT C57BL/6 mice, Csf2rb−/− mice and the congenic strain B6.SJL-Ptprca Pepcb/BoyJ (B6.SJL) were from The Jackson Laboratory. Mice were maintained in our specific pathogen-free animal facility according to institutional guidelines. Generation of c-Mycgfp/gfp, Zbtb46DTR/DTR, and Irf8R294C mice were described16,19,26. Irf8R294C mice were backcrossed to C57BL/6 for 11 generations. Experiments used sex- and age-matched mice at 6-16 weeks of age. All pathogen infections were performed on mice of the 129S6/SvEv genetic background unless indicated.
Myc, Mycn and Mycl1 expression in Fig. 1a was determined by microarrays for the long-term hematopoietic stem cell (LT-HSC), Flt3+ multi-potent progenitor (Flt3+ MPP), common myeloid progenitor (CMP), granulocyte-macrophage progenitor (GMP), common lymphoid progenitor (CLP), common dendritic cell progenitor (CDP), bone marrow (BM) pre-cDC (PrecDC), splenic pDC, splenic CD8α+ DC and splenic CD8α− DC. In Fig. 1b, Lineage markers included Ter119, NK1.1, B220, MHCII, CD3, and CD11b. For Fig. 1c, CMP were Lin−CD16/32-Flt3+cKit+, CDP were Lin−CD16/32−Flt3+cKitint/−CD115+, and pre-cDC were Lin−CD16/32-Flt3+cKit−CD11c+. For Fig. 1d-f, gating is as follows; DCs, CD11c+MHCII+; neutrophils (PMN), Ly6G+CD11b+; monocytes (Mono), Ly6C+CD11b+Ly6G−; red pulp macrophages (RPM), autofluorescent F4/80+; NK cells NK1.1+CD3ε−; CD8 T cells (CD8 T) CD3ε+CD8α+CD4−; CD4 T cells (CD4 T), CD3ε+CD4+CD8α−; and B cells, CD19+B220+SiglecH−. In Fig. 2, pDCs were gated as CD11cintMHCIIint/− cells; resident DC as CD11c+MHCIIint cells; and migratory DCs as CD11cintMHCII+ cells. In Fig. 2c, tissues were stained spleen, B220 (blue); F4/80 (red); GFP (green); lymph node B220 (blue), CD169 (red) and GFP (green); small intestine CD4 (blue), β-catenin (red) and GFP (green); Peyer's patch CD4 (blue), B220 (red) and GFP (green). In Fig. 2d, BM cells were cultured for 9 days with Flt3 ligand, treated with media, interleukin 4 (IL-4), interferon gamma (IFN-γ), granulocyte-macrophage colony-stimulating factor (GM-CSF), and heat-killed Listeria monocytogenes EGD (HKLM) for 24 hours.
Acknowledgments
Supported by the Howard Hughes Medical Institute and the Siteman Cancer Center (K.M.M.), American Heart Association (12PRE8610005 to A.T.S and 12PRE12050419 to W.K), German Research Foundation (AL 1038/1-1) (J.C.A.), American Society of Hematology Scholar Award and Burroughs Welcome Fund Career Award for Medical Scientists (B.T.E.). We thank J. Michael White for blastocyst injections and generation of mouse chimeras, the Alvin J. Siteman Cancer Center at Washington University School of Medicine for use of the Center for Biomedical Informatics and Multiplex Gene Analysis Genechip Core Facility. The Siteman Cancer Center is supported in part by the NCI Cancer Center Support Grant P30 CA91842.
Footnotes
Author Contributions
W.K., T.M.M. and K.M.M. directed the work and wrote the manuscript. A.S.R., M.C. and M.C. helped with VSV infections. B.P.S. provided mice expressing GFP-c-Myc. J.L. and M.C.N. provided Zbtb46dtr/dtr mice. A.T.S and J.C.A. aided gene targeting and analysis of DC populations. C.G.B., X.W., B.T.E., N.M.K., and E.V.R. aided analysis of infections and histological analysis. X.W. aided microarray analysis. All authors discussed the results and contributed to the manuscript.
The authors have no conflicting financial interests.
References
- 1.Dang CV. MYC on the path to cancer. Cell. 2012;149:22–35. doi: 10.1016/j.cell.2012.03.003. [DOI] [PMC free article] [PubMed] [Google Scholar]
- 2.Charron J, et al. Embryonic lethality in mice homozygous for a targeted disruption of the N-myc gene. Genes Dev. 1992;6:2248–2257. doi: 10.1101/gad.6.12a.2248. [DOI] [PubMed] [Google Scholar]
- 3.Davis AC, Wims M, Spotts GD, Hann SR, Bradley A. A null c-myc mutation causes lethality before 10.5 days of gestation in homozygotes and reduced fertility in heterozygous female mice. Genes Dev. 1993;7:671–682. doi: 10.1101/gad.7.4.671. [DOI] [PubMed] [Google Scholar]
- 4.Hatton KS, et al. Expression and activity of L-Myc in normal mouse development. Mol. Cell Biol. 1996;16:1794–1804. doi: 10.1128/mcb.16.4.1794. [DOI] [PMC free article] [PubMed] [Google Scholar]
- 5.Liu K, et al. In vivo analysis of dendritic cell development and homeostasis. Science. 2009;324:392–397. doi: 10.1126/science.1170540. [DOI] [PMC free article] [PubMed] [Google Scholar]
- 6.Lauvau G, et al. Priming of memory but not effector CD8 T cells by a killed bacterial vaccine. Science. 2001;294:1735–1739. doi: 10.1126/science.1064571. [DOI] [PubMed] [Google Scholar]
- 7.Wang R, et al. The transcription factor Myc controls metabolic reprogramming upon T lymphocyte activation. Immunity. 2011;35:871–882. doi: 10.1016/j.immuni.2011.09.021. [DOI] [PMC free article] [PubMed] [Google Scholar]
- 8.Laurenti E, et al. Hematopoietic stem cell function and survival depend on c-Myc and N Myc activity. Cell Stem Cell. 2008;3:611–624. doi: 10.1016/j.stem.2008.09.005. [DOI] [PMC free article] [PubMed] [Google Scholar]
- 9.Rahl PB, et al. c-Myc regulates transcriptional pause release. Cell. 2010;141:432–445. doi: 10.1016/j.cell.2010.03.030. [DOI] [PMC free article] [PubMed] [Google Scholar]
- 10.Lin CY, et al. Transcriptional amplification in tumor cells with elevated c-Myc. Cell. 2012;151:56–67. doi: 10.1016/j.cell.2012.08.026. [DOI] [PMC free article] [PubMed] [Google Scholar]
- 11.Nie Z, et al. c-Myc is a universal amplifier of expressed genes in lymphocytes and embryonic stem cells. Cell. 2012;151:68–79. doi: 10.1016/j.cell.2012.08.033. [DOI] [PMC free article] [PubMed] [Google Scholar]
- 12.Wasylishen AR, et al. New model systems provide insights into Myc-induced transformation. Oncogene. 2011;30:3727–3734. doi: 10.1038/onc.2011.88. [DOI] [PMC free article] [PubMed] [Google Scholar]
- 13.Nakagawa M, Takizawa N, Narita M, Ichisaka T, Yamanaka S. Promotion of direct reprogramming by transformation-deficient Myc. Proc. Natl. Acad. Sci. U. S A. 2010;107:14152–14157. doi: 10.1073/pnas.1009374107. [DOI] [PMC free article] [PubMed] [Google Scholar]
- 14.Kabashima K, et al. Intrinsic lymphotoxin-beta receptor requirement for homeostasis of lymphoid tissue dendritic cells. Immunity. 2005;22:439–450. doi: 10.1016/j.immuni.2005.02.007. [DOI] [PubMed] [Google Scholar]
- 15.Liu K, et al. Origin of dendritic cells in peripheral lymphoid organs of mice. Nat Immunol. 2007;8:578–583. doi: 10.1038/ni1462. [DOI] [PubMed] [Google Scholar]
- 16.Huang CY, Bredemeyer AL, Walker LM, Bassing CH, Sleckman BP. Dynamic regulation of c-Myc proto-oncogene expression during lymphocyte development revealed by a GFP-c-Myc knock-in mouse. Eur. J. Immunol. 2008;38:342–349. doi: 10.1002/eji.200737972. [DOI] [PubMed] [Google Scholar]
- 17.Satpathy AT, et al. Zbtb46 expression distinguishes classical dendritic cells and their committed progenitors from other immune lineages. J. Exp. Med. 2012;209:1135–1152. doi: 10.1084/jem.20120030. [DOI] [PMC free article] [PubMed] [Google Scholar]
- 18.Becker AM, et al. IRF-8 extinguishes neutrophil production and promotes dendritic cell lineage commitment in both myeloid and lymphoid mouse progenitors. Blood. 2012;119:2003–2012. doi: 10.1182/blood-2011-06-364976. [DOI] [PMC free article] [PubMed] [Google Scholar]
- 19.Tailor P, Tamura T, Morse HC, Ozato K. The BXH2 mutation in IRF8 differentially impairs dendritic cell subset development in the mouse. Blood. 2008;111:1942–1945. doi: 10.1182/blood-2007-07-100750. [DOI] [PMC free article] [PubMed] [Google Scholar]
- 20.Inaba K, et al. Generation of large numbers of dendritic cells from mouse bone marrow cultures supplemented with granulocyte/macrophage colony-stimulating factor. J Exp. Med. 1992;176:1693–1702. doi: 10.1084/jem.176.6.1693. [DOI] [PMC free article] [PubMed] [Google Scholar]
- 21.Tussiwand R, et al. Compensatory dendritic cell development mediated by BATF-IRF interactions. Nature. 2012;490:502–507. doi: 10.1038/nature11531. [DOI] [PMC free article] [PubMed] [Google Scholar]
- 22.Scott CL, et al. Functional analysis of mature hematopoietic cells from mice lacking the beta c chain of the granulocyte-macrophage colony-stimulating factor receptor. Blood. 1998;92:4119–4127. [PubMed] [Google Scholar]
- 23.Shortman K, Heath WR. The CD8+ dendritic cell subset. Immunol Rev. 2010;234:18–31. doi: 10.1111/j.0105-2896.2009.00870.x. [DOI] [PubMed] [Google Scholar]
- 24.Hildner K, et al. Batf3 deficiency reveals a critical role for CD8alpha+ dendritic cells in cytotoxic T cell immunity. Science. 2008;322:1097–1100. doi: 10.1126/science.1164206. [DOI] [PMC free article] [PubMed] [Google Scholar]
- 25.Swiecki M, Gilfillan S, Vermi W, Wang Y, Colonna M. Plasmacytoid dendritic cell ablation impacts early interferon responses and antiviral NK and CD8(+) T cell accrual. Immunity. 2010;33:955–966. doi: 10.1016/j.immuni.2010.11.020. [DOI] [PMC free article] [PubMed] [Google Scholar]
- 26.Meredith MM, et al. Expression of the zinc finger transcription factor zDC (Zbtb46, Btbd4) defines the classical dendritic cell lineage. J. Exp. Med. 2012;209:1153–1165. doi: 10.1084/jem.20112675. [DOI] [PMC free article] [PubMed] [Google Scholar]
- 27.Satpathy AT, et al. Notch2-dependent classical dendritic cells orchestrate intestinal immunity to attaching-and-effacing bacterial pathogens. Nat. Immunol. 2013 doi: 10.1038/ni.2679. [DOI] [PMC free article] [PubMed] [Google Scholar]
- 28.Edelson BT, et al. CD8a+ Dendritic Cells Are an Obligate Cellular Entry Point for Productive Infection by Listeria monocytogenes. Immunity. 2011;35:236–248. doi: 10.1016/j.immuni.2011.06.012. [DOI] [PMC free article] [PubMed] [Google Scholar]
- 29.Neuenhahn M, et al. CD8alpha+ dendritic cells are required for efficient entry of Listeria monocytogenes into the spleen. Immunity. 2006;25:619–630. doi: 10.1016/j.immuni.2006.07.017. [DOI] [PubMed] [Google Scholar]
- 30.Resnitzky D, Kimchi A. Deregulated c-myc expression abrogates the interferon- and interleukin 6-mediated G0/G1 cell cycle arrest but not other inhibitory responses in M1 myeloblastic cells. Cell Growth Differ. 1991;2:33–41. [PubMed] [Google Scholar]
- 31.Satpathy AT, et al. Zbtb46 expression distinguishes classical dendritic cells and their committed progenitors from other immune lineages. J. Exp. Med. 2012;209:1135–1152. doi: 10.1084/jem.20120030. [DOI] [PMC free article] [PubMed] [Google Scholar]
- 32.Iiizumi S, et al. Simple one-week method to construct gene-targeting vectors: application to production of human knockout cell lines. Biotechniques. 2006;41:311–316. doi: 10.2144/000112233. [DOI] [PubMed] [Google Scholar]
- 33.Dignam JD, Lebovitz RM, Roeder RG. Accurate transcription initiation by RNA polymerase II in a soluble extract from isolated mammalian nuclei. Nucleic Acids Res. 1983;11:1475–1489. doi: 10.1093/nar/11.5.1475. [DOI] [PMC free article] [PubMed] [Google Scholar]
- 34.Ginhoux F, et al. Fate Mapping Analysis Reveals That Adult Microglia Derive from Primitive Macrophages. Science. 2010;330:841–845. doi: 10.1126/science.1194637. [DOI] [PMC free article] [PubMed] [Google Scholar]
- 35.Pope C, et al. Organ-specific regulation of the CD8 T cell response to Listeria monocytogenes infection. J Immunol. 2001;166:3402–3409. doi: 10.4049/jimmunol.166.5.3402. [DOI] [PubMed] [Google Scholar]
- 36.Kim SK, et al. Generation of mucosal cytotoxic T cells against soluble protein by tissue- specific environmental and costimulatory signals. Proc. Natl. Acad. Sci. U. S A. 1998;95:10814–10819. doi: 10.1073/pnas.95.18.10814. [DOI] [PMC free article] [PubMed] [Google Scholar]
- 37.Edelson BT, et al. CD8a+ Dendritic Cells Are an Obligate Cellular Entry Point for Productive Infection by Listeria monocytogenes. Immunity. 2011;35:236–248. doi: 10.1016/j.immuni.2011.06.012. [DOI] [PMC free article] [PubMed] [Google Scholar]
- 38.Neuenhahn M, et al. CD8alpha+ dendritic cells are required for efficient entry of Listeria monocytogenes into the spleen. Immunity. 2006;25:619–630. doi: 10.1016/j.immuni.2006.07.017. [DOI] [PubMed] [Google Scholar]
- 39.Verschoor A, et al. A platelet-mediated system for shuttling blood-borne bacteria to CD8alpha+ dendritic cells depends on glycoprotein GPIb and complement C3. Nat. Immunol. 2011;12:1194–1201. doi: 10.1038/ni.2140. [DOI] [PubMed] [Google Scholar]
- 40.Belz GT. Direct ex vivo activation of T cells for analysis of dendritic cells antigen presentation. Methods Mol. Biol. 2010;595:351–369. doi: 10.1007/978-1-60761-421-0_23. [DOI] [PubMed] [Google Scholar]
- 41.Lee TI, Johnstone SE, Young RA. Chromatin immunoprecipitation and microarray- based analysis of protein location. Nat. Protoc. 2006;1:729–748. doi: 10.1038/nprot.2006.98. [DOI] [PMC free article] [PubMed] [Google Scholar]
- 42.Zhang Y, et al. Model-based analysis of ChIP-Seq (MACS). Genome Biol. 2008;9:R137. doi: 10.1186/gb-2008-9-9-r137. [DOI] [PMC free article] [PubMed] [Google Scholar]
- 43.Heinz S, et al. Simple combinations of lineage-determining transcription factors prime cis-regulatory elements required for macrophage and B cell identities. Mol. Cell. 2010;38:576–589. doi: 10.1016/j.molcel.2010.05.004. [DOI] [PMC free article] [PubMed] [Google Scholar]
- 44.Subramanian A, et al. Gene set enrichment analysis: a knowledge-based approach for interpreting genome-wide expression profiles. Proc. Natl. Acad. Sci. U. S A. 2005;102:15545–15550. doi: 10.1073/pnas.0506580102. [DOI] [PMC free article] [PubMed] [Google Scholar]
- 45.Huang d.W, Sherman BT, Lempicki RA. Systematic and integrative analysis of large gene lists using DAVID bioinformatics resources. Nat. Protoc. 2009;4:44–57. doi: 10.1038/nprot.2008.211. [DOI] [PubMed] [Google Scholar]
- 46.Edelson BT, et al. Peripheral CD103+ dendritic cells form a unified subset developmentally related to CD8alpha+ conventional dendritic cells. J. Exp. Med. 2010;207:823–836. doi: 10.1084/jem.20091627. [DOI] [PMC free article] [PubMed] [Google Scholar]
- 47.Ginhoux F, et al. Blood-derived dermal langerin+ dendritic cells survey the skin in the steady state. J Exp. Med. 2007;204:3133–3146. doi: 10.1084/jem.20071733. [DOI] [PMC free article] [PubMed] [Google Scholar]
- 48.Lefrancois L, Lycke N. Isolation of mouse small intestinal intraepithelial lymphocytes, Peyer's patch, and lamina propria cells. Curr. Protoc. Immunol. 2001 doi: 10.1002/0471142735.im0319s17. Chapter 3, Unit. [DOI] [PubMed] [Google Scholar]
- 49.Murphy DJ, et al. Distinct thresholds govern Myc's biological output in vivo. Cancer Cell. 2008;14:447–457. doi: 10.1016/j.ccr.2008.10.018. [DOI] [PMC free article] [PubMed] [Google Scholar]
- 50.Feil R, Wagner J, Metzger D, Chambon P. Regulation of Cre recombinase activity by mutated estrogen receptor ligand-binding domains. Biochem. Biophys. Res. Commun. 1997;237:752–757. doi: 10.1006/bbrc.1997.7124. [DOI] [PubMed] [Google Scholar]
- 51.Mahfoudi A, Roulet E, Dauvois S, Parker MG, Wahli W. Specific mutations in the estrogen receptor change the properties of antiestrogens to full agonists. Proc. Natl. Acad. Sci. U. S A. 1995;92:4206–4210. doi: 10.1073/pnas.92.10.4206. [DOI] [PMC free article] [PubMed] [Google Scholar]
- 52.Sedy JR, et al. B and T lymphocyte attenuator regulates T cell activation through interaction with herpesvirus entry mediator. Nat. Immunol. 2005;6:90–98. doi: 10.1038/ni1144. [DOI] [PubMed] [Google Scholar]
- 53.Tussiwand R, et al. Compensatory dendritic cell development mediated by BATF-IRF interactions. Nature. 2012;490:502–507. doi: 10.1038/nature11531. [DOI] [PMC free article] [PubMed] [Google Scholar]


