

Abstract
We hypothesized alterations in gene expression could identify important pathways involved in transplant lung injury. Bronchoalveolar lavage fluid was sampled from donors prior to procurement and in recipients within an hour of reperfusion as part of the NIAID Clinical Trials in Organ Transplantation Study. 23 patients with Grade 3 PGD were frequency matched with controls based on donor age and recipient diagnosis. RNA was analyzed using the Human Gene 1.0 ST array. Normalized mRNA expression was transformed and differences between donor and post-reperfusion values were ranked then tested using Gene Set Enrichment Analysis. 362 gene sets were upregulated with 8 meeting significance (FWER p-value <0.05), including the NOD-like receptor inflammasome (NLR; p<0.001), toll-like receptors (TLR; p<0.001), IL-1 receptor (p=0.001), Myeloid differentiation primary response gene 88 (p=0.001), NFκB activation by nontypeable Haemophilus influenzae (p=0.001), TLR 4 (p=0.008), and TLR 9 (p=0.018). The top 5 ranked individual transcripts from these pathways based on rank metric score are predominantly present in the NLR and TLR pathways, including IL1β (1.162), NLRP3 (1.135), IL1α (0.952), IL6 (0.931) and CCL4 (0.842). Gene set enrichment analyses implicate inflammasome mediated and innate immune signaling pathways as key mediators of the development of PGD in lung transplant patients.
Keywords: Primary Graft Dysfunction, Lung transplantation, Gene expression
INTRODUCTION
Primary graft dysfunction (PGD) is the most common cause of early death after lung transplantation. [1] PGD is characterized by hypoxemia and radiographic infiltrates occurring in the allograft within 72 hours of transplantation. [2] 10-30% of all subjects receiving lung transplantation develop PGD, [3] which is associated with both short and long-term morbidity and mortality. [2, 4]
Though the mechanisms of PGD remain incompletely understood, donor [5] and other factors have been implicated in PGD risk. [3] mRNA expression profiling is an ideal tool for identifying key pathways that are involved in the pathogenesis of complex syndromes, such as acute lung injury.[6] We sought to define pathways important in PGD development by comparing changes in donor lung gene expression before transplant with those after reperfusion, using a multicenter cohort study design. We used a gene set enrichment approach employing known biological pathways to capture changes seen in many genes within a cellular pathway in PGD subjects. [7] We hypothesized that specific pathways could be identified that are differentially expressed during the transplant procedure in patients who develop clinically significant PGD.
METHODS
Study Population and Data Collected
Subjects were selected from the Clinical Trials in Organ Transplantation-03 study (CTOT-03) which is a multi-center, prospective cohort study of solid organ transplant recipients (NCT00531921). CTOT-03 is a research consortium of 5 centers conducting clinical and mechanistic studies designed to investigate mRNA profiles with early outcomes. At study completion 294 participants had been enrolled. Institutional review board approval and informed written consent from both recipients and organ donor proxies were obtained prior to the recruitment of subjects. A subset of consecutively consenting lung transplant subjects was enrolled between January 22, 2008 and August 19, 2010 from 3 centers (Penn, Columbia, and Wisconsin). Clinical data were collected prospectively. PGD grade was determined using the consensus definition of the International Society of Heart and Lung Transplantation using two blinded readers with adjudication as previously described. [8, 9] We used any grade 3 PGD occurring within the first 72 hours following lung transplantation as our primary case definition.[8] To minimize confounding secondary to donor and recipient factors independent of suspected PGD mechanism, we utilized a nested case control strategy (Figure 1). From the total enrolled lung transplant cohort of 106 subjects, we selected all 23 patients with PGD and matched controls on donor age (categorical variable: <45 vs. >=45) [10] and pre-transplant recipient diagnosis (cystic fibrosis, emphysema, or pulmonary fibrosis) to ensure similarity between cases and controls. The minimum age difference was then used to select the "best" match when there was more than one potential control subject identified per case.
Figure 1.
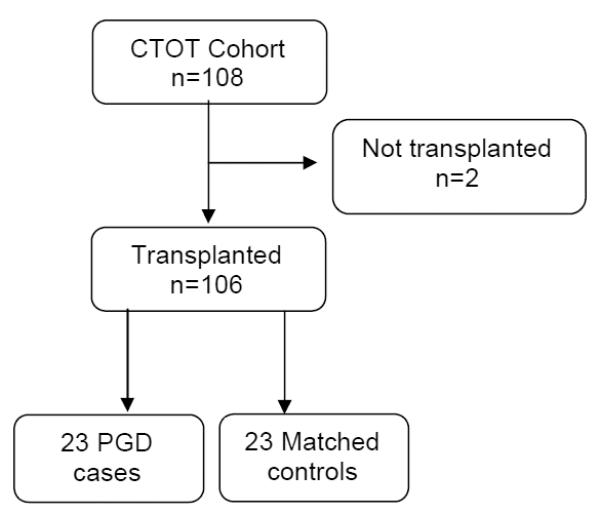
Enrollment Design
Collection and Processing of Biological Samples
Bronchoalveolar lavage fluid (BALF) was collected in the donor operating room before procurement and again 1 hour after reperfusion to focus on early mechanisms contributing to PGD. 20 mL of normal saline was instilled in one subsegmental location in order to retrieve a minimum of 5 mL of BALF. The BALF was placed in a sterile 120 mL specimen cup and immediately placed on ice. The sample was processed as soon as possible but no greater than 8 hours after collection. The sample was transferred into 50 mL sterile centrifuge tubes and centrifuged at 2100 RPM for 10 minutes at room temperature. The supernatant was aliquoted and cell pellet was resuspended in Trizol and stored at −80 C.
Gene expression array and Quality Control
We used the Affymetrix Human Gene 1.0 ST Array, which has whole-transcript coverage for 36,079 total RefSeq transcripts and 21,014 genes. [11] 100ng of total RNA was converted to first-strand cDNA using reverse transcriptase primed by a poly(T) oligomer that incorporated the T7 RNA polymerase promoter. Second-strand cDNA synthesis was followed by in vitro transcription (Affymetrix One-Cycle Target Labeling Kit) for linear amplification and biotinylation of each transcript, and the resulting cDNA was fragmented and assessed by Bioanalyzer. Affymetrix Command Console and Expression Console were used to quantitate expression levels for targeted genes; default values provided by Affymetrix were applied to all analysis parameters. Border pixels were removed, and the average intensity of pixels within the 75th percentile was computed for each probe. Probe sets for positive and negative controls were examined in Expression Console, and Facility quality control parameters were confirmed to fall within normal ranges. Probe intensities were exported as Affymetrix cel files. Cel files were imported into Partek Genomics Suite (v6.6, Partek, Inc. St. Louis, MO) where RMA normalization was applied, resulting in log2-transformed expression intensities for each transcript in each sample.
Differential Expression and Gene Set Enrichment Analysis (GSEA)
Three independent biological replicates of each sample (2 time points for each of 23 PGD and 23 Control participants) for each condition (Control pre-procurement: Time 0, PGD−; Control post reperfusion: Time 1 PGD−; Case pre-procurement: Time 0 PGD+; Case post reperfusion: Time 1 PGD+) were assayed on microarrays. Principal Components Analysis by sample was performed to confirm that replicates within each condition grouped with most similarity, and to identify any outlier samples. Genes were then ranked to reflect greatest changes from donor to post-implantation by the following transformation [(mean Log2,Time 1, PGD+ − mean Log2,Time 1, PGD−) − (mean Log2,Time 0, PGD+ − mean Log2,Time 0, PGD−)], and the resulting ranked gene list was tested for networks of gene interactions using Gene Set Enrichment Analysis (v2.07, Broad Institute, Cambridge, MA) using curated gene sets (Molecular Signatures Database, v3.0, C2, Cannonical Pathways including KEGG, BIOCARTA, REACTOME and GO). [7] The logic of the transformation was based on the premise that there are significant changes in gene expression after transplantation not all of which are related to the development of PGD and therefore this strategy would highlight only those pathways important in the mechanism of PGD.
RESULTS
108 subjects were enrolled and 106 subjects were transplanted. 23 subjects, 21.7% (95% CI: 14.3, 30.8), developed grade 3 PGD within 72 hours. Baseline demographics between PGD cases and matched controls are summarized in Table 1. There were no statistically significant differences in donor age, gender, race, cause of death, smoking history, bronchoscopic findings, ischemic time, and preservation fluid type or recipient related factors such as age, gender, race, pulmonary artery pressure, and transplant type. Additionally, we were unable to demonstrate statistically significant differences in intra-operative interventions, including cardiopulmonary bypass (CPB) use or time. As would be expected, postoperative need for mechanical ventilation differed significantly between PGD and non-PGD controls (Table 1).
Table 1.
Baseline demographics
| PGD (n=23) |
No PGD (n=23) |
p-value | |
|---|---|---|---|
| Donor | |||
| Age | 36.0 (16.32) | 39.7 (12.85) | 0.409 |
| Female | 5 (21.7) | 10 (43.5) | 0.116 |
| Race | 0.641 | ||
| Asian | 0 | 1 (4.3) | |
| African American | 4 (17.4) | 4 (17.4) | |
| Caucasian | 15 (65.2) | 34 (73.9) | |
| Unknown/Not reported | 4 (17.4) | 1 (4.3) | |
| Cause of Death | 0.916 | ||
| Anoxia | 3 (13.0) | 3 (13.0) | |
| Cerebrovascular | 10 (43.5) | 11 (47.8) | |
| Head Trauma | 7 (30.4) | 5 (21.7) | |
| Other | 3 (13.0) | 4 (17.4) | |
| Non-smoker | 13 (56.5) | 14 (60.9) | 0.765 |
| Normal bronchoscopy | 19 (82.6) | 18 (78.3) | >0.999 |
| Total ischemic time | 447 (222) | 378 (201) | 0.273 |
| Recipient | |||
| Age | 56.4 (8.79) | 55.4 (10.27) | 0.724 |
| Female | 5 (21.7) | 8 (34.8) | 0.326 |
| Race | 0.234 | ||
| African American | 3 (13.0) | 0 | |
| Caucasian | 20 (87.0) | 21 (91.3) | |
| Unknown/Not reported | 0 | 2 (8.7) | |
| Diagnosis | >0.999 | ||
| Bronchiectasis/CF | 4 (17.4) | 4 (17.4) | |
| COPD/LAM | 5 (21.7) | 5 (21.7) | |
| Pulmonary fibrosis | 12 (52.2) | 12 (52.2) | |
| Other | 2 (8.7) | 2 (8.7) | |
| Bilateral transplant | 16 (69.6) | 10 (43.5) | 0.078 |
| Intra-operative factors | |||
| PASP | 56.9 (25.36) | 60.8 (33.03) | 0.671 |
| CPB needed | 14 (60.9) | 8 (34.8) | 0.077 |
| CPB duration | 260.8 (89.01) | 201.1 (91.3) | 0.156 |
| Mechanical ventilation | |||
| 24 hours post-op | 20 (87.0) | 11 (47.8) | 0.005 |
| 48 hours post-op | 14 (60.9) | 3 (13.0) | <0.001 |
| 72 hours post-op | 10 (43.5) | 3 (13.0) | 0.022 |
Data are presented as mean (standard deviation) for continuous variables and as number (percent) for categorical variables. CF, cystic fibrosis; LAM, lymphangioleimatosis; PASP, pulmonary artery systolic pressure; CPB, cardiopulmonary bypass.
Pathway differences in mRNA expression pre-procurement to post-reperfusion between PGD cases and controls are presented in Table 2. A total of 362 gene sets were upregulated in recipients who developed PGD of which 8 gene sets met significance with a FWER of less than 0.05 (Figure 2). A complete list of gene sets which did not meet our cutoff can be found in the supplement (Table S1). The pathway with the highest normalized enrichment score (NES), a standardized metric which accounts for differences in gene set size and in correlations between gene sets and the expression dataset, was the KEGG nucleotide binding oligomerization domain like receptor (NLR) inflammasome pathway (Figure 2 A; NES 2.44; FWER adjusted p<0.001). The second highest pathway was the KEGG toll like receptor (TLR) signaling pathway (Figure 2 B; NES 2.22; FWER adjusted p<0.001). Six other pathways met our FWER cutoff and included: BIOCARTA IL-1 receptor (IL1R) pathway (NES 2.19; FWER adjusted p=0.001), REACTOME myeloid differentiation primary response gene 88 (MYD88) (NES 2.16; FWER adjusted p=0.001), BIOCARTA NFκB activation by nontypeable Haemophilus influenzae (NTHI) signaling pathway (NES 2.16; FWER adjusted p=0.001), REACTOME activated TLR 4 signaling pathway (NES 2.10; FWER adjusted p=0.008), REACTOME TLR 9 cascade (NES 2.07; FWER adjusted p=0.018) and BIOCARTA toll pathway (NES 2.06; FWER adjusted p=0.018). Individual enrichment plots are presented in the supplement (Figure S1). Each of these pathways has been described as either activating or affecting innate immune function. Further analysis of the individual transcripts from these pathways based on the rank metric score, a measure of an individual transcript’s correlation with the PGD phenotype, demonstrated significant overlap within the NLR and TLR pathways. The highest ranked individual transcripts include IL1β (1.162), NLRP3 (1.135), IL1A (0.952), IL6 (0.931), CCL4 (0.842), TLR6 (0.805), TLR1 (0.796), TNFAIP3 (0.792), and TLR4 (0.677). The enriched individual transcripts from the 8 pathways meeting the FWER of 0.05 are presented in Table 3 and the complete ranked gene list for positively correlated transcripts is presented in the supplement (Table S2).
Table 2.
Genes set enrichment analysis
| NAME | Source | NES | NOM p-val | FDR q-val | FWER p-val |
|---|---|---|---|---|---|
| NOD-like receptor signaling pathway | KEGG | 2.443 | <0.001 | <0.001 | <0.001 |
| TOLL-like receptor signaling pathway | KEGG | 2.222 | <0.001 | <0.001 | <0.001 |
| IL 1R pathway | BIOCARTA | 2.19 | <0.001 | 0.0003 | 0.001 |
| MYD88 cascade | REACTOME | 2.161 | <0.001 | 0.0002 | 0.001 |
| NTHI pathway | BIOCARTA | 2.157 | <0.001 | 0.0002 | 0.001 |
| Activated TLR4 signaling | REACTOME | 2.103 | <0.001 | 0.0014 | 0.008 |
| TLR9 cascade | REACTOME | 2.066 | <0.001 | 0.0026 | 0.018 |
| TOLL pathway | BIOCARTA | 2.064 | <0.001 | 0.0023 | 0.018 |
NES, normalized enrichment score (accounts for differences in gene set size and in correlations between gene sets and the expression dataset to allow for comparisons across gene sets); NOM p-val, nominal p value (estimates the statistical significance of the enrichment score for a single gene set); FDR, false discovery rate (estimated probability that a gene set with a given NES represents a false positive finding); FWER, familywise-error rate (conservative correction that seeks to ensure that the list of reported results does not include even a single false-positive gene set). [7]
Figure 2. Most significantly enriched gene sets.
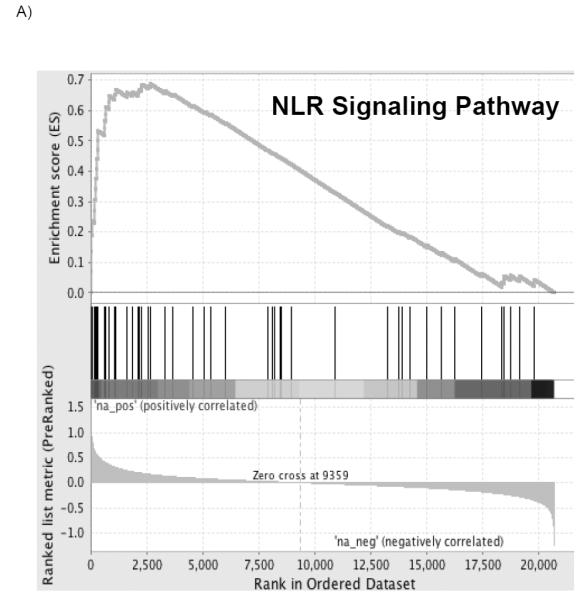
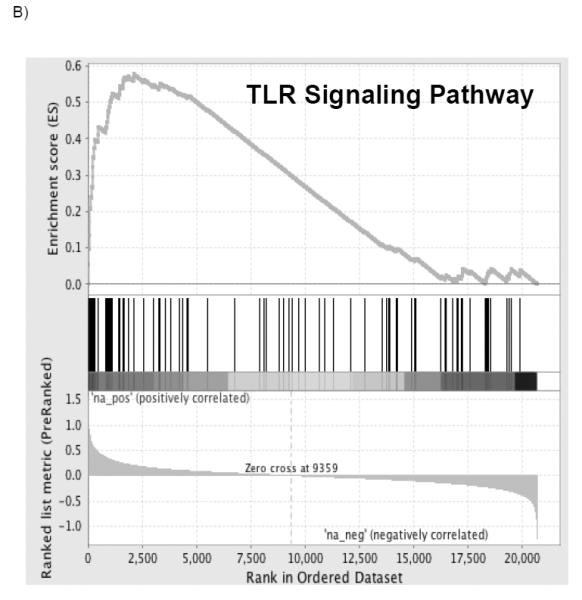
The top portion of the plot shows the running enrichment score (ES) for the gene set from decreasing values of the rank list. The score at the peak of the plot (the score furthest from 0.0) is the ES for the overall gene set. The middle portion of the plot shows where the members of the gene set appear in the ranked list of genes. The bottom portion of the plot shows the value of the ranking metric as the list of ranked genes decreases in value. The ranking metric measures an individual transcript’s correlation with the PGD phenotype.
Table 3.
Significantly enriched transcripts in GSEA pathways
| NLR signaling pathway | TLR signaling pathway | IL1R pathway | MYD88 cascade | NTHI pathway | Actvated ILR4 signaling | TLR9 cascade | TOLL pathway | ||||||||
|---|---|---|---|---|---|---|---|---|---|---|---|---|---|---|---|
| IL1B | 1.162 | IL1B | 1.162 | IL1B | 1.162 | TLR6 | 0.805 | IL1B | 1.162 | TLR6 | 0.805 | TLR6 | 0.805 | TLR6 | 0.805 |
| NLRP3 | 1.135 | IL6 | 0.931 | IL1A | 0.952 | TLR1 | 0.796 | NFKB1 | 0.629 | TLR1 | 0.796 | TLR1 | 0.796 | TLR4 | 0.677 |
| IL6 | 0.931 | CCL4 | 0.842 | IL6 | 0.931 | TLR4 | 0.677 | TLR2 | 0.608 | TLR4 | 0.677 | TLR4 | 0.677 | NFKB1 | 0.629 |
| TNFAIP3 | 0.792 | TLR6 | 0.805 | IL1RN | 0.676 | IRAK3 | 0.636 | MAPK14 | 0.602 | IRAK3 | 0.636 | IRAK3 | 0.636 | TLR2 | 0.608 |
| MEFV | 0.632 | TLR1 | 0.796 | IL1RAP | 0.673 | TLR2 | 0.608 | IL8 | 0.558 | TLR2 | 0.608 | TLR2 | 0.608 | MAPK14 | 0.602 |
| NFKB1 | 0.629 | TLR4 | 0.677 | IRAK3 | 0.636 | TLR8 | 0.453 | MAP2K6 | 0.542 | TLR8 | 0.453 | TLR8 | 0.453 | MAP2K6 | 0.542 |
| NAIP | 0.613 | NFKB1 | 0.629 | NFKB1 | 0.629 | TLR10 | 0.406 | TNF | 0.360 | TLRI0 | 0.406 | TLR10 | 0.406 | TLR10 | 0.406 |
| MAPK14 | 0.602 | TLR2 | 0.608 | MAPK14 | 0.602 | TLR5 | 0.345 | NFKBIA | 0.309 | TLR5 | 0.345 | TLR5 | 0.345 | PGLYRP1 | 0.358 |
| NLRC4 | 0.565 | MAPK14 | 0.602 | MAP2K6 | 0.542 | IRAK4 | 0.341 | CREBBP | 0.25B | IRAK4 | 0.341 | IRAK4 | 0.341 | FOS | 0.336 |
| IL8 | 0.558 | CCL3 | 0.583 | IL1R1 | 0.411 | LY96 | 0.259 | IKBKB | 0.23B | TBK1 | 0.320 | LY96 | 0.259 | NFKBIA | 0.309 |
| CXCL1 | 0.539 | IL8 | 0.558 | IRAK2 | 0.410 | DUSP 1 | 0.229 | LY96 | 0.259 | PIK3C3 | 0.248 | EIF2AK2 | 0.282 | ||
| CXCL2 | 0.524 | MAP2K6 | 0.542 | TNF | 0.360 | SMAD3 | 0.214 | LY96 | 0.259 | ||||||
| CASP5 | 0.518 | PIK3CG | 0.464 | NFKBIA | 0.309 | IKBKB | 0.238 | ||||||||
| CARD8 | 0.413 | TLR8 | 0.453 | CD14 | 0.200 | ||||||||||
| CCL7 | 0.413 | TNF | 0.360 | ||||||||||||
| CASP1 | 0.394 | TLR5 | 0.345 | ||||||||||||
| BIRC2 | 0.394 | IRAK4 | 0.341 | ||||||||||||
| TNF | 0.360 | FOS | 0.336 | ||||||||||||
| BIRC3 | 0.358 | IFNAR1 | 0.321 | ||||||||||||
| NFKBIA | 0.309 | TBK1 | 0.320 | ||||||||||||
| CASP8 | 0.299 | NFKBIA | 0.309 | ||||||||||||
| IKBKB | 0.238 | CASP8 | 0.299 | ||||||||||||
| MAPK10 | 0.218 | LY96 | 0.259 | ||||||||||||
| CCL2 | 0.199 | RAC1 | 0.258 | ||||||||||||
| ERBB2IP | 0.196 | STAT1 | 0.254 | ||||||||||||
| XIAP | 0.189 | PIK3CA | 0.240 | ||||||||||||
| NOD2 | 0.187 | IKBKB | 0.238 | ||||||||||||
| MAPK11 | 0.170 | PIK3CD | 0.232 | ||||||||||||
| CCL11 | 0.164 | MAPK10 | 0.218 | ||||||||||||
| PIK3R5 | 0.200 | ||||||||||||||
| CD14 | 0.200 | ||||||||||||||
Numbers represent the rank metric score of each gene which is used to position the gene in the ranked list. The ranking metric measures an individual transcript’s correlation with the PGD phenotype.
DISCUSSION
In this study, we have defined key pathways involved in the development of PGD, using gene set enrichment analysis (GSEA). Like most complex traits, the PGD phenotype likely manifests with multiple alterations in gene expression highlighted by fewer dominant pathways. The strength of GSEA lies in its ability to utilize biological information (e.g. published information about well-characterized biological pathways) to guide analysis so that multiple changes in individual genes acting as part of a network within a background of profound physiologic perturbation, as seen in transplantation, can be analyzed with an interpretable result. [7] Using this methodology, our results suggest inflammasome and innate immune mediated processes are actively involved in the pathophysiology of PGD, when also taking into account changes seen during transplantation in control subjects.
Inflammasomes are proinflammatory macromolecular complexes that activate caspase-1 which results in IL-1β activation. [12] These complexes are part of an increasingly recognized stereotyped innate immunologic response to tissue damage. This threat is recognized in the host by pattern recognition receptors that are either localized in the cell membrane (e.g. Toll-like receptors, TLRs) or in the cytoplasm (e.g. Nod-like receptors, NLRs). Though the specific pathways of inflammasome activation are incompletely understood, danger- and pathogen associated molecular pattern (DAMPs and PAMPs) recognition play an important role. [13] Stimuli for activation of these pathways include bacterial and viral pathogens, [14] lysosomal disruption, [15] neutrophil or mitochondria derived reactive oxygen species (ROS), [16, 17] and cell apoptosis. [17, 18] Therefore, our findings may indicate that response to either pathogens (likely donor derived) or response to cell and tissue damage signals are key in PGD pathogenesis and warrant further investigation.
We have identified IL-1β, the major inflammasome-regulated effector cytokine, as being significantly correlated to several pathways potentially involved in PGD pathogenesis. IL-1β has consistently been demonstrated as a key mediator in other types of acute lung injury, and recent investigations by our group have implicated genetic variation in this pathway to associate with differential acute respiratory distress syndrome (ARDS) risk. [12, 19-24] It is possible that a subset of the donor population had subclinical lung injury present at the time of procurement that was augmented by ischemia and reperfusion leading to clinical PGD. Both direct (pneumonia, aspiration, hyperoxia, pulmonary contusion and reperfusion) and indirect (trauma, sepsis and transfusion) causes of ALI are recognized in critically ill patients.[25, 26] Several of these exposures are present in organ donors and are significant contributors to organ unsuitability for transplant.[27] Among organs used for transplant with these exposures, PGD may reflect organ injury which may have progressed to ALI had the donors not been transplanted.[27] Furthermore, brain death directly causes neurogenic pulmonary edema and ALI. Diffuse organ inflammatory responses associated with brain death impair lung function after implant and contribute to PGD.[31-33] Alternately, IL-1 signaling in response to inflammasome activation may represent a pathophysiological amplification of the immune response after reperfusion, perhaps as a result of different levels of tissue damage occurring during organ preservation.
Current methods of organ preservation rely on hypothermia and specially formulated perfusates to decrease metabolic injury. It is recognized that all non-enzymatic and enzymatic processes are reduced by 1.5-3 fold per 10°C temperature decreases from baseline and cold preservation has been the foundation for organ preservation. [28] Recent evidence suggests that hypothermia in the presence of oxygen can result in ROS-mediated hypothermic injury. [28] Among solid organs, the lung is unique because it is stored inflated and does not experience similar degrees of hypoxia. [28-30] Further, evidence in a rodent model demonstrates oxygen dependent dose related lung injury with increasing percentage of oxygen in the gas mixture used for inflation. [28, 31] Thus, the injury seen in PGD may be consequent to oxidant stress with resultant DAMP-regulated inflammasome activation, which may be a target for future ex vivo lung perfusion strategies. Alternatively, hidden donor microbial pathogens alone or in combination with subclinical organ injury may amplify ischemia/reperfusion injury to the extent that recipient antioxidant potential is overwhelmed.
There are several limitations of this study. First, our study design relied on the evaluation of cells from BALF at 2 time points (donor in situ and post reperfusion). While BALF has the advantage of sampling multiple cell types from a larger section of lung than lung biopsies, this methodology may introduce a sampling bias as cells form this source would be expected to be comprised mostly of alveolar macrophages, neutrophils, B cells, T cells and epithelial cells.[32] Additionally, this mixed cell population would be exclusively donor derived pre-procurement and, likewise, donor alveolar cells would be most likely to contribute to gene expression measured after one hour post reperfusion.[33] This sampling method was specifically chosen to highlight early pathways important in PGD pathogenesis. However, we acknowledge that there may be parenchymal and vascular contributions that may have been present in lung biopsy samples and not BAL, for example. Despite this limitation, our results are consistent with previous reports that TLR signaling pathways are important in lung injury.[34] Second, it is not possible to establish functional causation with our study design. However, our results serve to prioritize inflammasomes, and innate immune activation and modulation, for future study in PGD. Third, given the limited number of samples used for analysis it is possible that important changes in gene expression in single genes may have been overlooked and we may have been unable to demonstrate statistical differences in baseline demographics known to affect PGD. Fourth, our decision to use the familywise-error rate (FWER), a more conservative correction for multiple hypothesis testing than the false discovery rate (FDR), limited the number of pathways we considered significant. This conservative approach potentially excluded pathways important in PGD pathogenesis; however, we list the full results in the supplemental material (Table S1). Finally, our study lacks an external validation step. Unfortunately, there are no existent external datasets that can be used for replication; for this reason we have adopted a conservative multiple test correction.
In summary, we have demonstrated an association between inflammasome and innate immune activation and PGD. The effects of these pathways suggest importance of the inflammasome and innate immune signaling in PGD pathogenesis. This suggests a complex mechanism of injury initiation and modulation and therefore should stimulate further inquiry into the role of tissue damage from storage, as well as novel methods of identifying donor pathogens, such as donor microbiome analyses.
Supplementary Material
Table S1. Expanded gene set enrichment analysis
NES, normalized enrichment score (accounts for differences in gene set size and in correlations between gene sets and the expression dataset to allow for comparisons across gene sets); NOM p-val, nominal p value (estimates the statistical significance of the enrichment score for a single gene set); FDR, false discovery rate (estimated probability that a gene set with a given NES represents a false positive finding); FWER, familywise-error rate (conservative correction that seeks to ensure that the list of reported results does not include even a single false-positive gene set).
Table S2. Ranked gene list of PGD positively correlated transcripts
Figure S1. All significantly enriched gene sets meeting FWER corrected cutoff
The top portion of the plot shows the running enrichment score (ES) for the gene set from decreasing values of the rank list. The score at the peak of the plot (the score furthest from 0.0) is the ES for the overall gene set. The middle portion of the plot shows where the members of the gene set appear in the ranked list of genes. The bottom portion of the plot shows the value of the ranking metric as the list of ranked genes decreases in value. The ranking metric measures an individual transcript’s correlation with the PGD phenotype.
Acknowledgements
Funding Sources: NIH AI063589, HL087115, HL081619, HL096845, HL116656, HL090021 and RWJ11642
Abbreviations
- PGD
Primary Graft Dysfunction
- ALI
Acute lung injury
- NOD
Nucleotide binding oligomerization domain (NLR) like receptor
- DAMPs
Danger-associated molecular patterns
- PAMPs
Pathogen-associated molecular patterns
- TLR
Toll-like receptor
- MYD88
Myeloid differentiation primary response gene 88
- NTHI
NFκB activation by nontypeable Haemophilus influenzae
- ROS
Reactive oxygen species
Footnotes
Disclosures:
The authors of this manuscript have no conflicts of interest to disclose as described by the American Journal of Transplantation.
Supporting Information:
Additional supporting information may be found in the online version of this article.
References
- 1.Christie JD, et al. The Registry of the International Society for Heart and Lung Transplantation: twenty-seventh official adult lung and heart-lung transplant report--2010. J Heart Lung Transplant. 29(10):1104–18. doi: 10.1016/j.healun.2010.08.004. [DOI] [PubMed] [Google Scholar]
- 2.Christie JD, et al. Report of the ISHLT Working Group on Primary Lung Graft Dysfunction part II: definition. A consensus statement of the International Society for Heart and Lung Transplantation. J Heart Lung Transplant. 2005;24(10):1454–9. doi: 10.1016/j.healun.2004.11.049. [DOI] [PubMed] [Google Scholar]
- 3.Lee JC, Christie JD, Keshavjee S. Primary graft dysfunction: definition, risk factors, short- and long-term outcomes. Semin Respir Crit Care Med. 31(2):161–71. doi: 10.1055/s-0030-1249111. [DOI] [PubMed] [Google Scholar]
- 4.Daud SA, et al. Impact of immediate primary lung allograft dysfunction on bronchiolitis obliterans syndrome. Am J Respir Crit Care Med. 2007;175(5):507–13. doi: 10.1164/rccm.200608-1079OC. [DOI] [PubMed] [Google Scholar]
- 5.de Perrot M, et al. Ischemia-reperfusion-induced lung injury. Am J Respir Crit Care Med. 2003;167(4):490–511. doi: 10.1164/rccm.200207-670SO. [DOI] [PubMed] [Google Scholar]
- 6.Lewis CC, et al. Disease-specific gene expression profiling in multiple models of lung disease. Am J Respir Crit Care Med. 2008;177(4):376–87. doi: 10.1164/rccm.200702-333OC. [DOI] [PMC free article] [PubMed] [Google Scholar]
- 7.Subramanian A, et al. Gene set enrichment analysis: a knowledge-based approach for interpreting genome-wide expression profiles. Proc Natl Acad Sci U S A. 2005;102(43):15545–50. doi: 10.1073/pnas.0506580102. [DOI] [PMC free article] [PubMed] [Google Scholar]
- 8.Christie JD, et al. Construct validity of the definition of primary graft dysfunction after lung transplantation. J Heart Lung Transplant. 29(11):1231–9. doi: 10.1016/j.healun.2010.05.013. [DOI] [PMC free article] [PubMed] [Google Scholar]
- 9.Christie JD, et al. Report of the ISHLT Working Group on Primary Lung Graft Dysfunction part I: introduction and methods. J Heart Lung Transplant. 2005;24(10):1451–3. doi: 10.1016/j.healun.2005.03.004. [DOI] [PubMed] [Google Scholar]
- 10.Christie JD, et al. Clinical risk factors for primary graft failure following lung transplantation. Chest. 2003;124(4):1232–41. doi: 10.1378/chest.124.4.1232. [DOI] [PubMed] [Google Scholar]
- 11.Gellert P, et al. Gene Array Analyzer: alternative usage of gene arrays to study alternative splicing events. Nucleic Acids Res. 40(6):2414–25. doi: 10.1093/nar/gkr1110. [DOI] [PMC free article] [PubMed] [Google Scholar]
- 12.Dolinay T, et al. Inflammasome-regulated cytokines are critical mediators of acute lung injury. Am J Respir Crit Care Med. 2012;185(11):1225–34. doi: 10.1164/rccm.201201-0003OC. [DOI] [PMC free article] [PubMed] [Google Scholar]
- 13.Dowling JK, O'Neill LA. Biochemical regulation of the inflammasome. Crit Rev Biochem Mol Biol. 2012;47(5):424–43. doi: 10.3109/10409238.2012.694844. [DOI] [PubMed] [Google Scholar]
- 14.Lamkanfi M, Dixit VM. Modulation of inflammasome pathways by bacterial and viral pathogens. J Immunol. 2011;187(2):597–602. doi: 10.4049/jimmunol.1100229. [DOI] [PubMed] [Google Scholar]
- 15.Hornung V, et al. Silica crystals and aluminum salts activate the NALP3 inflammasome through phagosomal destabilization. Nat Immunol. 2008;9(8):847–56. doi: 10.1038/ni.1631. [DOI] [PMC free article] [PubMed] [Google Scholar]
- 16.Zhou R, et al. Thioredoxin-interacting protein links oxidative stress to inflammasome activation. Nat Immunol. 2010;11(2):136–40. doi: 10.1038/ni.1831. [DOI] [PubMed] [Google Scholar]
- 17.Nakahira K, et al. Autophagy proteins regulate innate immune responses by inhibiting the release of mitochondrial DNA mediated by the NALP3 inflammasome. Nat Immunol. 2011;12(3):222–30. doi: 10.1038/ni.1980. [DOI] [PMC free article] [PubMed] [Google Scholar]
- 18.Iyer SS, et al. Necrotic cells trigger a sterile inflammatory response through the Nlrp3 inflammasome. Proc Natl Acad Sci U S A. 2009;106(48):20388–93. doi: 10.1073/pnas.0908698106. [DOI] [PMC free article] [PubMed] [Google Scholar]
- 19.Jacobs RF, et al. Elevated interleukin-1 release by human alveolar macrophages during the adult respiratory distress syndrome. Am Rev Respir Dis. 1989;140(6):1686–92. doi: 10.1164/ajrccm/140.6.1686. [DOI] [PubMed] [Google Scholar]
- 20.Narimanbekov IO, Rozycki HJ. Effect of IL-1 blockade on inflammatory manifestations of acute ventilator-induced lung injury in a rabbit model. Exp Lung Res. 1995;21(2):239–54. doi: 10.3109/01902149509068830. [DOI] [PubMed] [Google Scholar]
- 21.Frank JA, et al. Protection from experimental ventilator-induced acute lung injury by IL-1 receptor blockade. Thorax. 2008;63(2):147–53. doi: 10.1136/thx.2007.079608. [DOI] [PubMed] [Google Scholar]
- 22.Opal SM, et al. Confirmatory interleukin-1 receptor antagonist trial in severe sepsis: a phase III, randomized, double-blind, placebo-controlled, multicenter trial. The Interleukin-1 Receptor Antagonist Sepsis Investigator Group. Crit Care Med. 1997;25(7):1115–24. doi: 10.1097/00003246-199707000-00010. [DOI] [PubMed] [Google Scholar]
- 23.Meyer NJ, et al. IL1RN Polymorphism is Associated with Lower Risk of Acute Lung Injury in Two Separate At-Risk Populations. Am J Respir Crit Care Med. 2010;181:A1023. [Google Scholar]
- 24.Diamond JM, et al. Elevated Plasma Long Pentraxin-3 Levels and Primary Graft Dysfunction After Lung Transplantation for Idiopathic Pulmonary Fibrosis. Am J Transplant. doi: 10.1111/j.1600-6143.2011.03702.x. [DOI] [PMC free article] [PubMed] [Google Scholar]
- 25.Matute-Bello G, Frevert CW, Martin TR. Animal models of acute lung injury. Am J Physiol Lung Cell Mol Physiol. 2008;295(3):L379–99. doi: 10.1152/ajplung.00010.2008. [DOI] [PMC free article] [PubMed] [Google Scholar]
- 26.Ware LB. Pathophysiology of acute lung injury and the acute respiratory distress syndrome. Semin Respir Crit Care Med. 2006;27(4):337–49. doi: 10.1055/s-2006-948288. [DOI] [PubMed] [Google Scholar]
- 27.Wilkes DS, Egan TM, Reynolds HY. Lung transplantation: opportunities for research and clinical advancement. Am J Respir Crit Care Med. 2005;172(8):944–55. doi: 10.1164/rccm.200501-098WS. [DOI] [PMC free article] [PubMed] [Google Scholar]
- 28.Rauen U, de Groot H. Mammalian cell injury induced by hypothermia- the emerging role for reactive oxygen species. Biol Chem. 2002;383(3-4):477–88. doi: 10.1515/BC.2002.050. [DOI] [PubMed] [Google Scholar]
- 29.Kirk AJ, Colquhoun IW, Dark JH. Lung preservation: a review of current practice and future directions. Ann Thorac Surg. 1993;56(4):990–100. doi: 10.1016/0003-4975(93)90378-u. [DOI] [PubMed] [Google Scholar]
- 30.Meyers BF, Patterson GA. Lung transplantation: current status and future prospects. World J Surg. 1999;23(11):1156–62. doi: 10.1007/s002689900639. [DOI] [PubMed] [Google Scholar]
- 31.Fukuse T, et al. Optimal alveolar oxygen concentration for cold storage of the lung. Transplantation. 2001;72(2):300–4. doi: 10.1097/00007890-200107270-00024. [DOI] [PubMed] [Google Scholar]
- 32.The BAL Cooperative Group Steering Committee Bronchoalveolar lavage constituents in healthy individuals, idiopathic pulmonary fibrosis, and selected comparison groups. Am Rev Respir Dis. 1990;141:S169–202. doi: 10.1164/ajrccm/141.5_Pt_2.S169. 5 Pt 2. [DOI] [PubMed] [Google Scholar]
- 33.Adoumie R, et al. Early cellular events in the lung allograft. Ann Thorac Surg. 1992;54(6):1071–6. doi: 10.1016/0003-4975(92)90072-c. discussion 1076-7. [DOI] [PubMed] [Google Scholar]
- 34.Andrade CF, et al. Toll-like receptor and cytokine gene expression in the early phase of human lung transplantation. J Heart Lung Transplant. 2006;25(11):1317–23. doi: 10.1016/j.healun.2006.09.017. [DOI] [PubMed] [Google Scholar]
Associated Data
This section collects any data citations, data availability statements, or supplementary materials included in this article.
Supplementary Materials
Table S1. Expanded gene set enrichment analysis
NES, normalized enrichment score (accounts for differences in gene set size and in correlations between gene sets and the expression dataset to allow for comparisons across gene sets); NOM p-val, nominal p value (estimates the statistical significance of the enrichment score for a single gene set); FDR, false discovery rate (estimated probability that a gene set with a given NES represents a false positive finding); FWER, familywise-error rate (conservative correction that seeks to ensure that the list of reported results does not include even a single false-positive gene set).
Table S2. Ranked gene list of PGD positively correlated transcripts
Figure S1. All significantly enriched gene sets meeting FWER corrected cutoff
The top portion of the plot shows the running enrichment score (ES) for the gene set from decreasing values of the rank list. The score at the peak of the plot (the score furthest from 0.0) is the ES for the overall gene set. The middle portion of the plot shows where the members of the gene set appear in the ranked list of genes. The bottom portion of the plot shows the value of the ranking metric as the list of ranked genes decreases in value. The ranking metric measures an individual transcript’s correlation with the PGD phenotype.