Abstract
Cardiovascular magnetic resonance (CMR) has a high diagnostic accuracy for constrictive pericarditis (CP). CMR allows for high-resolution imaging of the pericardium and associated structures in any imaging plane compared with that provided by other imaging modalities. We briefly discuss the specific quantitative and qualitative CMR sequences that can be tailored to answer the clinical questions pertaining to CP, where the diagnostic yield has been proven when characteristic CMR features of CP are present. Such features allow for differentiation of CP from restrictive cardiomyopathy, where the clinical differentiation between the 2 can often be challenging.
Keywords: constrictive pericarditis, restrictive cardiomyopathy, cardiovascular magnetic resonance, pericardium
Cardiovascular magnetic resonance (CMR) provides high-resolution imaging of the pericardium and associated structures in any imaging plane.1 CMR has a high diagnostic accuracy and provides imaging with high signal-to-noise ratio for the definitive noninvasive diagnosis of constrictive pericarditis (CP). Its unrestricted field of view allows for imaging of intrathoracic cavity structures, allowing for differentiation of CP from restrictive cardiomyopathy (RC),2 where the clinical differentiation between the 2 can often be challenging.
PERICARDIAL ANATOMY AND FUNCTION
The pericardium is essentially a double-walled, flexible membrane that is made up of fibrous (superficial) and serous (deep) layers.3 Two main components of the pericardial serosa are the parietal pericardium that adheres to the superficial fibrosa and the visceral pericardium that adheres to the surface of the heart. Approximately 15 to35 mL of fluid that consists of a combination of blood plasma ultrafiltrate and cardiac lymph separates the parietal and visceral pericardium. However, with pericardial inflammation, the nature and amount of this pericardial fluid can change.3,4 Indeed, the pericardium minimizes cardiac friction and serves as a barrier to the spread of contiguous inflammation as well as infiltrative disease from adjacent structures. Pericardial constraint maintains normal cardiac chamber pressures and dimensions by limiting atrial and ventricular overdistension, particularly of the rigid, less muscular right ventricle and atrium.3,4 Thus, an efficient cardiac cycle is preserved.
CONSTRICTIVE PERICARDITIS
CP occurs when normal left ventricular diastolic filling is impeded by a nonelastic, thickened, fibrotic, often calcified, pericardium.3,4 CP usually involves the parietal pericardial layer but can frequently affect the visceral layer also.3 A common precipitant is acute pericarditis; however, all forms of pericardial inflammation may lead to some form of constrictive pathophysiology (Table 1).3 In most cases, the inflammatory cascade associated with pericarditis may evoke a pericardial effusion and precipitate its organization amid a symphony of inflammatory mediators. The vicious cycle of subsequent fibrin deposition, further inflammation and effusion, ultimately leads to chronic fibrotic scarring, calcification, and impaired ventricular filling.3
TABLE 1.
Common Causes of Constrictive Pericarditis
| Idiopathic–nearly half of cases |
| Post viral pericarditis |
| Tuberculosis–15% of cases in developed nations |
| Postsurgical |
| Prior mediastinal radiation therapy |
| Chronic renal failure treated with hemodialysis |
| Connective tissue disorders |
| Neoplastic pericardial infiltration |
| Purulent pericarditis |
| Fungal and Parasitic Infections |
| After pericarditis associated with acute myocardial infarction |
| After postmyocardial infarction (Dressler) syndrome |
| In association with pulmonary asbestosis |
With a constrictive pathophysiology, the jugular venous pressure is elevated, often with prominent x and y descents. A Kussumaul’s sign may be present, although its presence is nonspecific and may also be observed in right ventricular compromise, such as failure, RC, infarction, and with tricuspid stenosis.4 Peripheral edema is, therefore, common, and with chronicity, symptoms that result from chronic hepatic congestion ie, hepatomegaly, prominent hepatic pulsations, ascites, spider angiomata, and palmar erythema, may also be present. Progressive impairment in ventricular filling leads to continued compromise of blood pressure and cardiac function. Thus, the apical impulse is often impalpable, and the patient may have distant or muffled heart sounds.3,4 A pericardial “knock” which is an abnormal, early diastolic (high-pitched) sound that corresponds to the sudden cessation of ventricular early diastolic filling (ie, an “early S3”) may also be present. The limited cardiac output typically presents as exercise intolerance and heart failure (while the lungs remain clear) and may progress to cardiac cachexia with muscle wasting.3,4 Patients with CP are more likely to have left-sided or bilateral pleural effusions than isolated right-sided effusions.5
IMAGING THE PERICARDIUM WITH CARDIOVASCULAR MAGNETIC RESONANCE
CMR assessment provides excellent visualization of the pericardium in most patients. Although the visceral layer is too thin for clear visualization by virtually any imaging modality, normal pericardium, which is essentially the fibrous and parietal pericardial components, is often clearly defined on T1-weighted spin echo sequences as a low-signal intensity circumferential layer that often lies between high-signal intensity mediastinal and epicardial fat or intermediate-signal intensity myocardium.6,7 As such, enhanced differentiation of the pericardium from the myocardium with T1-weighted spin echo sequences during CMR assessment is facilitated by the presence of epicardial fat or pericardial fluid.7 Although autopsy specimens have shown that normal pericardium ranges between 0.5 and 1 mm in thickness,8 on CMR assessment, the normal pericardium may appear as thick as 4 mm.6,9 This is largely due to partial volume averaging, cardiac motion, inclusion of pericardial fluid, and chemical shift artifacts.6 Pericardial definition is often most prominent adjacent to the right ventricular free wall, at the right atrioventricular groove, and the inferior as well as the apical aspect of the left ventricle.6,10
CARDIOVASCULAR MAGNETIC RESONANCE IN CONSTRICTIVE PERICARDITIS
The versatility of CMR in qualitative and quantitative assessment of CP in any arbitrary oblique cardiac plane is second to none.1,6 CMR enables excellent anatomic delineation of the pericardium from adjacent tissue and thus, not only is able to define pericardial thickness but also effectively characterizes features that represent a constrictive physiology.6,11 Its unrestricted imaging field enables assessment of coexisting and associated mediastinal as well as pulmonic abnormalities. It has superior tissue contrast and spatial resolution compared with echocardiography.1,5 Although computed tomography may provide better spatial resolution and detects pericardial calcification accurately, CMR avoids the need for iodinated contrast agents, ionizing radiation, or additional image processing.
Key features that are associated with CP on CMR are noted in Table 2. When the pericardium measures >4 mm, it is considered thickened. Such thickening on CMR produces a signal intensity that is equal to that of the myocardium, often as a dark, low-intensity signal stripe (Fig. 1).6,10 Characteristic fibrocalcific pericardial abnormalities and change in pericardial contour may also be observed.
TABLE 2.
Common Features on Cardiovascular Magnetic Resonance Assessment Associated with Constrictive Pericarditis
| Pericardial thickness ≥4 mm, denoted as a dark, low-intensity signal stripe often with distinct fibrocalcific irregularities |
| Elongated, narrowed right ventricle, sometimes described as “tubing of the right ventricle” |
| Right and often, biatrial enlargement |
| Sigmoid-shaped intraventricular septum with abnormal motion |
| Inferior vena cava plethora (and hepatic venous congestion) |
| Pericardial contrast enhancement after intravenous gadolinium-DTPA, where early enhancement suggests associated pericardial inflammation and late enhancement suggests pericardial scar (specific patterns may denote specific etiologies such as that with tuberculous pericarditis) |
| Myocardial tagging showing lack of change in the grid, suggesting tight adhesion between the pericardium and the underlying myocardium |
FIGURE 1.
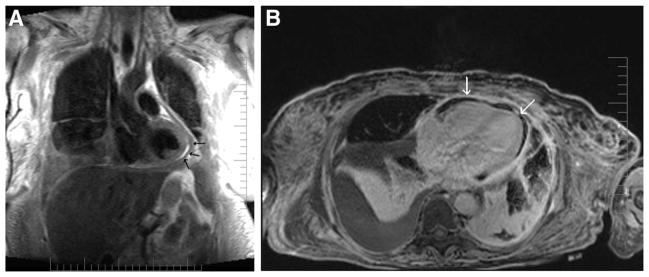
A, T1-weighted turbo spin echo sequence showing hyper-intense (bright) epicardial and pericardial fat that helps delineate the hypointense (dark) pericardium (arrows). B, The pericardium appears bright (arrows) in contrast to the nulled signal of the epicardial and pericardial fat in a T1-weighted fat suppressed gradient echo sequence. Precise delineation of the pericardium can be obtained by combining both T1-weighted TSE and a T1-weighted fat suppressed gradient echo sequence.
Basic Imaging Sequences
T1-weighted sequence is often the first of the imaging sequences used in evaluating CP.6 Its “black-blood” CMR images, where the signal from flowing blood is suppressed while that from stationary blood is optimized, is essential in delineating cardiac structures.12 Because of the virtually unrestricted field of view that CMR provides, mediastinal and pulmonic structures can also be clearly visualized (Fig. 1A).13 This is very important because pericardial disease may be associated with abnormalities in these adjacent structures.3,6 With the use of sequential gradient echo cine T1- and T2-weighted imaging sequences in matching slice locations, “bright blood” images, where the signal from flowing blood is optimized while signal from stationary blood is suppressed, further definition on pericardial structure and its associated hemodynamic effects on the cardiac chambers can be assessed.6,14,15 The differentiation of image contrast proportionate to the T2/T1 ratios enables tissue differentiation between those with a high ratio (appearing bright), such as blood, fluid and fat, and tissues with low T2/T1 ratios (appearing dark), such as muscle and myocardium.6 This is the fundamental concept in the delineation of the pericardium, pericardial and epicardial fat, and pericardial fluid on a single sequence (Fig. 1).
Contrast Imaging
As pericardial inflammation often presents in concert with myocardial inflammation as a perimyocarditis,3,4 although rare with CP, particularly when chronic, CMR imaging with paramagnetic contrast agents may be useful.6,16 Administration of intravenous gadolinium-DTPA (diethyltriaminepentaacetic acid) may help further delineate the pericardial-myocardial interface and demonstrate pericardial inflammation16 (Table 2; Fig. 2). Because enhancement of the pericardium (or any mesothelial lining) is often most conspicuous during the early stages of gadolinium-DTPA administration, nondelayed, early CMR imaging (60–90 seconds postgado-linium-DTPA) without any inversion preparatory pulse to null the myocardium may be used as the sequence of choice to assess pericardial inflammation. However, with pericardial disease or inflammation, especially during the acute stage, where evolutionary ECG changes occur, it is almost certain that in actual fact a perimyocarditis has occurred. This is simply because the pericardium itself is devoid of the capability of inducing such depolarization changes. Therefore, steady-state free-procession inversion recovery images with gadolinium-DTPA may also be useful to demonstrate the presence of late-gadolinium enhancement in the myocardium,17 which denotes myocardial scarring18 where characteristic patterns of its distribution can help differentiate myocarditis from myocardial infarction.19 In this respect, T2-weighted sequences may also be added to complement assessment of myocardial edema that may be associated with the inflammatory process.20 Certain characteristic patterns of late enhancement may also help in determining the etiology of the constrictive physiology, such as with tuberculous pericarditis.21
FIGURE 2.
Gadolinium-enhanced CMR demonstrating uniform hyperenhancement (bright) of the thickened parietal and visceral pericardia (arrows).
Myocardial Tagging
Although cine imaging provides superior information on cardiac motion and wall thickness compared with that of echocardiography, gated-myocardial perfusion scanning, or computed tomography, its yield for information on cardiac rotational and deformational motion is low. CMR myocardial tagging uses a grid-like pattern of saturated areas over a certain imaged slice and allows for the study of the deformation of the grid over time. As such, a CMR myocardial tagging sequence can be used to evaluate adherence and immobility of the pericardial–myocardial interface (Fig. 3; Table 2).22
FIGURE 3.
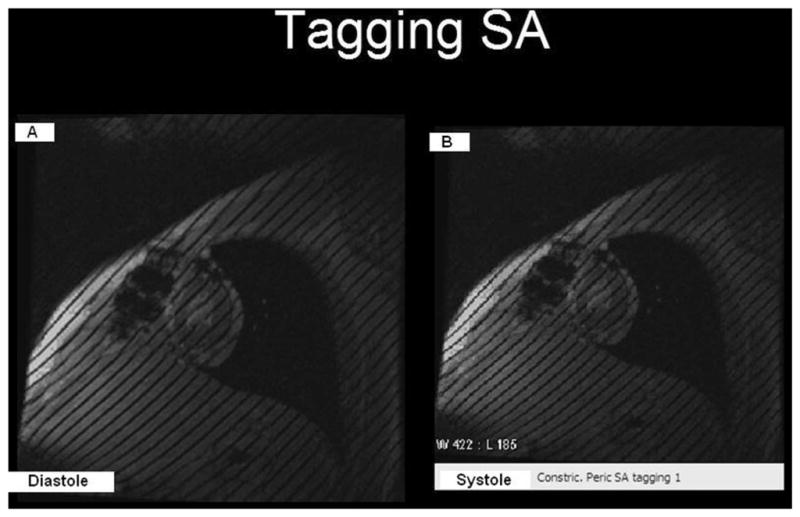
Tagged grids with 8-mm-wide spacing that were generated at (A) end-diastole and (B) at end-systole, where they remained unchanged. The lack of change indicates tight adhesions between the pericardium and the underlying myocardium, suggesting a constrictive physiology. Note: Fluid and fat do not “hold” tags.
Phase Encoding
Impaired diastolic ventricular filling in CP is a result of increased rigidity and poor distensibility of a fibrocalcific pericardium.3,4 Qualitative hemodynamic assessments of the right atrium and ventricle in relation to distention of the great cardiac veins can provide important clues that help enhance the diagnostic yield of CMR for CP.6,15 As such, the abrupt restriction of ventricular filling that is often noted with CP can be quantified with CMR by assessing ventricular volume over time. CMR phase-encoding velocimetry can accurately assess forward flow and the rate of blood return from the (superior) vena cava during ventricular systole to help in the diagnosis of CP (Figs. 4 and 5).15,23 By plotting a phase-velocity map, characteristic features that differentiate shared patterns of ventricular diastolic impairment, such as that commonly noted with RC, can be used (Figs. 4 and 5).
FIGURE 4.
Gradient-echo time-volume curve analysis demonstrating abrupt limitation in late, diastolic ventricular filling after rapid, early ventricular filling with constrictive pericarditis. Note: Left and right ventricular function should be modestly preserved for analysis. From CB Higgins, Ingwall JS, Pohost G, et al. Current and Future Applications of Magnetic Resonance in Cardiovascular Disease. Armonk, NY: Futura; 1998.
FIGURE 5.
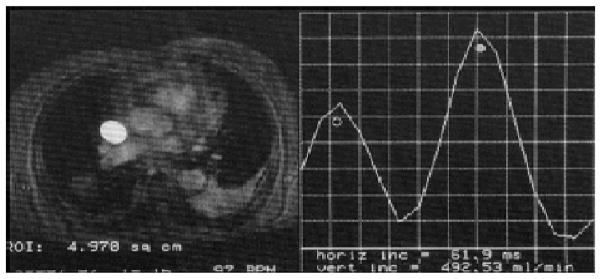
Phase-encoded velocity mapping for superior vena cava flow analysis showing decrease in peak flow in systole (open circle) relative to that in diastole (closed circle) noted with constrictive pericardial disease. From CB Higgins, Ingwall JS, Pohost G, et al. Current and Future Applications of Magnetic Resonance in Cardiovascular Disease. Armonk, NY: Futura; 1998.
SPECIAL CONSIDERATIONS
Effusive Constrictive Pericarditis
Effusive CP was first described when patients presenting with cardiac tamponade were noted to have poor resolution of their elevated right atrial pressure despite adequate removal of the excessive collection of pericardial fluid.3,4,24 Instead, after pericardiocentesis, the hemodynamics of these patients converted from those typical of cardiac tamponade to those of CP. Thus, a constrictive pathophysiology had also played a key role in significantly restricting cardiac filling in those patients. CMR imaging can quantitatively and qualitatively detect pericardial effusions.6,25 However, it can often be challenging to appropriately characterize small effusions with CMR. In moderate- to large-sized pericardial effusions, a high signal-intensity value on a T1-weighted spin-echo sequence that is similar to fat is suggestive of a chylous effusion. Transudates, due to the low protein content, have a lower T1 signal intensity, whereas exudates, which have high protein as well as cellular contents, produce high T1 signal intensity but low T2-weighted signal-intensities on spin-echo sequences.25
Restrictive Cardiomyopathy
In CP, because ventricular filling is determined by the limited pericardial volume and not by compliance of the cardiac chambers, where once the pericardial constraining volume is reached, diastolic ventricular filling ceases abruptly, equalization of the end-diastolic pressures occurs in all 4 cardiac chambers.3,4 A similar diastolic hemodynamic response may, however, be present with RC, such as amyloid, sarcoid, hemochromatosis, or other infiltrative diseases, where the cardiac chambers fail to appropriately accommodate necessary intracardiac pressure changes.26 It is important, however, to distinguish between CP and RC because patients with CP might benefit from pericardial stripping whereas those with RC obviously would not.27 The aforementioned phase-encoded imaging sequences can help in the otherwise often challenging differentiation between these clinical entities. In patients with CP, right ventricular systolic pressure increases during inspiration, whereas left ventricular systolic pressure decreases. The inverse occurs during expiration.3,4 Respiratory variations indicating increased ventricular interdependence have been shown to have a high sensitivity and specificity in differentiating CP from RC.28,29 In CP, there is a leftward inversion or flattening of the interventricular septum during early ventricular filling (Fig. 6).28–30 This pattern is not seen in patients with RC. Abnormal interventricular septal motion has been shown to yield a sensitivity of 81%, specificity of 100%, accuracy of 90%, positive predictive value of 100%, and negative predictive value of 83% in the detection of CP.28–30 The amount of ventricular coupling could further be evaluated by quantifying the difference in the maximal interventricular septal excursion between inspiration and expiration. This parameter (normalized to the end-diastolic biventricular dimension) has also been shown to be significantly greater with CP (20.0% ± 4.5%; P < 0.0001) than with RC, where a cutoff value of 11.8% enabled such differentiation.28–30
FIGURE 6.
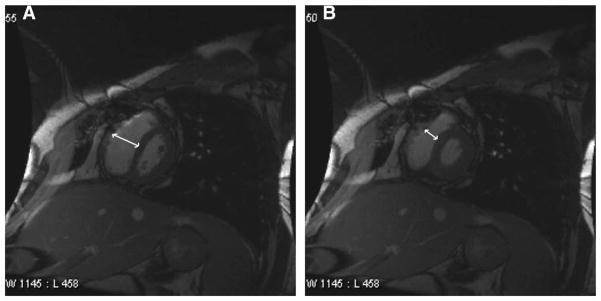
Respiratory-related paradoxical septal movement: A, septal inversion (flattening) noted during the onset of inspiration, where excursion occurs toward the left ventricle. B, Septal eversion noted during the onset of expiration, where excursion occurs toward the right ventricle.
Congenital
In certain congenital disorders such as Budd-Chiari syndrome where the classic triad of abdominal pain, ascites, and hepatomegaly may manifest in association with CP, CMR proves very useful.31 Compared with other diagnostic modalities such as echocardiography, CMR provides superior resolution and high signal-to-noise ratio in addition to an unrestricted field of view in any imaging plane that allows for extracardiac imaging.6 Moreover, congenital cardiac conditions that may or may not primarily involve the pericardium, such as the rare autosomal recessive disorder, Mulibrey Nanism syndrome (Perheentupa syndrome), often coexist as part of the syndrome that can affect extracardiac structures that may be difficult to optimally characterize with certain modalities.4,32 In addition, in such patients, CMR provides accurate and complete qualitative and quantitative assessment after pericardiectomy.32
LIMITATIONS OF CARDIOVASCULAR MAGNETIC RESONANCE
The need for cardiac gating, where sequential image CMR slices are acquired over a number of regular heartbeats, can become an issue in the setting of supraventricular arrhythmias. Therefore, atrial fibrillation, which may accompany pericardial diseases such as CP, can affect image quality. In addition, CMR imaging uses breath-holding techniques, which help reduce respiratory and peristaltic motion artifacts.12 This could be a challenge for those who are unable to hold their breaths, especially given the fact that in advanced cases of CP, dyspnea at rest is a hallmark feature. However, respiratory-gated sequences that restrict image acquisition to the relatively motionless end-expiratory phase of breathing can minimize such motion artifacts.12,23 In addition, the navigator echo system, with the navigator column usually positioned at the right hemidiaphragm to avoid interference with main cardiac structures, can also be used.32 With this system, prospective image slice position correction is enabled based on Fourier-reconstruction projections that display a moving object such as the diaphragm as a function of time. Metallic devices, cardiac implants and surgical coils, or wires may also induce signal-void artifacts that affect the high-quality image, in addition to causing device heating in some cases.33 However, these affect image acquisition only minimally at most, and seldom affect complete imaging of the pericardium to assess for CP.
CONCLUSIONS
CR allows for complete evaluation of the pericardium where high-resolution images of the pericardium and associated structures can be easily obtained in any imaging plane unlike that provided by other imaging modalities. CMR, therefore, has a high diagnostic accuracy for CP. Specific CMR sequences can be prescribed and tailored to answer the clinical questions pertaining to CP, where the yield for diagnosis has been proven when characteristic CMR features that are associated with CP are present. The versatility of CMR imaging for CP not only enables accurate, noninvasive, quantitative and qualitative assessment of the pericardium and its associated structures, but also facilitates differentiation from a restrictive physiology that could be challenging clinically.
Acknowledgments
The authors thank Maureen Kuppe, CAS, for assistance with preparation of the figures.
References
- 1.Manning WJ, Pennell DJ. Cardiovascular Magnetic Resonance. London, UK: Churchill Livingstone; 2002. [Google Scholar]
- 2.Olson MC, Posniak HV, McDonald V. Computed tomography and magnetic resonance imaging of the pericardium. Radiographics. 1989;9:633–649. doi: 10.1148/radiographics.9.4.2756190. [DOI] [PubMed] [Google Scholar]
- 3.Spodick DH. Pericardial diseases. In: Braunwald E, Zipes DP, Libby P, editors. Heart Disease: A Textbook of Cardiovascular Medicine. 6. Philadelphia, PA: WB Saunders Co; 2001. pp. 1823–1870. [Google Scholar]
- 4.Shabetai R. Diseases of the pericardium. In: Hurst JW, Schlant RC, Alexander RW, editors. The Heart: Arteries and Veins. 8. New York, NY: McGraw-Hill; 1994. pp. 1654–1662. [Google Scholar]
- 5.Weiss JM, Spodick DH. Association of left pleural effusion with pericardial disease. N Engl J Med. 1983;308:696–697. doi: 10.1056/NEJM198303243081205. [DOI] [PubMed] [Google Scholar]
- 6.Al-Mallah M, Kwong RY. Assessing pericardial disease with CMR. In: Kwong RY, editor. Cardiovascular Magnetic Resonance Imaging. Totowa, NJ: Humana Press; 2007. pp. 467–490. [Google Scholar]
- 7.Breen JF. Imaging of the pericardium. J Thorac Imaging. 2001;16:47–54. doi: 10.1097/00005382-200101000-00007. [DOI] [PubMed] [Google Scholar]
- 8.Spodick DH. Pericardial macro- and microanatomy: a synopsis. In: Spodick DH, editor. The Pericardium: A Comprehensive Textbook. New York, NY: Marcel Dekker; 1997. pp. 7–14. [Google Scholar]
- 9.Sechtem U, Tscholakoff D, Higgins CB. MRI of the abnormal pericardium. Am J Roentgenol. 1986;47:245–252. doi: 10.2214/ajr.147.2.245. [DOI] [PubMed] [Google Scholar]
- 10.Higgins CB. Acquired heart disease. In: Higgins CB, Hricak H, Helms CA, editors. Magnetic Resonance Imaging of the Body. Philadelphia, PA: Lippincott-Raven; 1997. pp. 409–460. [Google Scholar]
- 11.Kovanlikaya A, Burke LP, Nelson MD, et al. Characterizing chronic pericarditis using steady-state free-precession cine MR imaging. Am J Roentgenol. 2002;179:475–476. doi: 10.2214/ajr.179.2.1790475. [DOI] [PubMed] [Google Scholar]
- 12.Pettigrew RI. Dynamic cardiac MR imaging: technique and application. Radiol Clin North Am. 1989;27:1187–1203. [PubMed] [Google Scholar]
- 13.Pettigrew RI, Oshinski JN, Chatzimavroudis G, et al. MRI techniques for cardiovascular imaging. J Magn Reson Imaging. 1999;10:590–601. doi: 10.1002/(sici)1522-2586(199911)10:5<590::aid-jmri2>3.0.co;2-s. [DOI] [PubMed] [Google Scholar]
- 14.Axel L. Blood flow effects in magnetic resonance imaging. Am J Roentgenol. 1984;143:1157–1166. doi: 10.2214/ajr.143.6.1157. [DOI] [PubMed] [Google Scholar]
- 15.Gatehouse PD, Keegan J, Crowe LA, et al. Applications of phase-contrast flow and velocity imaging in cardiovascular MRI. Eur Radiol. 2005;15:2172–2184. doi: 10.1007/s00330-005-2829-3. [DOI] [PubMed] [Google Scholar]
- 16.Matsouka H, Hamada M, Honda T, et al. Evaluation of acute myocarditis and pericarditis by Gd-DTPA enhanced magnetic resonance imaging. Eur Heart J. 1994;15:283–289. doi: 10.1093/oxfordjournals.eurheartj.a060489. [DOI] [PubMed] [Google Scholar]
- 17.Taylor AM, Dymarkowski S, Verbeken EK, et al. Detection of pericardial inflammation with late-enhancement cardiac magnetic resonance imaging: initial results. Eur Radiol. 2006;16:569–574. doi: 10.1007/s00330-005-0025-0. [DOI] [PubMed] [Google Scholar]
- 18.Mahrholdt H, Wagner A, Judo RM, et al. Delayed enhancement cardiovascular magnetic resonance assessment of non-ischaemic cardiomyopathies. Eur Heart J. 2005;26:1461–1474. doi: 10.1093/eurheartj/ehi258. [DOI] [PubMed] [Google Scholar]
- 19.Mahrholdt H, Goedecke C, Wagner A, et al. Cardiovascular magnetic resonance assessment of human myocarditis: a comparison to histology and molecular pathology. Circulation. 2004;109:1250–1258. doi: 10.1161/01.CIR.0000118493.13323.81. [DOI] [PubMed] [Google Scholar]
- 20.Abdel-Aty H, Boyé P, Zagrosek A, et al. Diagnostic performance of cardiovascular magnetic resonance in patients with suspected acute myocarditis: comparison of different approaches. J Am Coll Cardiol. 2005;45:1815–1822. doi: 10.1016/j.jacc.2004.11.069. [DOI] [PubMed] [Google Scholar]
- 21.Hayashi H, Kawamata H, Machida M, et al. Tuberculous pericarditis: MRI features with contrast enhancement. Br J Radiol. 1998;71:680–682. doi: 10.1259/bjr.71.846.9849395. [DOI] [PubMed] [Google Scholar]
- 22.Kojima S, Yamada N, Goto Y. Diagnosis of constrictive pericarditis by tagged cine magnetic resonance imaging. N Engl J Med. 1999;341:373–374. doi: 10.1056/NEJM199907293410515. [DOI] [PubMed] [Google Scholar]
- 23.Higgins CB, Ingwall JS, Pohost G, editors. Current and Future Applications of Magnetic Resonance in Cardiovascular Disease. Armonk, NY: Futura; 1998. [Google Scholar]
- 24.Hancock EW. Subacute effusive-constrictive pericarditis. Circulation. 1971;43:183–192. doi: 10.1161/01.cir.43.2.183. [DOI] [PubMed] [Google Scholar]
- 25.Zagol B, Minderman D, Munir A, et al. Effusive constrictive pericarditis: 2D, 3D echocardiography and MRI imaging. Echocardiography. 2007;24:1110–1114. doi: 10.1111/j.1540-8175.2007.00505.x. [DOI] [PubMed] [Google Scholar]
- 26.Masui T, Finck S, Higgins CB. Constrictive pericarditis and restrictive cardio-myopathy: evaluation with MR imaging. Radiology. 1992;182:369–373. doi: 10.1148/radiology.182.2.1732952. [DOI] [PubMed] [Google Scholar]
- 27.Ling LH, Oh JK, Schaff HV, et al. Constrictive pericarditis in the modern era: evolving clinical spectrum and impact on outcome after pericardiectomy. Circulation. 1999;100:1380–1386. doi: 10.1161/01.cir.100.13.1380. [DOI] [PubMed] [Google Scholar]
- 28.Hurrell DG, Nishimura RA, Higano ST, et al. Value of dynamic respiratory changes in left and right ventricular pressures for the diagnosis of constrictive pericarditis. Circulation. 1996;93:2007–2013. doi: 10.1161/01.cir.93.11.2007. [DOI] [PubMed] [Google Scholar]
- 29.Giorgi B, Mollet NR, Dymarkowski S, et al. Clinically suspected constrictive pericarditis: MR imaging assessment of ventricular septal motion and configuration in patients and healthy subjects. Radiology. 2003;228:417–424. doi: 10.1148/radiol.2282020345. [DOI] [PubMed] [Google Scholar]
- 30.Francone M, Dymarkowski S, Kalantzi M, et al. Assessment of ventricular coupling with real-time cine MRI and its value to differentiate constrictive pericarditis from restrictive cardiomyopathy. Eur Radiol. 2006;16:944–951. doi: 10.1007/s00330-005-0009-0. [DOI] [PubMed] [Google Scholar]
- 31.Betti A, Vittori O, Vezzoli G. Diagnostic imaging of Budd-Chiari syndrome in adults and children. Radiol Med (Torino) 1990;79:70–76. [PubMed] [Google Scholar]
- 32.Kivistö S, Lipsanen-Nyman M, Kupari M, et al. Cardiac involvement in Mulibrey nanism: characterization with magnetic resonance imaging. J Cardiovasc Magn Reson. 2004;6:645–652. doi: 10.1081/jcmr-120038085. [DOI] [PubMed] [Google Scholar]
- 33.•••


