Abstract
Two-state models often provide an reasonable approximation of protein behaviors such as partner binding, folding, or conformational changes. Many different techniques have been developed to determine the population ratio between two states as a function of different experimental conditions. Data analysis is accomplished either by fitting individual measured spectra to a linear combination of known basis spectra, or alternatively by decomposing the entire set of spectra into two components using a least-squares optimization of free parameters within an assumed population model. Here we demonstrate that it is possible to directly determine the population ratio in a two-state system directly from data without an a priori model for basis spectra or populations by applying physical constraints iteratively to a Singular Value Decomposition of optical fluorescence, x-ray scattering, and electron paramagnetic resonance data.
I. INTRODUCTION
Singular Value Decomposition (SVD) is commonly used to break down two-dimensional data sets for data compression and analysis [1]. The popularity of this method for analyzing biophysical data has been driven by a combination of improved data collection techniques enabling rapid acquisition of a full spectrum, rather than a single data point, along with the widespread availability of the SVD computational algorithim. The primary use of SVD in analyzing these measurements is to determine the number of basis spectra (states) present within a set of measurements by inspection of the singular values which are returned by the factorization
| (1) |
where the entire data set is arranged into a single rectangular mxn matrix A consisting of m spectral data points and n conditions. U is an mxm unitary matrix containing the basis spectra, VT is an nxn unitary matrix containing the populations in each basis spectra, and S is a diagonal mxn matrix whose elements are referred to as the singular values of A. The singular values are arranged in decreasing size such that the later elements provide a diminishing contribution to A. If a two-state approximation is adequate to describe the data set, the third and higher singular values will be negligible; setting these to zero and truncating U, S, and VT results in a compressed representation of A with reduced noise.
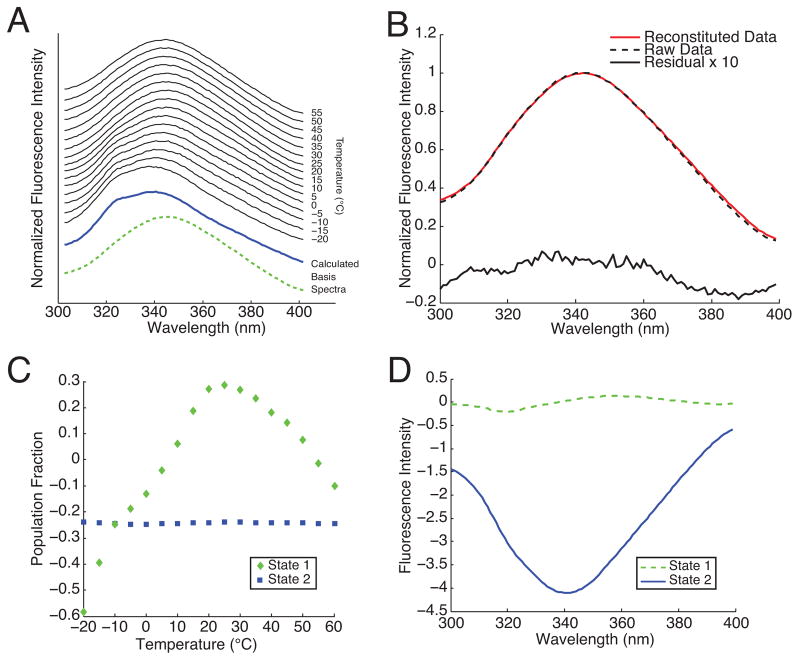
Unfortunately, the basis spectra U and the population fractions VT generated by SVD do not directly correspond to the spectra of real states. For instance, Fig. 1 shows the basis spectra and populations resulting from SVD of tryptophan fluorescence emission data on thermally denatured cytochrome c protein. Although truncation to the first two singular values still yields an accurate reconstitution of the original data, the basis spectra include negative fluorescence intensities and the populations do not add up to one.
FIG. 1.
(A) Fluorescence emission of cytochrome c protein excited at 200 nm as a function of temperature. Each individual spectrum has been normalized to its peak intensity. The calculated basis spectra were generated using the new technique presented here. (B) Example reconstituted data (shown for 35 °C) using the first two singular values. (C) Population VT corresponding to each basis function obtained from SVD. (D) Basis spectra U obtained from SVD. Neither the populations in (C) nor the spectra in (D) have a straightforward physical interpretation.
This difficulty can be resolved by finding the proper rotation of the basis spectra U that results in physically realistic spectra and populations. Most recent work (for example, [2]) has followed the procedure of Henry and Hofrichter [1] in refining the data against a population model with a minimum number of free parameters. For instance in the two-state folding data shown, the folded population at each temperature might be determined by optimizing a ΔG between the folded and unfolded states. Essentially, a new linear combination of the populations is found that fits the chosen model, and this in turn is used to calculate a corresponding linear combination of basis spectra.
Instead, here we show that it is possible to arrive at the proper basis rotation in a model-independent manner by directly enforcing a two-state decomposition along with a minimal set of physical constraints. Our approach is motivated by the development of Non-negative Matrix Factorization, or NMF and related methods [3–6] which generate positive populations and basis functions. Our technique has several additional advantages over NMF for biophysical data analysis: first, the populations are normalized to a two-state model, second, the positivity constraint does not need to be applied to the data in all situations (as shown in Sec. V), and third, other types of physical constraints can be readily implemented for application to different techniques.
II. CONSTRAINED SVD
We begin by choosing an initial guess at a population model, Ṽ; however the choice is arbitrary as long as the guess populations are real and normalized, i.e. add up to unity at each condition. This initial guess is used to calculate new basis spectra
| (2) |
These Ũ should be forced to fit any required physical constraints. For instance, if the data consists of measured intensities the basis spectra should be made positive
| (3) |
and normalized to the peak intensity
| (4) |
before being used to reconstitute the data
| (5) |
The new à will likely be a poor representation of the original data unless the initial population guess was very accurate. The difference can be used to update the population guess
| (6) |
The updated population guess should also be made positive
| (7) |
and normalized so that the two populations add to one at each condition n
| (8) |
before being inserted into Eq. 2 after which the procedure should be repeated until the calculated and original data fall within a numerical tolerance. The consequences of limited data sets, noise, and truncation to only two singular values have been reviewed elsewhere [1].
III. ANALYSIS OF CYTOCHROME C PROTEIN TRYPTOPHAN FLUORESCENCE DATA
The results of applying this new method to the same tryptophan fluorescence data is shown in Fig. 2. The final rotated basis functions allow clear identification of the spectral signature of folded (single-peak) and unfolded protein at under both warm- and cold- denatured conditions. Fewer than 100 iterations were necessary to recapitulate the original data to within a numerical discrepancy equal to or less than that of the original two-component SVD using randomized initial guess populations. Tryptophan fluorescence used in this manner provides a local probe of protein structure. The two basis spectra in Fig. 2 should represent pure states of the protein conformation under the chemical conditions chosen for these measurements. These do not necessarily correspond to pure states of the tryptophan molecule. Notably, neither unconstrained SVD nor NMF yield normalized, physically realistic basis spectra for this dataset.
FIG. 2.
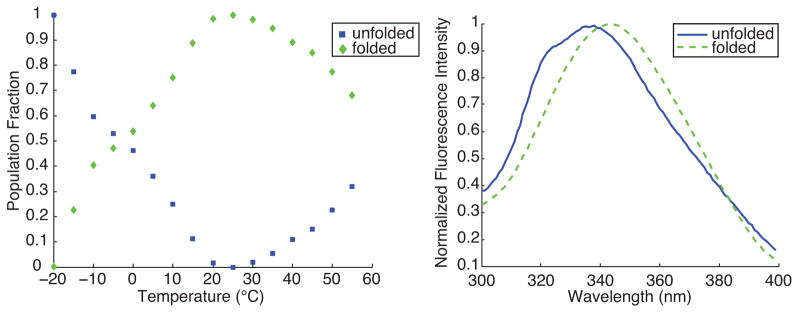
Constrained two-state decomposition of the same tryptophan fluorescence emission data as shown in Fig. 1 into normalized populations (left) and basis spectra (right).
IV. ANALYSIS OF CYTOCHROME C PROTEIN SAXS DATA
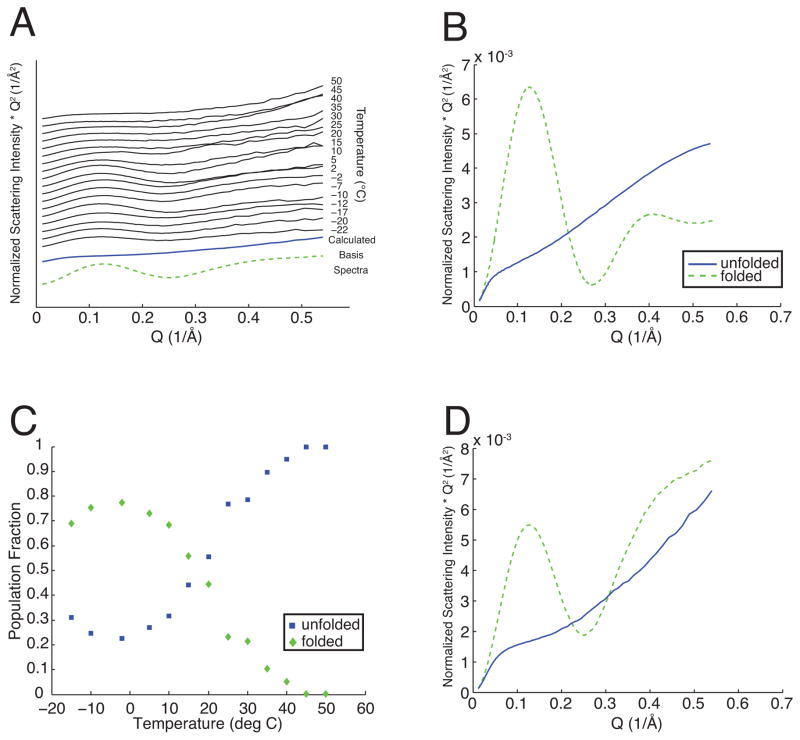
We have also conducted Small-Angle X-ray Scattering (SAXS) measurements on this same protein preparation under nearly identical conditions to demonstrate that the algorithm also can be used to determine the global structure of the protein molecule’s constitutive states from mixture data. Synchrotron SAXS images at each condition were azimuthally averaged, background subtracted, and are displayed in Fig. 3 as Kratky plots [7].
FIG. 3.
Constrained two-state decomposition of SAXS data (A) from the same protein samples as in Fig. 2 into normalized populations (C) and normalized basis spectra (D). Theoretical basis spectra corresponding to folded (dashed line) and unfolded (solid line) states are shown for comparison in (B).
The SAXS decomposition differs from the fluorescence decomposition for two reasons. Previous studies [8] have determined different stability regions for both chemically and warm-denatured cytochrome c when measured using SAXS as opposed to optical methods. Although both experimental techniques show cold as well as warm denaturation in our data, the stability region is different when viewed from the perspective of a single local probe in Fig. 2 (10 to 60 °C) as opposed to the global structural measurement of Fig. 3 (−20 to 20 °C). Due to the lack of any population model, constrained SVD provides an unbiased comparison between these two types of measurement. Fluorescence gives different information from SAXS due to the particular choice of fluorescent probe, its placement, and the local environment. It is also possible that additional states are present beyond just folded and unfolded protein. While local structural probes such as fluorescence generally can be interpreted with a two-state model, SAXS is sensitive to all of the different conformations present in the sample solution. Therefore, in our two-state decomposition, the SAXS basis functions may be interpreted as structures of the two most common components in this set of measurements rather than purely native versus denatured states.
The unfolded basis function in Fig. 3D exhibits an x-ray scattering pattern similar to a worm-like chain (WLC) while the folded structure has the double-humped scattering pattern characteristic of a sphere. This suggests a direct comparison with theoretical scattering curves for the pure unfolded and folded protein which are shown in Fig. 3B. The folded protein scattering curve was calculated directly [9] from crystal structure (PDB ID#1HCRC [10]). To model the unfolded protein we choose to use the WLC model of Kratky and Porod [11] for which there is an analytical expression for the x-ray scattering intensity in the small-angle regime [12]. This model is parameterized by a contour length and a persistence length which have been previously estimated [13] as 355 Å and 18.1 Å, respectively. There is good qualitative agreement between these theoretical scattering curves in Fig. 3B and the constrained SVD generated basis functions in Fig. 3D. In particular, the local minima in the folded protein Kratky plots are nearly identical (Q = 0.28 Å−1), indicating that the the folded basis spectra should have both a size and shape similar to the crystal structure. Furthermore, the inflection point between the high and low slopes of the unfolded protein in the Kratky plots also occur at nearly the same angle (Q = 0.06 Å−1), indicating that the persistence lengths are very similar. For both states, the SAXS data shows higher scattering intensity at large angles than the theoretical calculations; this may be due to poorer counting statistics in the original data set at these angles or additional short length-scale conformational flexibility not represented in the crystal structure and WLC models. Importantly, and unlike previous work [2], these basis scattering functions were determined without the use of any model whatsoever.
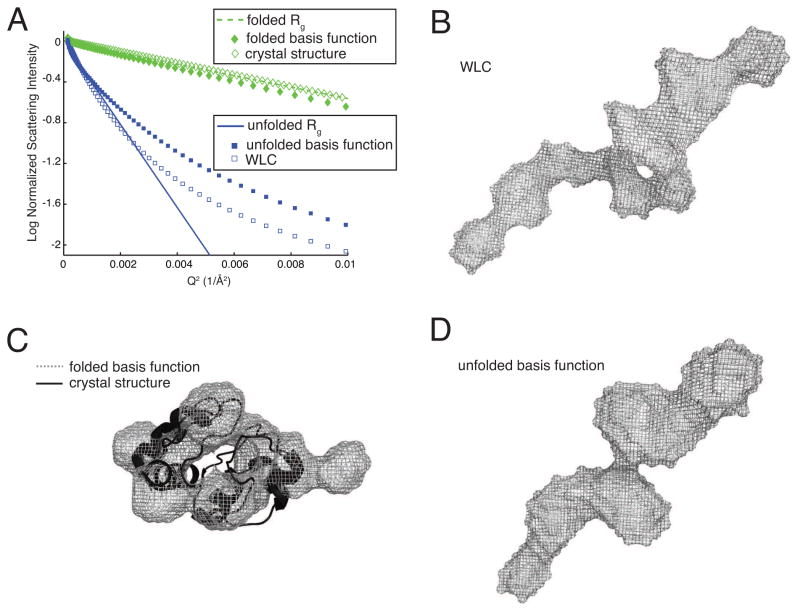
For some proteins, it can be difficult to prepare homogenous samples for the purposes of solution structure determination via SAXS. Interpretation of such scattering data generally requires knowledge of at least one of the isolated protein’s scattering patterns. We show in Fig. 4 that constrained SVD applied to this data set yields a basis function for folded cytochrome c that corresponds reasonably well to the three dimensional structure of the folded protein. The basis function for unfolded cytochrome c also resembles the WLC in three dimensions. Fig. 4A presents the results of a Guinier analysis [7] of the theoretical scattering functions described above compared to the calculated basis functions generated by constrained SVD. For compact spherical objects such as folded protein, the Guinier plot shows a straight line with downward slope proportional to the radius of gyration, Rg, of the particle out to a value Qmax < 1.3/Rg. For extended objects such as unfolded protein this relationship also holds, but only over a lower angular range. A comparison with literature values for the Rg of homogeneous folded and unfolded cytochrome c protein [14] show that the constrained SVD algorithm has properly identified the sizes of the folded and unfolded protein. Three dimensional reconstructions of the two basis functions were made using the ATSAS software package [15]. Using the values of Rg obtained from the Guinier analysis, maximum diameters, Dmax, of 48 Å and 150 Å were found for the folded and unfolded protein, respectively. Ten simultaneous reconstructions were aligned, averaged, and filtered to produce the structures shown in Fig. 4. The folded protein in Fig. 4C has been aligned with the crystal structure. The unfolded protein in Fig. 4D was found to have the same maximum diameter and a similar profile to the WLC model, which was analyzed in an identical manner and is displayed in Fig. 4B. These results indicate that protein envelope determination from heterogenous mixtures of unknown composition may be possible down to spatial resolutions of a few Ångstroms by combining model-independent constrained SVD with ab initio shape determination.
FIG. 4.
(A) Guinier plot comparing folded (diamonds) and unfolded (squares) protein. The basis functions are represented as solid shapes and the theoretical scattering patterns are represented as hollow shapes. The solid line corresponds Rg = 35 Å and the dashed line Rg = 13Å taken from [14]. (B) Reconstruction of the worm-like chain model with Dmax = 150Å. (C) Ribbon structure of cytochrome c aligned to reconstruction of the folded protein basis function with Dmax = 48Å. (D) Reconstruction of the unfolded protein basis function with Dmax = 150Å.
V. ANALYSIS OF EG5 PROTEIN EPR DATA
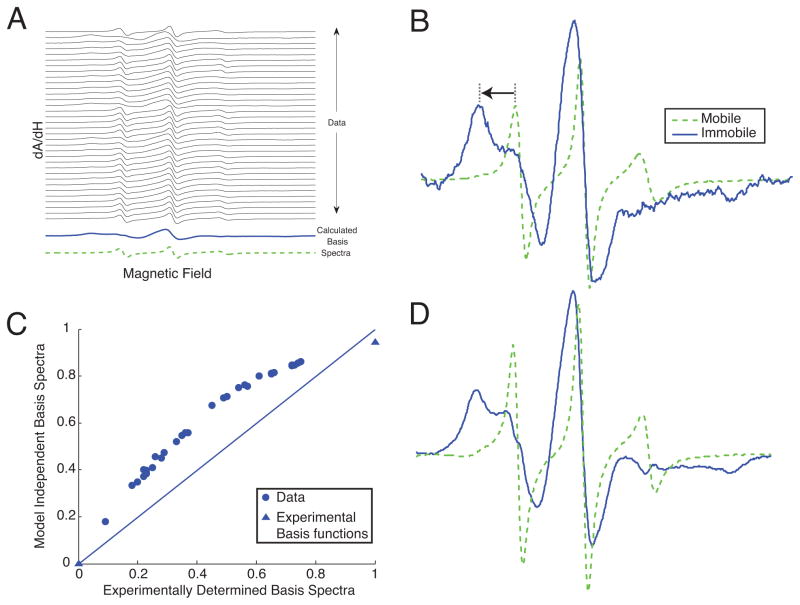
Unlike NMF, our algorithm can be used to treat data where the non-negativity constraint does not apply, while still obtaining physically meaningful basis spectra and populations. To demonstrate this property, we applied the new algorithm to the first-derivative (dA/dH), X-band electron paramagnetic resonance (EPR) spectra of spin-labeled Eg5 protein under several experimental conditions [16]. The different spectra were taken with or without microtubules, in the presence of a variety of different nucleotide analogs and drug inhibitors of Eg5, and at different temperatures. These changes in conditions induce shifts in the population of EPR probes in the two mobile and immobilized components, without significantly altering the components themselves. The EPR spectra shown all have the same probe, 4-maleimido-2,2,6,6-tetramethyl-1-piperidinyloxy (MSL, Sigma Aldrich, St. Louis, MO) conjugated to the same protein, Eg5. These different conditions induced shifts between two major spectral components of MSL conjugated to Eg5, one mobile and one more immobilized. Unlike the previous two examples, the non-negativity and normalization constraints on the basis spectra (Eqs. (3) and (4)) were removed while the constraints on the populations (Eqs. (7) and (8)) were maintained. Removal of these constraints increased the number of required iterations nearly ten-fold for some randomized initial population guesses, but the algorithm still converged on all attempts. The decompositions are shown in Fig. 5 along with independently experimentally determined basis spectra for this particular spin-probe system.
FIG. 5.
(A) EPR spectra of the Eg5 dimer under 32 different experimental conditions. (B) Experimentally determined basis functions from [16]. (C) Comparison of immobile fraction determined using a linear least-squares method [17] with the basis functions in (B) to those obtained from constrained two-state decomposition (D). The experimentally derived basis spectra were also decomposed and are shown as triangles. The straight line shows equal population estimates from both methods. Procedures for expression and purification of Eg5 protein, conjugation of the MSL probe, sample preparation, and acquisition of EPR data are described in [16].
Figure 5B shows the two experimentally determined basis spectra containing the highest amount of the mobile and immobile components. These experimentally-derived basis spectra were obtained empirically by varying the experimental conditions to favor one component or the other; the mobile basis spectrum was obtained by heating the ADP-bound Eg5 motor in solution to 30C and the immobilized spectrum was obtained by cooling the ADP·AlF4-bound Eg5 motor to 2C. The motion of an MSL probe covalently bound to Eg5 is spatially restricted by the adjacent protein surface. This results in broadening of the EPR spectral peaks. This is most easily visualized as an outward shift of the low-field peak of the immobilized spectrum relative to the mobile one, as depicted by the arrow in Fig. 5B. There is a corresponding outward shift of the high-field dip of the EPR spectrum that is observable for the immobile component but not for the mobile one. A greater splitting between the low-field peak and high-field dip of the EPR spectrum indicates a more immobilized EPR probe. As a useful first approximation to relate the low-field to high-field splitting in the magnetic field variable to the physical magnitude of the conformational change we are observing, EPR probe mobility can be modeled as unrestricted motion within a cone of revolution [18, 19]. The immobilized component of the spectra shown here corresponds to unrestricted probe motion within a cone of approximately 63, while the mobile component corresponds to motion within a cone of over 120.
The agreement between the constrained SVD and experimentally determined basis spectra is remarkable given the effort required to generate the experimental basis spectra using specially chosen nucleotide analogs and temperature conditions. In Fig. 5C, the populations determined by the decomposition are compared to those obtained by linear fitting of the data to experimentally determined basis functions [17]. The constrained decomposition appears to systematically overestimate the immobile fraction by ~ 10%. Alternatively, the experimentally determined immobile state shown as the triangle on the upper right of the figure may in fact be more immobilized than is physically realistic as it required measurement at a much lower temperature (2°C) than the remainder of the data.
VI. DISCUSSION
The constrained singular value decomposition approach may be applicable to situations in which the basis spectra are unknown or experimentally unobtainable. It may also be applied to kinetic processes such as pressure-jump [20] or rapid-mixing [21] protein folding to determine the population dynamics. Although the two-state decompositions presented here only required very simple constraints (non-negativity and normalization of populations and basis functions), it is anticipated that more complex data sets and decompositions into higher numbers of states will require additional constraints to uniquely converge. For instance, physical constraints specific to a particular experimental technique such as ortho-normalization, smoothness, or a complexity limit (e.g. number of peaks allowed in basis spectra) might also be applied to the Ũ. Future work will explore the generalization of our method to larger numbers of basis functions by implementing additional physical constraints, as well as the impacts of noise and incomplete data sets.
Acknowledgments
We thank C. Sindelar for his EPR data analysis program for comparison [17]. We also acknowledge M. Elmer, C. Asta, J. Marcus, and K. Butler for assistance with data collection; L. Jin for use of laboratory facilities; L. Guo for SAXS instrumentation and configuration; and N. Naber, A. Larson and C. Felix for assistance with collecting EPR spectra. Use of Argonne’s APS for SAXS data collection was supported by the U.S. DOE under Contract No. DE-AC02-06CH11357. SAXS measurements were conducted at BioCAT (APS 18ID), which is supported by grants from the NCRR (2P41RR008630-17) and the NIGMS (9 P41 GM103622-17) from the NIH. E.C. Landahl is supported by a DePaul University CSH FSRG. S.E. Rice is supported by NIH R01GM072656.
Contributor Information
Eric C. Landahl, Department of Physics, DePaul University, Chicago, Illinois
Sarah E. Rice, Department of Cell and Molecular Biology, Feinberg School of Medicine, Northwestern University, Chicago, Illinois.
References
- 1.Henry E, Hofrichter J. Methods in Enzymology. 1992;210:129. [Google Scholar]
- 2.Segel DJ, Fink AL, Hodgson KO, Doniach S. Biochemistry. 1998;37:12443. doi: 10.1021/bi980535t. [DOI] [PubMed] [Google Scholar]
- 3.Lawton WH, Sylvestre EA. Technometrics. 1971;13:617. [Google Scholar]
- 4.Ohta N. Analytical Chemistry. 1973;45:553. [Google Scholar]
- 5.Sasaki K, Kawata S, Minami S. Applied Optics. 1983;22:3599. doi: 10.1364/ao.22.003599. [DOI] [PubMed] [Google Scholar]
- 6.Lee DD, Seung HS. Nature. 1999;401:788. doi: 10.1038/44565. [DOI] [PubMed] [Google Scholar]
- 7.Glatter O, Kratky O, editors. Small-Angle X-ray Scattering. New York: Academic Press; 1982. [Google Scholar]
- 8.Shiu YJ, Jeng U, Huang YS, Lai YH, Lu HF, Liang CT, Hsu IJ, Su CH, Su C, Chao I, et al. Biophysical Journal. 2008;94:4828. doi: 10.1529/biophysj.107.124214. [DOI] [PMC free article] [PubMed] [Google Scholar]
- 9.Schneidman-Duhovny D, Hammel M, Sali A. Nucleic Acids Research. 2010;38:W540. doi: 10.1093/nar/gkq461. [DOI] [PMC free article] [PubMed] [Google Scholar]
- 10.Bushnell GW, Louie GV, Brayer GD. Journal of Molecular Biology. 1990;214:585. doi: 10.1016/0022-2836(90)90200-6. [DOI] [PubMed] [Google Scholar]
- 11.Kratky O, Porod G. Recueil des Travaux Chimiques des Pays-Bas. 1949;68:1106. [Google Scholar]
- 12.Brûlet A, Boué F, Cotton J. Journal de Physique II. 1996;6:885. [Google Scholar]
- 13.Damaschun G, Damaschun H, Gast K, Gernat C, Zirwer D. Biochimica et Biophysica Acta (BBA)-Protein Structure and Molecular Enzymology. 1991;1078:289. doi: 10.1016/0167-4838(91)90571-g. [DOI] [PubMed] [Google Scholar]
- 14.Kataoka M, Hagihara Y, Mihara K, Goto Y. Journal of Molecular Biology. 1993;229:591. doi: 10.1006/jmbi.1993.1064. [DOI] [PubMed] [Google Scholar]
- 15.Konarev PV, Petoukhov MV, Volkov VV, Svergun DI. Journal of Applied Crystallography. 2006;39:277. doi: 10.1107/S1600576716005793. [DOI] [PMC free article] [PubMed] [Google Scholar]
- 16.Larson AG, Naber N, Cooke R, Pate E, Rice SE. Biophysical Journal. 2010;98:2619. doi: 10.1016/j.bpj.2010.03.014. [DOI] [PMC free article] [PubMed] [Google Scholar]
- 17.Sindelar CV, Budny MJ, Rice S, Naber N, Fletterick R, Cooke R. Nature Structural Molecular Biology. 2002;9:844. doi: 10.1038/nsb852. [DOI] [PubMed] [Google Scholar]
- 18.Griffith OH, Jost P. Lipid Spin Labels in Biological Membranes. Vol. 1. Academic Press; New York: 1976. pp. 454–523. [Google Scholar]
- 19.Alessi DR, Corrie JE, Fajer PG, Ferenczi MA, Thomas DD, Trayer IP, Trentham DR. Biochemistry. 1992;31:8043. doi: 10.1021/bi00149a039. [DOI] [PubMed] [Google Scholar]
- 20.Rouget JB, Schroer MA, Jeworrek C, Pühse M, Saldana JL, Bessin Y, Tolan M, Barrick D, Winter R, Royer CA. Biophysical Journal. 2010;98:2712. doi: 10.1016/j.bpj.2010.02.044. [DOI] [PMC free article] [PubMed] [Google Scholar]
- 21.Chan CK, Hu Y, Takahashi S, Rousseau DL, Eaton WA, Hofrichter J. Proceedings of the National Academy of Sciences. 1997;94:1779. doi: 10.1073/pnas.94.5.1779. [DOI] [PMC free article] [PubMed] [Google Scholar]


