Abstract
The kisspeptins are critical regulators of mammalian reproduction. Kisspeptin-10 (45YNWNSFGLRF-NH254, kisspeptin-112–121 or metastin 45–54, NSC 741805), an active fragment of kisspeptin, has been shown to be a potent stimulator of gonadotropin-releasing hormone and secretion of luteinizing hormone in both rodents and primates. This shorter peptide fragment may have clinical utility potential and it is important to characterize its pharmacokinetic property. Recently, the pharmacokinetics of both kisspeptin-54 and kisspeptin-10 were characterized in humans using a radioimmunoassay (RIA), which measures only the immunoreactive kisspeptin (kisspeptin-IR). In this study, a highly sensitive and specific LC–MS/MS assay was developed to quantify kisspeptin-10 levels in rat plasma. The lower limit of quantitation (LLOQ) was 0.5 ng/mL, the within-day and between-day coefficient of variations (CVs) ranged from 5.2 to 15.4% and 1.3 to 14.2%, and the accuracy values ranged from 98 to 114% and 99 to 105%, respectively. With this method, stability studies demonstrated that kisspeptin-10 degraded rapidly with decomposition half-lives of 6.8 min, 2.9 min and 1.7 min at 4 °C, 25 °C, and 37 °C, respectively. The principal decomposition product was characterized as the N-terminal tyrosine deleted kisspeptin-10 46NWDSFGLRF-NH254. Pharmacokinetic study in rats showed that low ng/mL kisspeptin-10 was detected in the first few minutes, and eliminated rapidly and became undetectable 30 min after intravenous (i.v.) bolus administration of 1.0 mg/kg kisspeptin-10.
Keywords: Kisspeptin-10, LC–MS/MS, Pharmacokinetics, Metabolites
1. Introduction
Kisspeptins belong to a family of carboxy-terminal amidated peptides derived from a 145-amino acid precursor peptide, which is encoded by the gene KISS1 and enzymatically cleaved into a 54-amino acid peptide (kisspeptin-54 or metastin) as well as shortened peptides of 14,13 or 10 amino acids [1–4]. KISS1 was named after Hershey's well known chocolate Kisses, since it was originally identified by scientists in Hershey, PA, as a suppressor of metastasis of human melanomas and breast carcinoma cell lines [1,5] and plays an important role in puberty and reproductive function. Kisspeptin is an endogenous ligand of KISS1R, previously named GPR54 (orphan G protein-coupled membrane receptor), AXOR12, and hOT7T175 [2,6]. Both kisspeptins and its biologically active fragment kisspeptin-10 (also known as kisspeptin-112–121 and metastin 45–54) have been shown to be potent stimulators of gonadotropin-releasing hormone (GnRH) and secretion of luteinizing hormone (LH) in mice [7], rats [8–12], and primates [13] following a single i.v. bolus administration as well as a brief i.v. infusion to human males (90 min) [14] and ovariectomized, estradiol-treated sheep (4 h) [15,16].
Immunoassay and radioimmunoassay are the most commonly used traditional methods to measure kisspeptins. Horikoshi et al. used a two-site enzyme immunoassay (EIA) to measure metastin in human plasma and found that the plasma level of metastin was dramatically elevated during pregnancy, thereby possibly being a novel placenta-derived hormone in humans [17]. A radioimmunoassay (RIA) was used to examine the immunoreactivity (IR) of human plasma metastin in patients with malignant gestational trophoblastic neoplasia (GTN) [14,18]. The results showed that kisspeptin-IR levels increased in patients with malignant GTN compared with controls and decreased during and after treatment. The latter was found to correlate with human chorionic gonadotrophin (hCG) levels in plasma, suggesting that plasma metastin might be used as a novel tumor marker for patients with malignant GTN. Notably, this method was used to characterize the pharmacokinetics of kisspeptin-IR following of intravenous (i.v.) infusion of kisspeptin-54 [18] and kisspeptin-10 and intravenous and subcutaneous bolus injections of kisspeptin-10 in humans. Post steady-state plasma kisspeptin-IR level declined monoexponential with a half-life of 27.6 min following iv infusion of kisspeptin-54. However, following i.v. infusion of kisspeptin-10, post-infusion half-life of kisspeptin-10 (as kisspeptin-IR) was found to be 3.8–4.1 min [16].
Although both EIA and RIA methods are sensitive methods for kisspeptins measurement (concentration detected can be as low as 1 fmol/mL), they measure only immunoreactive kisspeptins, which could include metabolites or degradation products. No chemical method to quantify kisspeptin-10 (Metastin 45–54) directly has been reported to date. Therefore, in this study a highly sensitive and specific LC–MS/MS assay was developed to quantify kisspeptin-10 concentrations in plasma. Using this assay, the stability and pharmacokinetics of this peptide were also investigated. Additionally, a novel metabolite was identified in rat plasma and its concentration–time profile monitored.
2. Materials and methods
2.1. Reagents and chemicals
The C-terminally amidated decapeptide kisspeptin-10 (YNWNSFGLRF-NH2) was provided by the National Cancer Institute (NCI) (Bethesda, MD) and used without further purification. The internal standard substance P (SP) (RPKPQQFFGLM-NH2) (purity > 98%) was purchased from Sigma–Aldrich (St. Louis, MO) and used without further purification. All organic solvents were of HPLC grade and were obtained from Fisher Scientific (Pittsburg, PA), except for formic acid (FA), which was obtained from Sigma-Aldrich (St. Louis, MO). HPLC grade water was obtained from an E-pure water purification system (Barnstead, Dubuque, IA). Protease Inhibitor Cocktail was purchased from Sigma-Aldrich (St. Louis, MO)
2.2. LC-MS system and conditions
The LC–MS system used consisted of a triple quadrupole mass spectrometer (Finnigan TSQ EMR quantum, ThermoFinnigan, San Jose, CA) coupled to a Shimadzu HPLC system (Shimadzu, Columbia, MD). The temperature of the autosampler was set at 4°C during operation. Kisspeptin-10 and SP were separated on a BetaBasic C8 column (2.1 mm × 50 mm, 5 μm, Thermo Hypersil-Keystone, Bellefonte, PA) coupled with a BetaBasic C8 guard column (2.1 mm × 10 mm, 5 μm, Thermo Hypersil-Keystone, Bellefonte, PA) under a gradient elution at a flow rate of 0.20 mL/min. Mobile phase A consisted of water/0.1% FA and mobile phase B consisted of ACN/0.1% FA. The gradient was initiated at 5% B, increased to 25% B in 2 min, to 50% B in 8 min, to 70% B in 1 min and was held at 70% B for 1 min, and then to 5% B in 1 min and further held at 5% B for 7 min before the next sample injection for a total run time of 20 min. The eluent was diverted to the waste in the first 3.5 min and the last 10 min.
The mass spectrometer was operated under a positive ESI mode with a helium pressure of 20 psi, a typical electrospray needle voltage of 4900 V, a sheath nitrogen gas flow of 33 (arbitrary unit) and a heated capillary temperature of 325 °C. The kisspeptin-10 and SP were analyzed by multiple reaction monitor (MRM) mode using ion transitions at m/z 651.9 > 277.8 with a relative collision energy of 23% and 674.5 > 253.8 with a relative collision energy of 25%, respectively. The mass spectrometer was tuned to its optimum sensitivity by direct infusion of kisspeptin-10 solution (10 μg/mL). All operations were controlled by FinniganXcalibur software on a Windows NT 4.0 system.
2.3. Sample extraction
A 20 μL aliquot of kisspeptin-10 working solutions in 50% ACN/H2O at various concentrations (1–10,000 ng/mL) was mixed with 20 μL internal standard SP solution (1000 ng/mL). Then to the above mixture was added 200 μL of rat plasma and the resultant solution was vortex mixed for 1∼2 s, immediately followed by addition of 600 μL ACN to precipitate the plasma proteins to prevent kisspeptin-10 decomposition. The supernatant was then transferred to a borosilicate glass tube (12 mm × 75 mm, Fisher, Pittsburgh, PA) and dried under a mild stream of nitrogen. The residues were reconstituted in 100 μL 5% ACN/0.1% FA and a 50 μL aliquot of the reconstituted solution was injected into the liquid chromatography (LC) port coupled to the mass spectrometer for separation and analysis.
2.4. Assay validation
Rat plasma samples spiked with kisspeptin-10 for standard curves (0.1–1000 ng/mL) were prepared and extracted as described above. The within-run precision values were determined in six replicates for each of the quality control (QC) sample at concentrations of 0.5, 1, 5, 50 and 500 ng/mL, respectively. The between-run precision was determined across the above QC data points in six different days and the mean concentrations and the coefficients of variation (CVs) were calculated. The accuracy of the assay was determined by comparing the nominal concentrations with the corresponding calculated mean concentrations. The extraction recovery of kisspeptin-10 was evaluated by comparing the peak area of the extracted QC samples with that of the extracted blanks spiked with the corresponding neat solutions.
2.5. Stability of kisspeptin-10
The stability of kisspeptin-10 in rat plasma was evaluated using the LC–MS/MS method described below. Briefly, kisspeptin-10 (500 ng/mL) was incubated in rat plasma (1 mL) at 4°C, 25 °C, and 37 °C. A 100 μL aliquot of the mixture was removed at the following time points 0, 1, 2, 4, 6, 8, 10, 15 and 30 min and immediately mixed with the internal standard SP, followed by addition of ACN (1:3 v/v) for extraction. The supernatant was dried with a mild steam of nitrogen and the residue was reconstituted in 5% ACN/0.1% FA solution. A 50 μL aliquot was injected for LC–MS/MS analysis. The resultant drug concentration versus incubation time for its stability study was fitted by an appropriate model using the WinNonlin computer program (Pharsight 5.2, Mountain View, CA). The stability of kisspeptin-10 (10 ng/mL) in ACN extract of rat plasma was examined at 4°C and −80 °C for 18 h to evaluate its stability during its overnight storage.
2.6. Kisspeptin-10 metabolites/degradation products identification in rat plasma
Ten μL of kisspeptin-10 (1.0 mg/mL) saline solution was incubated with 1 mL rat plasma at room temperature for 60 min. Then 3 mL ACN was added to precipitate plasma protein and the mixture was dried under a mild stream of nitrogen. Finally the residue was reconstituted in 200 μL 5% ACN/0.1% FA. The blank rat plasma was processed the same way and used as a control. The components were analyzed under two LC conditions with one as detailed in the LC–MS system and conditions and the other condition as followings: condition A, initiated at 5% B (acetonitrile/0.1% formic acid), increased to 50% B in 30 min, to 70% B in 2 min, was held at 70% B for 1 min, and then to 5% B in 1 min and further held at 5% B for 7 min.
2.7. Pharmacokinetics study of kisspeptin-10 in the rat
All animal studies and euthanasia were carried out under protocols approved by the Ohio State University Institutional Animal Care and Use Committee. Six male Fisher 344 rats (Pittsburg, PA) weighing 304.0 ± 28.9 g were used in the pharmacokinetics studies. The right jugular vein or both left and right jugular veins of each rat was cannulated under ketamine–xyline anesthesia (83 mg/kg and 17 mg/kg, respectively), and the rats were allowed to recover overnight prior to drug administration. Kisspeptin-10, dissolved in saline at a concentration of 1.0 mg/mL, was given as an i.v. bolus dose at 1.0 mg/kg. Approximately 0.2 mL each of heparinized blood was withdrawn from the cannula at 0 (predose) 1, 2, 4, 6, 8, 10, 15, 20, 30, 45, 60 and 120 min after dosing, and the loss of fluid was replaced by flushing the cannula with an equal volume of normal saline. Then, the blood was centrifuged at 4 °C for 30 s and an aliquot of 0.1 mL of plasma was quickly transferred to the Omni tubes containing 0.3 mL of acetonitrile and 10 μL 1000 ng/mL SP. The content was mixed by vortex for 2 s and the supernatant was dried under a mild stream of nitrogen. The residues were reconstituted in 100 μL of 5% ACN/0.1% FA and 50 μL of the reconstituted solution was analyzed by the LC–MS/MS method as described in Section 2.2.
3. Results and discussion
3.1. Mass spectrometric characterization of kisspeptin-10 and substance P (SP)
The mass spectra of kisspeptin-10 and SP (10 μg/mL) in 50% ACN/0.1% FA were acquired under a positive ESI mode at a flow rate of 20 μL/min on the TSQ quantum mass spectrometer. The 1 min average mass spectra of kisspeptin-10 and SP are shown in Fig. 1A and B, respectively. The mass spectrum of kisspeptin-10 (Fig. 1A) shows a base peak at m/z 652.04 and a low-abundant peak at m/z 1303.04, corresponding to the doubly and singly charged molecular ions of Kisspeptin-10, respectively. The mass spectrum of the internal standard SP (Fig. 1B) exhibited two major peaks at m/z 674.60 and m/z 449.96 and a minor ion at m/z 1348.31, corresponding to the doubly, triply and singly charged molecular ions of SP, respectively.
Fig. 1.
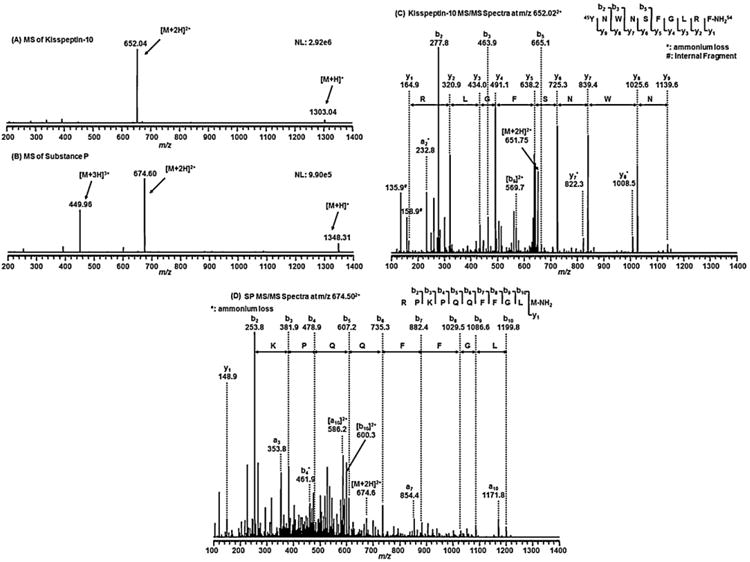
The 1-min average mass spectra of 10 μg/mL of kisspeptin-10 (A) and SP (B) in 50% ACN/0.1% FA under positive electrospray ionization (ESI and the CID mass spectra of the doubly charged molecular ion of kisspeptin-10 at m/z 652.04 with 23% collision energy showing the base peak b2 ion at m/z 277.76 (C) and the doubly charged molecular ion of SP at m/z 674.60 with 30% collision energy showing the base b2 ion at m/z 253.81 (D), which was chosen for the selected reaction monitoring (SRM) of kisspeptin-10 and SP, respectively.
The doubly charged ions of kisspeptin-10 (m/z 652.04) and SP (m/z 674.60) were selected for the collision-induced dissociation (CID) fragmentation, since they were the most abundant ions. The CID spectrum of kisspeptin-10 shows a base peak at m/z 277.76, corresponding to the b2 ion of kisspeptin-10 (Fig. 1C). Similarly, the b2 ion at m/z 253.81 was also the most abundant ion in the CID spectrum of SP (Fig. 1D). Therefore, the precursor/product ion pairs at m/z 652.04/277.76 and 674.60/253.81 were selected in the MRM mode for quantification of kisspeptin-10 and SP, respectively. The relative collision energy was optimized at 23% for kisspeptin-10 and 30% for SP to yield the best signal. In addition to the most abundant b2 ion of kisspeptin-10, two sets of y-ions from y1 to y9 and y7* and y8* (due to ammonium loss) and one set of b ions b2, b3, b5 and b9 were also observed and shown in Fig. 1C. Similarly, a set of b ions (b2–b10) and a-ions (a3–a10) were also observed and shown in the tandem mass spectrum of SP (Fig. 1D). All these ions confirmed the sequence of kisspeptin-10 and SP shown in Fig. 1C and D (right top corner insets).
3.2. Optimization of extraction and separation method to minimize matrix effect and maximize recovery yield of kisspeptin-10 from rat plasma
The intrinsic sensitivity of kisspeptin-10 in the mobile phase was evaluated and the lower limit of quantitation (LLOQ) of 0.1 ng/mL was found. The detection was linear between 0.1 and 1000 ng/mL, using a 5-min, 0.2 mL/min isocratic elution (50% ACN/0.1% FA) and a 50 μL injection volume as shown in Fig. S1 in the supplementary material section. The solid-phase extraction method of kisspeptin-10 from rat plasma was then evaluated. Following ACN precipitation (rat plasma:ACN = 1:3 v/v) or Oasis HLB SPE cartridge (Waters, Milford, MA) for extraction, the measured kisspeptin-10 signal from the reconstituted residue of spiked plasma (1000 ng/mL) was rather low when compared to that in mobile phase. Two reasons might account for the low signal: low recovery or matrix ion suppression (matrix effect). It was found that a very low mass signal (5.3% of that in mobile phase) was observed in the blank plasma extraction residue spiked with 1000 ng/mL kisspeptin-10. This data suggested that the mass signal was strongly suppressed by the matrices in these extracts under the above isocratic conditions. Therefore, we attempted to minimize the matrix effect by optimizing the HPLC conditions. After several tests, a gradient elution condition as detailed in Section 2.2 was used. Under gradient conditions, kisspeptin-10 and SP were baseline separated with retention times of 6.46 min and 5.18 min, respectively as shown in Fig. 2; notably, the mass signal of kisspeptin-10 was significantly increased to 33.4% of that in mobile phase, which is much higher than 5.4% under the isocratic conditions.
Fig. 2.
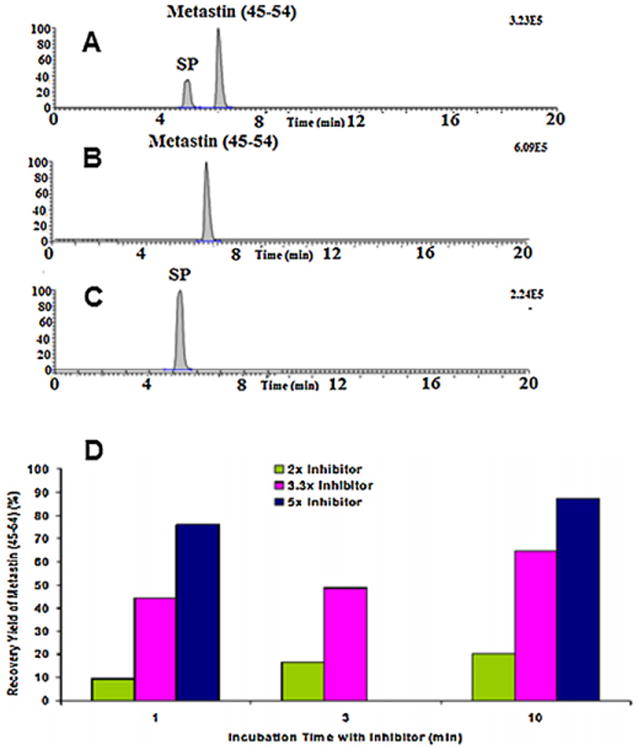
The total ion chromatogram (TIC, A) of the reconstituted solution of the extraction residue of rat plasma spiked with 1000 ng/mL of kisspeptin-10 and SP, and the extracted ion chromatograms (XIC) at m/z 651.85/277.76 (B) for kisspeptin-10 and m/z 674.50/253.80 (C) for SP. kisspeptin-10 was eluted at 6.46 min and SP was eluted at 5.18 min and the recovery (D) from kisspeptin-10 extracted by HLB cartridge by pre-incubating the rat plasma with three concentrations of commercial protease inhibitors.
The recovery of kisspeptin-10 from HLB cartridges in the absence and presence of rat plasma was evaluated. Although the recovery without plasma was reasonable, the recovery in the presence of rat plasma was rather low. This phenomenon could be due to rapid degradation of kisspeptin-10 mediated by the action of plasma enzymes, such as proteases or peptidases. To test this hypothesis and retard its plasma degradation, we pre-incubated rat plasma with various amounts of commercial protease inhibitor for 5 or 10 min. Then, 1000 ng/mL of kisspeptin-10 and SP were spiked into the resultant rat plasma and extracted using the HLB cartridge. The results showed that the recovery of kisspeptin-10 increased with increasing concentrations of protease inhibitor up to almost quantitative recovery (Fig. 2D), suggesting that the protease inhibitor may provide a practical way to stabilize kisspeptin-10 and SP in rat plasma.
With protease inhibitor stabilization of kisspeptin-10 and gradient LC condition to attenuate the matrix effect, a calibration curve of kisspeptin-10 in rat plasma showed an R2 of 0.9996 in the concentration range of 1–1000 ng/mL as shown in Fig. S2 in the supplementary material section. However, the low reproducibility at lower concentration range (<10 ng/mL) along with the high cost of the protease inhibitor and the long incubation time (10 min) rendered the procedure cumbersome and less practical for multiple sample analysis. We then evaluated an alternate method of protein denaturation using organic solvent. It was found that rapid addition of CAN is an effective and practical method to retard kisspeptin-10 decomposition. Using this method as described above, the recovery of kisspeptin-10 was determined to be approximately from 76 to 103.3% depending on the spiked concentrations.
3.3. Assay validation
The lower limit of detection (LLOD) of the assay was determined to be 0.1 ng/mL as defined by a 3-fold signal to noise ratio compared with blank matrix. The lower limit of quantification (LLOQ) was determined to be 0.5 ng/mL in rat plasma as shown in Fig. S3 in the supplementary material section. The assay was found to be linear from 0.1 to 1000 ng/mL with a regression coefficient of near unity. The method was validated and the results are summarized in Table 1. The within-run CVs were 7.76, 15.38, 6.97, 5.21 and 6.50% (n = 6 each) for the LLOQ and quality control samples at, 1, 5, 50 and 500 ng/mL, respectively. The between-run CVs were 7.8, 15.4, 7.0, 5.2 and 6.5% (n = 6) for LLOQ and the above quality control samples, respectively. These within-day and between-day validation parameters meet the FDA criterion of a Good Laboratory Practice analytic method validation. (Guidance for Industry Bioanalytical Method Validation, p. 5, available from the website: http://www.fda.gov/cder/guidance/4252fnl.pdf).
Table 1.
Method validation of kisspeptin-10 in rat plasma.
| Concentration (ng/mL) | |||||
|---|---|---|---|---|---|
|
|
|||||
| 0.5 | 1 | 5 | 50 | 500 | |
| Within-run # | |||||
| 1 | 0.45 | 1.21 | 5.58 | 50.37 | 628.88 |
| 2 | 0.50 | 1.36 | 6.21 | 54.94 | 556.13 |
| 3 | 0.51 | 1.10 | 5.84 | 50.65 | 574.99 |
| 4 | 0.45 | 1.30 | 6.08 | 53.37 | 566.30 |
| 5 | 0.55 | 0.89 | 5.97 | 51.19 | 588.15 |
| 6 | 0.49 | 1.03 | 5.10 | 47.20 | 516.16 |
| Average ± SD | 0.49 ± 0.04 | 1.15 ± 0.18 | 5.80 ± 0.40 | 51.29 ± 2.67 | 571.77 ± 37.17 |
| CV(%) | 7.8 | 15.4 | 7.0 | 5.2 | 6.5 |
| Accuracy | 98.3 | 115.0 | 116.0 | 102.6 | 114.4 |
| Recovery (%) | 76.0 | 83.9 | 103.3 | 97.8 | 81.5 |
| Between-run # | |||||
| 1 | 0.47 | 0.99 | 5.23 | 50.30 | 510.24 |
| 2 | 0.65 | 1.00 | 4.77 | 50.25 | 523.12 |
| 3 | 0.58 | 0.95 | 5.04 | 50.03 | 512.78 |
| 4 | 0.50 | 1.00 | 5.58 | 50.83 | 507.02 |
| 5 | 0.46 | 1.11 | 5.05 | 50.18 | 523.12 |
| 6 | 0.49 | 1.27 | 5.16 | 46.26 | 512.05 |
| Average ± SD | 0.53 ± 0.07 | 1.05 ± 0.12 | 5.14 ± 0.27 | 49.64 ± 1.68 | 514.72 ± 6.80 |
| CV(%) | 14.2 | 11.3 | 5.2 | 3.4 | 1.3 |
| Accuracy | 105.0 | 105.3 | 102.8 | 99.3 | 102.9 |
3.4. Stability studies
As shown in Fig. 3, kisspeptin-10 degraded rapidly with a biexponential decay mode in a temperature-dependent manner with a rather short initial phase half-life (t1/2) of 6.78 min, 2.91 min and 1.69 min at 4 °C, 25 °C, and 37 °C, respectively (Table 2). This initial half-life was shorter with an increase in temperature, consistent with a temperature-dependent degradation. The nature of the slower decay phase at the later time is not clear and since the concentrations approach the limit of quantification, the phase is probably not important in the overall scheme of kisspeptin-10 degradation. In any case, more than 90% kisspeptin-10 degraded in rat plasma in 30 min. Its rapid decomposition implicated that sample process and storage will be critical for its pharmacokinetic study. Therefore, the stability of kisspeptin-10 after its extraction from rat plasma at 4 °C and −80 °C was evaluated. More than 95.4% and 97.6% of kisspeptin-10 remained in these samples after 18 h storage at 4 and −80 °C, respectively. The results suggested that kisspeptin-10 in ACN extract is quite stable (p > 0.05, student t-test). The data indicated that samples, following precipitation and centrifugation, the supernatant could be stored in 4 °C or −80 °C for overnight without any significant decomposition, which was used to process all plasma samples for its pharmacokinetic study in rats.
Fig. 3.
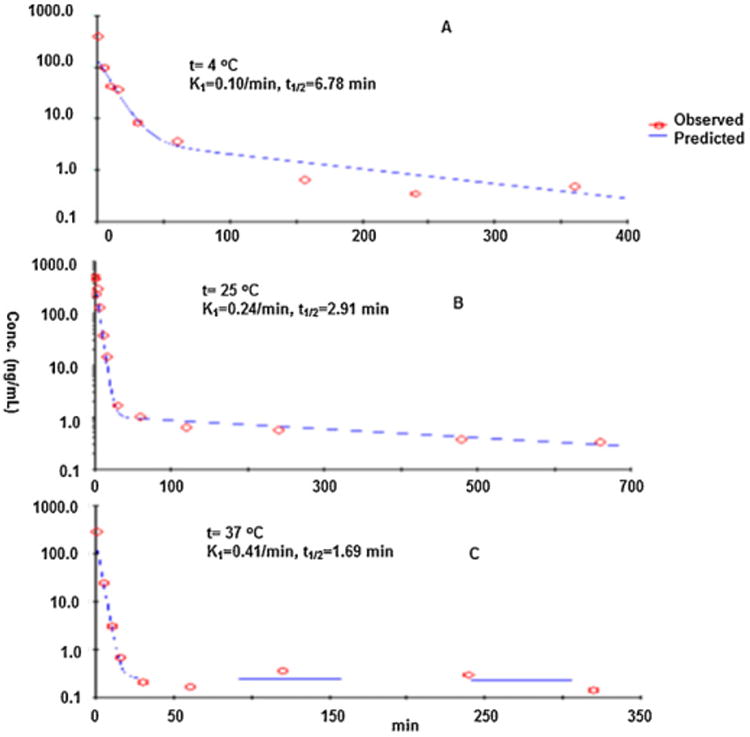
The stability of kisspeptin-10 in rat plasma at different temperatures: decomposition curve of kisspeptin-10 at 4 °C (A), 25 °C (B) and 37 °C (C). The y-axis is the ratio of the peak area of kisspeptin-10 relative to SP. The x-axis is the incubation time in rat plasma.
Table 2.
The decomposition kinetics parameters of kisspeptin-10 in rat plasma at 4 °C, 25 °C and 37 °C.
| Temperature (°C) | 4 °C | 25 °C | 37 °C |
|---|---|---|---|
| 1st half life (min) | 6.78 | 2.91 | 1.69 |
| 1st rate constant (min−1) | 0.10 | 0.24 | 0.41 |
3.5. Pharmacokinetics ofkisspeptin-10 in rats
Using the LC–MS/MS method, the pharmacokinetics of kisspeptin-10 was determined in six Fischer 344 rats following an i.v. bolus administration at a dose of 1 mg/kg in saline solution. As shown in Fig. 4, low concentrations (10–60 ng/mL) of metastin were detected in 1- or 2-min plasma samples. Then it followed by a rapid decline to 1–2 ng/mL within 4 min. The initial fitting suggests an extremely short half-life (<1 min). This is in line with the rapid degradation ofkisspeptin-10 in rat plasma and showed similar short half-life (∼4 min) ofkisspeptin-10 in humans after an i.v. infusions ofkisspeptin-10 [16]. After, plasma kisspeptin-10 levels fluctuated in 30 min and became undetectable 2 h after an i.v. bolus administration of 1 mg/kg kisspeptin-10 in rats. Due to the short initial half-life and large fluctuation, no further PK fitting analyses has been pursued.
Fig. 4.
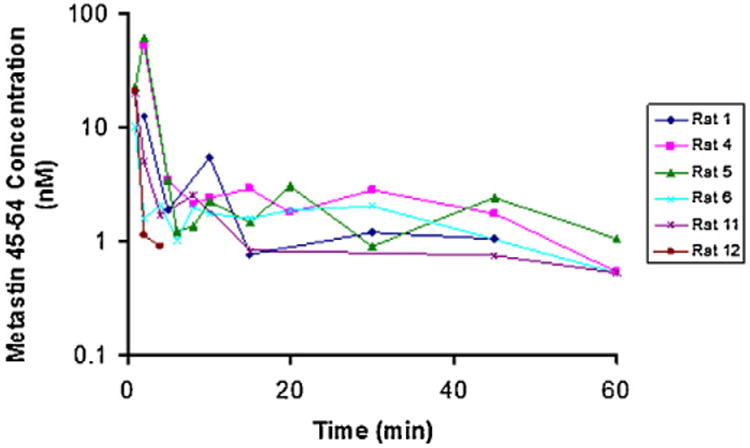
The composite plasma concentration-time profiles of six rats after an i.v. bolus administration of 1 mg/kg kisspeptin-10 in saline solution.
3.6. Characterization of kisspeptin-10 decomposition products in rat plasmas
The rapid decomposition of metastin 45–54 in vitro and in vivo led to the search for possible metabolites. As shown in the total ion chromatograms (Fig. 5) of the extract of blank rat plasma and rat plasma incubated with kisspeptin-10 (1 mg/mL), a new peak with retention time of 7.73 min, not seen in blank rat plasma (Fig. 5A), was observed in rat plasma with Kisspeptin-10 (Fig. 5B). The deconvoluted mass spectrum (Fig. 5C) of this peak showed a strong peak with m/z at 570.962+. However, a longer gradient was used for better separation under a selected ion monitoring of m/z at 570.962+, the chromatogram showed two peaks; a major peak was eluted at 17.36 min and a small peak eluted at 18.31 min (Fig. 6A). These two peaks showed different fragmentations of product ions. As shown in Fig. 6B, the tandem mass spectrum of the precursor ion at 570.292+ has a sequence of metastin 46–54 and in Fig. 6C shows that the precursor ion at 570.782+ appears to be a mixture of two components. The possible sequence could be either 46NWNSFGLRFOH54 or 46NWDSFGLRF-NH254, the latter of which may have been derived from conversion of asparagine to aspartic acid. The zoom in y7 ions showed the same patterns. However, we cannot verify the exact identity without the use of the synthetic peptides. Therefore, synthetic peptides with these sequences were made and their sequences were confirmed by their mass and tandem mass spectra (data not shown) are listed in Table 3.
Fig. 5.
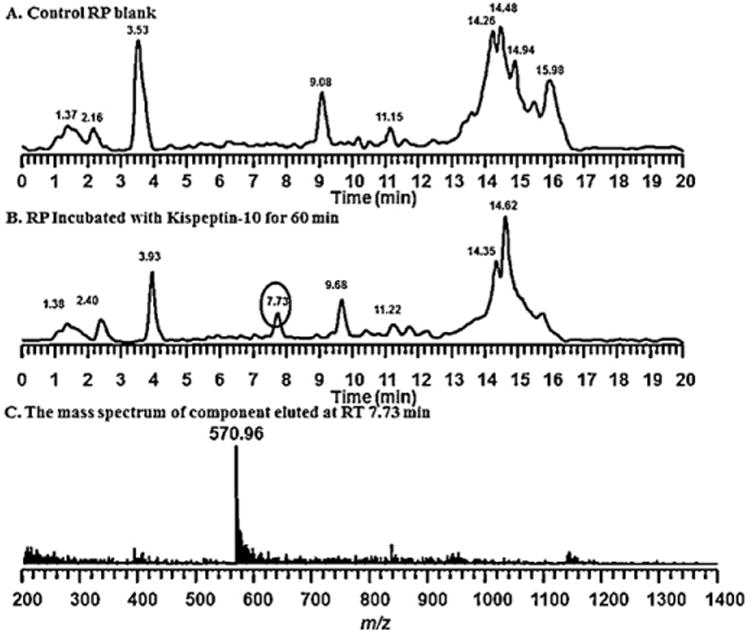
Identification of decomposition product of kisspeptin-10: the total ion chromatogram of blank rat plasma (A), and the plasma incubated with kisspeptin-10 for 60 min (B) and the mass spectrum of the peak at 7.73 min in B and the MS/MS spectrum of the most abundant ion in (C).
Fig. 6.
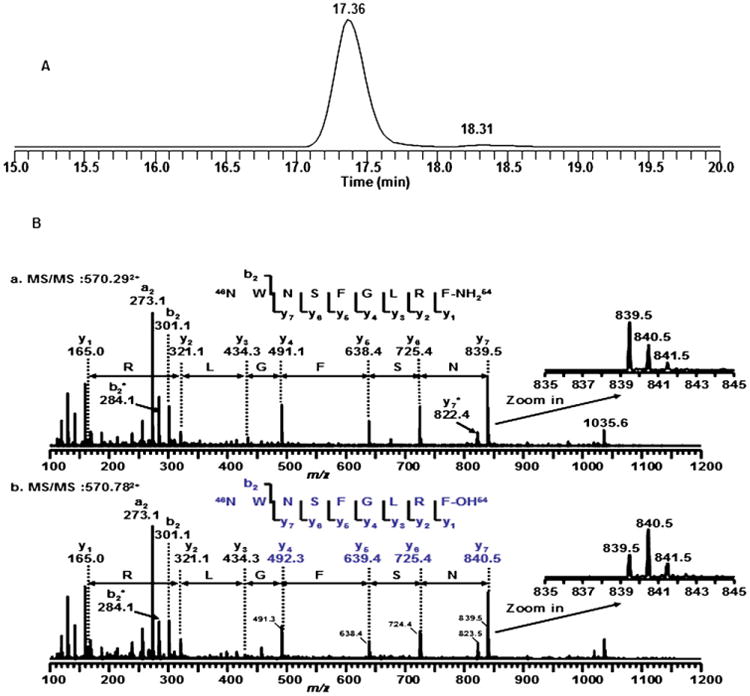
The total ion chromatogram (TIC, A) to the extract of rat plasma with kisspeptin-10 by selected ion monitor of m/z 570.95+ under a gradient and the tandem mass spectra of the precursor ions at (B) m/z 570.292+ and (C) m/z 570.782+ by Nano-spray Q-Tof instrument, which were in agreement with tandem mass spectra obtained by the TSQ quantum instrument (not shown).
Table 3.
Synthetic peptide standards and their calculated and measured masses by the TSQ-Quantum instrument.
| Sequences | Calculated | Measured | |||
|---|---|---|---|---|---|
|
|
|
||||
| [M+H]+ | [M+2H]2+ | [M+H]+ | [M+2H]2+ | ||
| Peptide 1 | NWNSFGLRF-CONH2 | 1139.57+ | 570.292+ | 1139.78+ | 570.492+ |
| Peptide 2 | NWNSFGLRF-COOH | 1140.56+ | 570.782+ | 1140.82+ | 570.952+ |
| Peptide 3 | NWDSFGLRF-CONH2 | 1140.56+ | 570.782+ | 1140.82+ | 570.952+ |
In order to separate them completely, a 75-min gradient as detailed in method section was used. Fig. 7A shows the separation of these three synthesized peptides and their product scan at the above parent masses. As shown, Peptide 1 elutes at 28.18 min (P1), Peptide 2 (P2) elutes at 30.07 min and Peptide 3 (P3) elutes at 29.18 min. The fragmentation patterns and retention times of these peptide standards were compared with those of the metabolites to confirm the structural assignment.
Fig. 7.
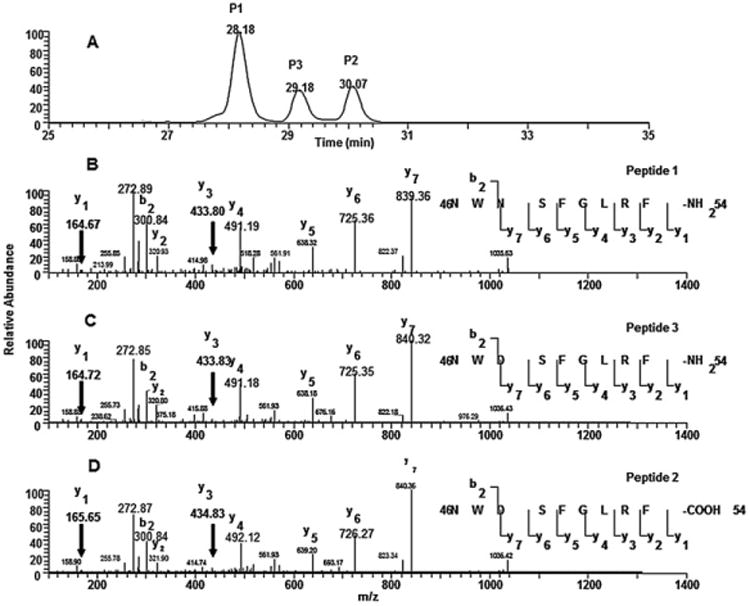
The total ion chromatograms (TICs) of three synthetic peptides (A) and their respective tandem mass spectra of peptide 1 (B), peptide II (C) and peptide III (D).
As shown in Fig. 8, the control (rat plasma Fig. 8B) has no signal at the retention times corresponding to the synthetic peptide standards. The three peaks eluting at 29.55, 29.94, and 30.51 min have very low abundance ions not related to these peptides. However, the rat plasma sample (Fig. 8C) shows a large peak at 27.93 min, which corresponds to that of the synthetic peptide standard 1 (Fig. 8A). The extracted tandem mass spectrum for that peak is shown in Fig. 8D, which is identical to that of Peptide 1. Thus, this data confirms that the metabolite is the tyrosine cleavage product from the C-terminal of the parent drug (NWNSFGLRF-CONH2). The apparent mixture in the tandem mass spectra described previously was due to the isotopic peak of this metabolite, which also undergoes fragmentation similar to the mono-isotopic peak of the metabolite.
Fig. 8.
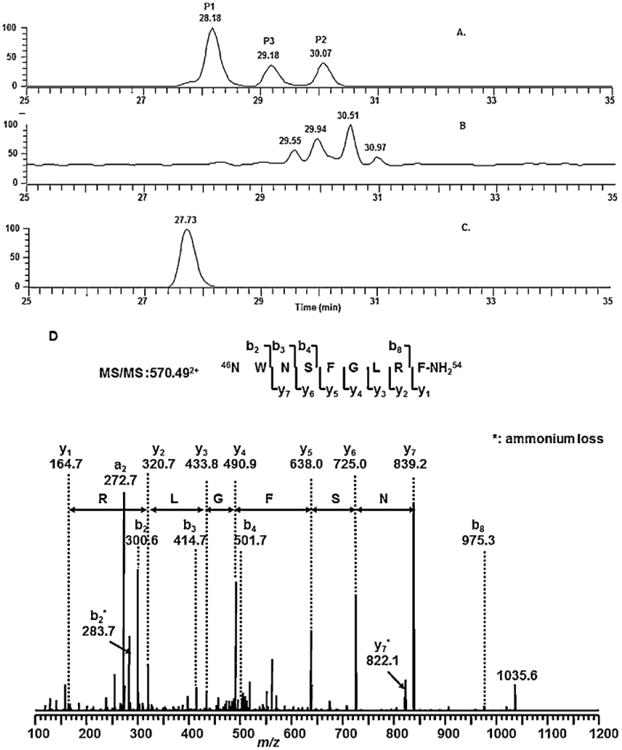
The total ion chromatograms (TICs) of three synthetic peptides (A); the control rat plasma (B); rat plasma incubated with kisspeptin-10(1 mg/mL, 30 min) (C) and the tandem mass spectrum for the metabolite peak (D).
4. Conclusion
A highly sensitive and specific LC–MS/MS assay was developed and validated to quantify kisspeptin-10 in rat plasma with a lower limit of quantification of 0.5 ng/mL This method was capable of evaluating its stability in rat plasma and preclinical pharmacokinetics in rats. Kisspeptin-10 decomposed rapidly in rat plasma and was eliminated extremely fast in rats after an i.v. administration of 1 mg/kg kisspeptin-10 in saline. An N-terminal tyrosine deleted peptide was detected as the principal decomposition product of kisspeptin-10 in rat plasma.
Supplementary Material
Acknowledgments
This research was supported by the NIH-RAID program, NICHD and NIDDK under the National Cancer Institute (NCI) contract N01-CM-52205.
Appendix A. Supplementary data
Supplementary data associated with this article can be found, in the online version, at http://dx.doi.org/10.1016/j.jchromb.2013.02.027.
References
- 1.Lee JH, Miele ME, Hicks DJ, Phillips KK, Trent JM, Weissman BE, Welch DR. J Natl Cancer Inst. 1996;88:1731. doi: 10.1093/jnci/88.23.1731. [DOI] [PubMed] [Google Scholar]
- 2.Kotani M, Detheux M, Vandenbogaerde A, Communi D, Vanderwinden JM, Le Poul E, Brezillon S, Tyldesley R, Suarez-Huerta N, Vandeput F, Blanpain C, Schiffmann SN, Vassart G, Parmentier M. J Biol Chem. 2001;276:34631. doi: 10.1074/jbc.M104847200. [DOI] [PubMed] [Google Scholar]
- 3.Ohtaki T, Shintani Y, Honda S, Matsumoto H, Hori A, Kanehashi K, Terao Y, Kumano S, Takatsu Y, Masuda Y, Ishibashi Y, Watanabe T, Asada M, Yamada T, Suenaga M, Kitada C, Usuki S, Kurokawa T, Onda H, Nishimura O, Fujino M. Nature. 2001;411:613. doi: 10.1038/35079135. [DOI] [PubMed] [Google Scholar]
- 4.West A, Vojta PJ, Welch DR, Weissman BE. Genomics. 1998;54:145. doi: 10.1006/geno.1998.5566. [DOI] [PubMed] [Google Scholar]
- 5.Lee JH, Welch DR. Cancer Res. 1997;57:2384. [PubMed] [Google Scholar]
- 6.Muir AI, Chamberlain L, Elshourbagy NA, Michalovich D, Moore DJ, Calamari A, Szekeres PG, Sarau HM, Chambers JK, Murdock P, Steplewski K, Shabon U, Miller JE, Middleton SE, Darker JG, Larminie CG, Wilson S, Bergsma DJ, Emson P, Faull R, Philpott KL, Harrison DC. J Biol Chem. 2001;276:28969. doi: 10.1074/jbc.M102743200. [DOI] [PubMed] [Google Scholar]
- 7.Gottsch ML, Cunningham MJ, Smith JT, Popa SM, Acohido BV, Crowley WF, Seminara S, Clifton DK, Steiner RA. Endocrinology. 2004;145:4073. doi: 10.1210/en.2004-0431. [DOI] [PubMed] [Google Scholar]
- 8.Irwig MS, Fraley GS, Smith JT, Acohido BV, Popa SM, Cunningham MJ, Gottsch ML, Clifton DK, Steiner RA. Neuroendocrinology. 2004;80:264. doi: 10.1159/000083140. [DOI] [PubMed] [Google Scholar]
- 9.Matsui H, Takatsu Y, Kumano S, Matsumoto H, Ohtaki T. Biochem Biophys Res Commun. 2004;320:383. doi: 10.1016/j.bbrc.2004.05.185. [DOI] [PubMed] [Google Scholar]
- 10.Navarro VM, Castellano JM, Fernandez-Fernandez R, Barreiro ML, Roa J, Sanchez-Criado JE, Aguilar E, Dieguez C, Pinilla L, Tena-Sempere M. Endocrinology. 2004;145:4565. doi: 10.1210/en.2004-0413. [DOI] [PubMed] [Google Scholar]
- 11.Navarro VM, Fernandez-Fernandez R, Castellano JM, Roa J, Mayen A, Barreiro ML, Gaytan F, Aguilar E, Pinilla L, Dieguez C, Tena-Sempere M. J Physiol. 2004;561:379. doi: 10.1113/jphysiol.2004.072298. [DOI] [PMC free article] [PubMed] [Google Scholar]
- 12.Thompson EL, Patterson M, Murphy KG, Smith KL, Dhillo WS, Todd JF, Ghatei MA, Bloom SR. J Neuroendocrinol. 2004;16:850. doi: 10.1111/j.1365-2826.2004.01240.x. [DOI] [PubMed] [Google Scholar]
- 13.Shahab M, Mastronardi C, Seminara SB, Crowley WF, Ojeda SR, Plant TM. Proc Natl Acad Sci U S A. 2005;102:2129. doi: 10.1073/pnas.0409822102. [DOI] [PMC free article] [PubMed] [Google Scholar]
- 14.Dhillo WS, Chaudhri OB, Patterson M, Thompson EL, Murphy KG, Badman MK, McGowan BM, Amber V, Patel S, Ghatei MA, Bloom SR, Clin J. Endocrinol Metab. 2005;90:6609. doi: 10.1210/jc.2005-1468. [DOI] [PubMed] [Google Scholar]
- 15.Messager S, Chatzidaki EE, Ma D, Hendrick AG, Zahn D, Dixon J, Thresher RR, Malinge I, Lomet D, Carlton MB, Colledge WH, Caraty A, Aparicio SA. Proc Natl Acad Sci U S A. 2005;102:1761. doi: 10.1073/pnas.0409330102. [DOI] [PMC free article] [PubMed] [Google Scholar]
- 16.Jayasena CN, Nijher GM, Comninos AN, Abbara A, Januszewki A, Vaal ML, Sriskandarajah L, Murphy KG, Farzad Z, Ghatei MA, Bloom SR, Dhillo WS. J Clin Endocrinol Metab. 2011;96:E1963. doi: 10.1210/jc.2011-1408. [DOI] [PMC free article] [PubMed] [Google Scholar]
- 17.Horikoshi Y, Matsumoto H, Takatsu Y, Ohtaki T, Kitada C, Usuki S, Fujino M. J Clin Endocrinol Metab. 2003;88:914. doi: 10.1210/jc.2002-021235. [DOI] [PubMed] [Google Scholar]
- 18.Dhillo WS, Savage P, Murphy KG, Chaudhri OB, Patterson M, Nijher GM, Foggo VM, Dancey GS, Mitchell H, Seckl MJ, Ghatei MA, Bloom SR. Am J Physiol Endocrinol Metab. 2006;291:E878. doi: 10.1152/ajpendo.00555.2005. [DOI] [PubMed] [Google Scholar]
Associated Data
This section collects any data citations, data availability statements, or supplementary materials included in this article.


