

Abstract
Background
Persons with diabetes have a higher risk of falls and fall related injuries. People with diabetes often develop peripheral neuropathy (DPN) as well as nerve damage throughout the body. In particular, reduced lower extremity proprioception due to DPN may cause a misjudgment of foot position and thus increase the risk of fall.
Objective
An innovative virtual obstacle crossing (VOC) paradigm using wearable sensors was developed in attempt to assess lower extremity position perception damage due to DPN.
Methods
Sixty-seven participants (Age: 55.4±8.9; BMI: 28.1±5.8) including diabetes with and without DPN as well as aged matched healthy controls were recruited. Severity of neuropathy was quantified using vibratory perception threshold (VPT) test. The ability of perception of lower extremity was quantified by measuring obstacle crossing success rate (OCSR), toe-obstacle clearance (TOC), and reaction time (TR) while crossing a series of virtual obstacles with heights at 10% and 20% of the subject’s leg length.
Results
No significant difference was found between groups for age and BMI. The data revealed that DPN subjects had a significantly lower OCSR compared to diabetes with no neuropathy and controls at obstacle size of 10% (p<0.05). DPN subjects also demonstrated longer TR compared to other groups and for both obstacle sizes. In addition TOC was reduced in neuropathy groups. Interestingly, a significant correlation between TR and VPT (r=0.5, p<10-5) was observed indicating delay in reaction by increasing neuropathy severity. The delay becomes more pronounced by increasing the size of obstacle. Using regression model suggests that the change in reaction time between obstacle sizes of 10% and 20% of leg size is the most sensitive predictors for neuropathy severity with an odds ratio of 2.70 (p=0.02).
Conclusion
The findings demonstrate proof of concept of virtual reality application as a promising method for objective assessment of neuropathy severity, however; a further study is warranted to establish a stronger relationship between the measured parameters and neuropathy.
Keywords: Virtual Reality, Diabetes Peripheral Neuropathy, Lower Extremity Joint Perception, Body Worn Sensors, Fall Prevention, Obstacle crossing
1. Introduction
According to ‘National Diabetes Information Clearinghouse (NDIC)’ [1], 20.8 million people in USA – at least 7% of the population- have diabetes. Diabetic peripheral neuropathy (DPN) is one of the most common complications of diabetes that affects nerve functions. It is estimated that DPN may occur in 25% of patients with 10 or more years of diabetes and up to 50% with 20 years of diabetes [2]. Among the elderly above 60 years of age with history of diabetes, DPN can affect more than 50% of the population [3]. The result of long-term diabetes coupled with nerve damage leads to significant deficits in lower limb proprioception, touch sensation, vibration perception, and kinesthesia [4]. Patients with DPN experience a high incidence of injuries while walking and have a low level of perceived safety. [5] In certain cases the impaired judgment – mainly due to impaired proprioceptive feedback - can cause obstacle collision leading to falls and injuries. [3,4,6-8]
The ankle inversion/eversion proprioceptive threshold for older subjects with peripheral neuropathy has been reported to be five times greater than age matched subjects without peripheral neuropathy [9]. The reduced joint proprioception makes obstacle negotiation difficult and increases the risk of fall. During the actual phase of obstacle crossing an individual does not have complete visual information regarding clearance between obstacle and foot; thus relies on proprioception for leading limb and feed-forward mechanism for the trailing limb. Therefore, especially among subjects with degraded balance and lost proprioception of joint position, the risk of contact with obstacle would be high.
Diabetic neuropathy is known to reduce ankle muscle strength even before diabetic neuropathy is diagnosed [10]. Several studies suggest that diabetes itself may increase risk of falling suggesting that degradation in gait and balance may be initiated before diagnosing DPN. For example, Miller and colleagues demonstrated that individuals with diabetes are 2.5-fold more likely to experience an accidental fall or a fall-related injury than healthy ones[11]. In the Women’s Health and Aging Study (n=1,002), Volpato and colleagues reported persons with diabetes demonstrated a 44% increased risk of falls over three years in their multivariate model. [12] In a study of osteoporotic fractures (n=9,249), Schwartz and colleagues reported a 68% increased fall risk for persons with diabetes. [13] Interestingly, poor balance appears to describe more of the fall risk association than loss of sensation or decreased vibratory perception.[13] Other authors have also described loss of sensation falling out of a multivariate model for conservative gait patterns in persons with diabetes.[14] Schwartz and colleagues reported poor balance as assessed by tandem gait and standing described 23 and 14% of the fall risk association compared with 3 and 6% for monofilament insensitivity and decreased vibration perception.[13] Thus, identifying subtle gait and balance degradations in patients with diabetes may be helpful for early diagnosis of neuropathy and assessing the associated risk of falling, especially in challenging environments, including obstacle avoidance.
The subtle, early findings that are indicative of postural instability are difficult to accurately assess from a clinical examination, and gait laboratory assessment is not currently available or practical. Thus, unfortunately, many patients that are “at risk for falls” are undiagnosed. The conventional methods for assessment of gait, balance, and obstacle crossing ability have been limited to gait laboratories equipped with motion tracking systems [15-19] which may not be suitable for a clinical environment [20-23]. In addition, assessing gait and balance in a real condition such as using an actual obstacle could be risky for DPN patients and may cause injury during the test such as hitting the obstacle.
In the current study, we implemented a virtual reality gamed based obstacle crossing paradigm using wearable sensors for quantifying subject’s ability for successfully crossing a series of virtual obstacles. The implemented portable system provides real time joint position feedback from lower limbs and uses virtual obstacles thereby, posing minimum risk of injury to participants. The visual feedback of the joint position can be removed when desired in order to measure the feed-forward response of the participant to approaching obstacle.
2. Methodology
2.1 Subject Recruitment
Sixty-seven eligible subjects with age ranging from 38 and 75 years were recruited from podiatry clinics in Chicago-USA and Doha-Qatar over the span of eight weeks. Subjects were eligible for participation if they were able to walk at least 20m without any walking aid. Additionally, individuals were required to have the ability to cross obstacles without assistance and no restrictions on the passive ranges of motion of the knees, hips, ankles, and MTP joints. Subjects were excluded if diagnosed with cognitive, vestibular, or central neurological dysfunction, musculoskeletal abnormality, foot ulcers, Charcot’s joints, rheumatic diseases, or a history of a balance disorder unrelated to DPN. Furthermore, subjects were excluded if they had previous surgeries, diseases, or disorders other than diabetes mellitus (DM) type II that caused nerve damage.
Patients with type 2 diabetes which were diagnosed by the primary physician and satisfied the above inclusion and exclusion criteria were recruited. Healthy control subjects were matched to the recruited patients for age (±5 years), gender and BMI. Evidence of DPN was confirmed using the criteria explained in the ADA statement [24] and defined by insensitivity of a 10 gram Semmes-Weinstein monofilament at 1-3 sites in the following locations: hallux, 1st, 3rd, and 5th metatarsal heads and vibratory perception threshold (VPT) of 25v or higher. Severity of neuropathy was quantified by VPT. Participants were classified into three groups including: Group 1: healthy, Group 2: type 2 diabetes without DPN, Group 3: type 2 diabetes with DPN.
Written consent was taken from all participants through an IRB approved consent form. The study was approved by Hamad Medical Corporation (HMC), Doha (Qatar) and Rosalind Franklin University of Medicine and Science (RFUMS, North Chicago, USA).
2.2 Equipment and Graphical Interface
The current research study implemented a novel obstacle crossing paradigm with a virtual game based interface that provides real time joint position information to the participant and measures various obstacle crossing parameters. Participants were presented with a virtual interface on a laptop screen placed in front of them. Their lower extremities were represented as a stick model in the center of the screen with the body facing the right side of screen as illustrated in Figure 1. Any motion of the lower extremities (e.g. lifting the foot from ground) was captured by five wearable inertial sensors (LegSys™, Biosensics LLC, MA, USA) attached to each shank, thigh, and subject’s lower back using elastic bands (Fig 1). Each sensor has a tri-axial accelerometer, tri-axial gyroscope and a tri-axial magnetometer. The system has a built-in memory to record and transfer data in real-time at frequency of 100Hz using a wireless connection based on WiFi protocol. A five-link biomechanical model of human body was developed to represent each shank and thigh as well as trunk segments and estimate the position of ankle, knee, and hip joints. The model assumed hip as a fix joint and animates other segments around the hip joint. The position of each joint was estimated based on length of each segment and matrix of rotation extracted from the inertial sensors using quaternion approach.[7]
Figure 1.
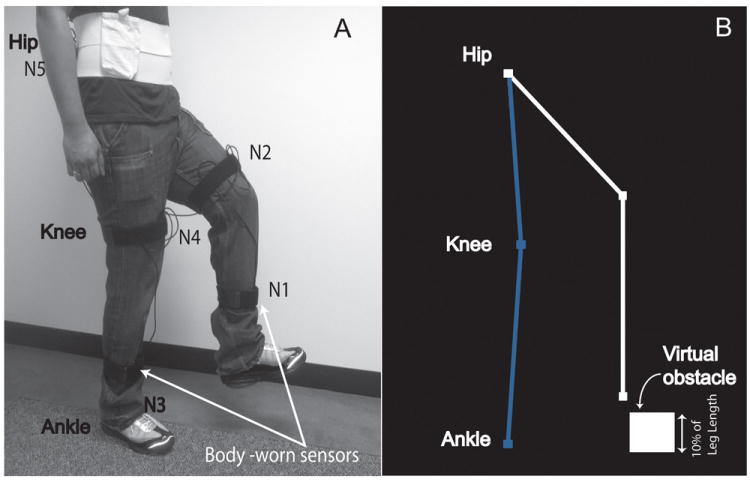
(A) Illustration of mounting of body worn sensors. The shank and thigh sensors were mounted on the front side of the segments. The lower back sensor, battery, and hub were mounted on a wide custom made Velcro belt. (B) Illustration of virtual obstacle paradigm. The motion of lower extremities was captured by mounted inertial measurement units and replicated on the laptop screen in real time as feedback for the participant.
2.3 Protocol and Assessment
Before the measurement trials began the participants were explained the paradigm and allowed visualization of their limbs on the screen of computer to become familiar with system (Fig. 2). The height of each individual was inserted to the program to estimate the length of lower body segments including each shank and thigh and estimate the height of virtual obstacle proportion to the length of leg. The method of estimation of body segment length from subject’s stature was described in our previous publication.[7] This technique allows creating a realistic virtual environment for the subject. During measurement trials the stick model representing the lower extremities stood upright in the middle of the computer screen and a virtual obstacle appeared at the right end of the monitor and moved towards the participant at a speed of 0.25m/s appropriately translated into pixels resolution of the monitor. The participants were expected to avoid the approaching virtual obstacle by lifting their foot off the ground as the obstacle approached closer. If the approaching obstacle was successfully avoided by lifting the foot to an appropriate height; the obstacle disappeared and a positive feedback sound was played. However, if the obstacle was hit; the obstacle disappeared with a negative feedback sound. A total of four blocks were performed; one practice and three assessments. Each block included ten trials of approaching obstacles and the time associated with each block was 2-3 minutes; one minute break between successive blocks was given to avoid fatigue. The obstacle height was chosen based on previously conducted research studies [15,25]. Subjects first initiated practice with an obstacle size of 5% of their leg length to become familiar with the protocol and virtual environment. Then, performance of subjects in crossing virtual obstacles was examined at 10% and 20% of subject’s leg length. For all trials, a visual and audio feedback was provided as described above. If the participant experienced difficultly in maintaining balance during the trials, the measurements were stopped and no further data was collected from the participant.
Figure 2.
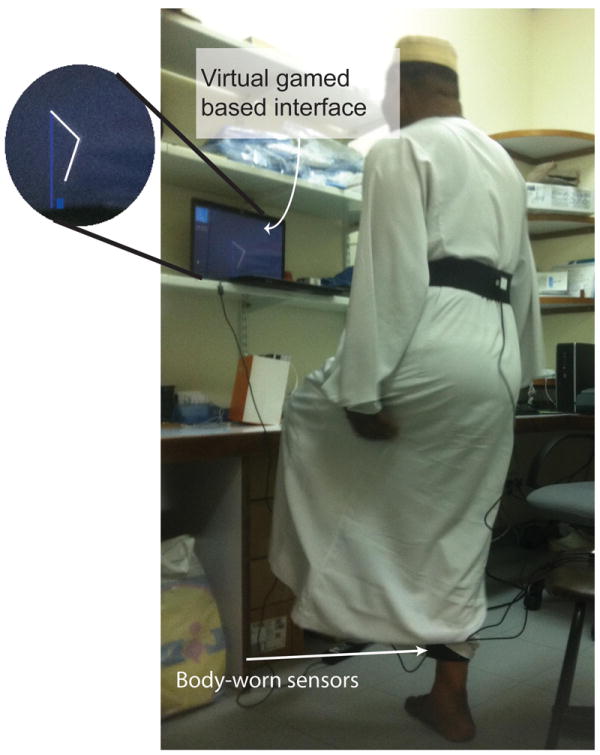
Protocol of test. Participants were presented with a virtual interface on a laptop screen placed in front of them. Their lower extremities were represented as a stick model in the center of the screen with the body facing the right side of screen
2.4 Study outcomes
Performance of participant for crossing virtual obstacles was quantified by measuring obstacle crossing success rate (OCSR), toe-obstacle clearance (TOC), and reaction time (TR). OCSR defined by number of successful obstacle avoidances divided by total obstacle trials multiply by 100. TOC was defined as the vertical distance between foot and obstacle’s top edge measured from the stick model and virtual obstacle presented on the laptop screen. TR was quantified as time from lifting the foot above a defined threshold to the time the foot successfully avoided or hit the approaching obstacle. Each parameter was estimated for all the ten trials at each obstacle size and then averaged for each individual.
2.5. Statistical Analysis
Independent-sample Kruskal-Wallis 1-way ANOVA test and Scheffe’s Post Hoc test were used to examine the difference between groups as well as between DPN and other groups. Mann-Whitney U-test (two samples) was used to compare the results between each two groups. Between groups difference for gender and type of antidiabetic therapy was tested using chi-square test. Repeated measures ANOVA test was used to examine significant change in performance between different obstacle sizes. If the data was found to not be spherical a Huyhn Feldt adjustment was used to determine significance. When a significant difference (p< 0.05) was found the Least Significance Difference test was used as the post-hoc to assess pairwise comparisons. Spearman correlation of coefficient was used to examine whether change in obstacle clearance parameters had significant correlation with neuropathy severity quantified by the Vibration Perception Threshold (VPT) score. Linear regression model (stepwise) was used to identify significant predictors for predicting neuropathy severity. Results were expressed as means +/- standard deviation (SD). A p-value of less than or equal to 0.05 was considered statistically significant. Statistical analyses were performed using SPSS® version 19.
3 Results
3.1 Recruitment and subject demographics
Sixty-seven participants (Age: 55.4±8.9; BMI: 28.1±5.8) were recruited. Two participants could not follow the protocol and the program crashed resulting in complete loss of data during trials for four different participants. Table I summarized demographic of subjects included in data analysis for each group. Thirty percent of participants were female. No significant difference was found between groups for age, height, weight, gender, and BMI of participants (p>0.05). The average history of diabetes for non DPN group was 10±7 years and for DPN group was 14±8. The average of VPT was 10.5±5.8v, 15.4±6.5, and 44.2±17.7v respectively for healthy, diabetes without neuropathy, and DPN group. Hemoglobin A1C level was slightly higher in neuropathy group compared to non-neuropathy (7.0±1.7% v. 8.0±2.3%) but the difference was not statistically significant (p=0.28, 95%CI=[-2.6,0.9]).
Table I.
Participant Demographic Information.
| Group | Number | Health status | Age (Years) | BMI (kg/m2) | Sex (%of men) | VPT (volt) | History of Diabetes (Years) | HbA1C (%) | Type of antidiabetic therapy (% of insulin therapy) |
|---|---|---|---|---|---|---|---|---|---|
| Group 1 | 13 | Non diabetes control subjects | 55±10 | 27.0±6.1 | 10.5±5.8 | 0 | - | - | |
| Group 2 | 13 | Diabetes without peripheral neuropathy | 52±7 | 29.3±9.6 | 15.4±6.5 | 10±7 | 7.0±1.7 | 7.7% | |
| Group 3 | 35 | Diabetes with peripheral neuropathy 25v≤VPT≤35v | 57±9 | 28.2±4.4 | 44.2±17.7 | 14±8 | 8.0±2.3 | 14.3% |
3.2 Obstacle Crossing Success Rate (OSCR)
There was no incidence of complete loss of balance during any of the trials for any participant. Table II summarized obstacle crossing performance for each group and each obstacle size. Overall, OSCR were deteriorated in DPN group compared to other groups for all obstacle sizes. However, only at obstacle size of 10% of leg size, the difference achieved statistical significant level (Fig. 3A). At 10% obstacle size, OCSR in DPN group was reduced 22% and 26% respectively compared to healthy (p=0.05, diff=-19%, 95%CI=[-38,0]%) and diabetes without DPN groups (p<0.01, diff=-24%, 95%CI=[-42,-5.5]). OSCR at obstacle size of 10% was negatively correlated with the age (r=-0.33, p=0.01) and BMI (r=-0.32, p=0.02) of participants. Interestingly, results also suggest that by increasing neuropathy severity quantified by VPT, obstacle success rate was significantly reduced (r=-0.5, p<10-6).
Table II.
Obstacle Crossing Performance
| Obstacle size, % of leg length | Group 1 | Group 2 | Group 3 | p-value comparison between groups |
p-value comparison between DPN and non-DPN |
|
|---|---|---|---|---|---|---|
| OCSR, % | 10% | 87±23 | 92±21 | 68±29 | 0.01 | 0.001 |
| 20% | 86±25 | 86±21 | 74±43 | 0.44 | 0.15 | |
| TR, % | 10% | 0.83±1.13 | 1.13±0.74 | 1.36±0.61 | 0.04 | 0.04 |
| 20% | 0.77±0.42 | 1.23±0.95 | 1.44±0.56 | 0.01 | 0.02 | |
| TOC, cm | 10% | 21±9 | 25±9 | 18±10 | 0.06 | 0.009 |
| 20% | 20±10 | 21±11 | 15±6 | 0.05 | 0.01 |
Figure 3.
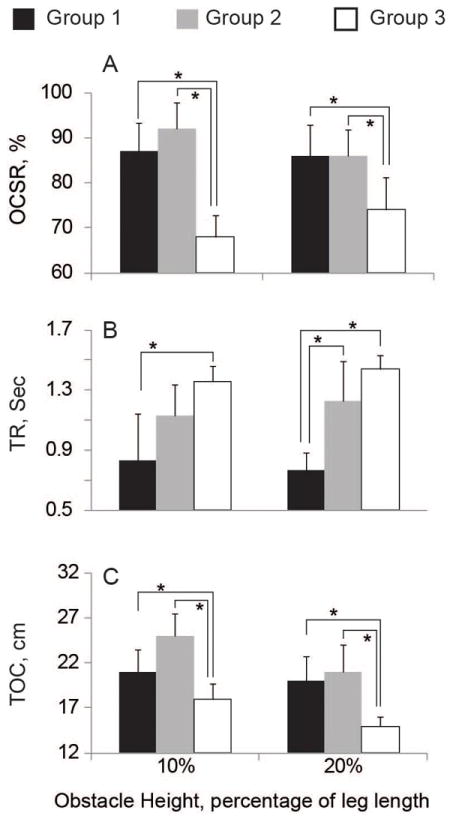
(A) Obstacle crossing Success rate (OCSR), (B) Reaction time (TR), and (C) Toe-obstcle clearance for healthy (Group 1), diabetes without neuropathy (Group 2), and diabetes with diagnosed peripheral neuropathy (Group 3).
3.3 Reaction Time (TR)
Between groups comparison suggests that reaction time is significantly different between groups (Table II). In summary, both DPN and non DPN groups had slower reaction times than healthy subjects irrespective of neuropathy. On the same note, comparison between the DPN group and non-DPN group suggest that neuropathy is associated with slower reaction times. At 10% obstacle size, TR was increased in DPN group by 64% and 20% on average compared to group 1 (healthy) and group 2 (diabetes without DPN) respectively (p<0.05). Interestingly, TR was positively correlated with VPT (r=0.50, P<10-3, Fig 4) suggesting that by increasing neuropathy severity, the reaction time is slowing down. The correlation reached its maximum value for the group 2 (r=0.65, p<10-5). No significant correlation was found between TR and BMI as well as the age of participants (r<0.1, p>0.2). The results were consistent for both obstacle sizes.
Figure 4.
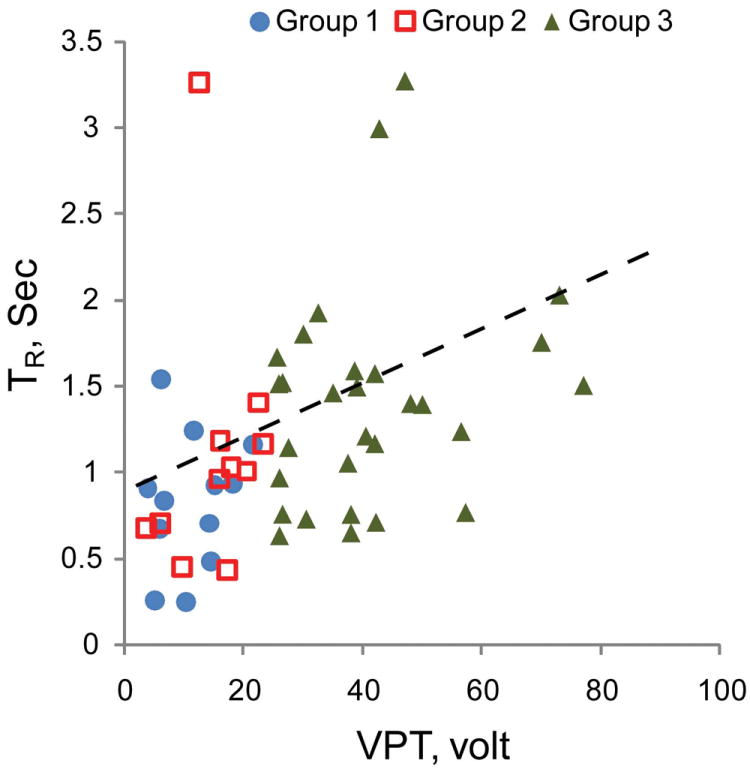
The graph plots the relationship between VPT score and reaction time of participants to approaching obstacles.
3.4 Toe-Obstacle Clearance (TOC)
Figure 3C plots the toe obstacle clearance observed among different groups and obstacle sizes. TOC was significantly reduced in the DPN group compared to other groups for both obstacle sizes (P<0.01, Table II). However, no significant difference was found between DPN and non-DPN. While TOC remained the same by doubling the obstacle size (21±9cm for 10% v. 20±10cm for 20%), the TOC was reduced for both diabetes with and without DPN by doubling the obstacle size. In the DPN group, TOC was reduced by 16% by increasing the obstacle size from 10% to 20% (p=0.02, diff=-2.8cm, 95%CI=[-6.3,-0.4]cm). A similar trend was identified for non DPN subjects (p=0.03, diff=-2.8cm (15%), 95%CI=[-6.8,-0.5]cm) suggesting that independent of neuropathy, the ability of subjects in crossing higher obstacle size is reduced in patients with diabetes. No significant correlation was observed between TOC and age, BMI, and VPT (r<0.1, p>0.3) for an obstacle size of 10% of the subject’s leg length. However, by increasing the obstacle size to 20%, a negative correlation was observed between VPT and TOC (r=-0.3, p<0.05) suggesting that more severe neuropathy was associated with a reduction in the ability to cross higher obstacles. Similar to finding with tests of obstacle size of 10%, no significant correlation was found between TOC and age and BMI of participants for obstacle size of 20%.
3.5 Evaluation of Neuropathy Severity
To identify significant predictors for evaluating neuropathy severity, a stepwise linear regression model was used. The dependent variable was VPT assuming a suitable predictor to evaluate neuropathy severity. The independent variables were TR, OCSR, and TOC estimated at obstacle size of 10%, as well as their changes from obstacle size of 10% to 20% of leg size. In addition, age and BMI of participants were assumed as additional independent variables. Table III summarized the results. The model can significantly predict the VPT values with fair-to-good accuracy (r=0.64, p<0.001). Results suggest that age, TR, as well as changes in TR and TOC between obstacle sizes 10% and 20%, are significant predictors for neuropathy severity. Among the study parameters, the change in reaction time between obstacle sizes of 10% and 20% is the most sensitive predictor with odds ratio of 2.69 indicating more delay in reaction when the obstacle size becomes bigger and severity of neuropathy is increasing.
Table III.
Neuropathy severity predictors
| Independent variables | Coefficient | p-value |
|---|---|---|
| Age | 0.92 | 0.001 |
| BMI | 0.05 | 0.90 |
| TR | 6.7 | 0.12 |
| TOC | -0.60 | 0.05 |
| OCSR | -0.15 | 0.28 |
| ΔTR | 14.9 | 0.02 |
| ΔTOC | -1.1 | 0.007 |
| ΔOCSR | 0.06 | 0.39 |
4. Discussion
Obstacle crossing has been the focus of research for a long time. But so far the tools implemented for measuring kinematic parameters have been limited to gait laboratories equipped with motion tracking system [15-19,21] which might not be suitable for a clinical environment and may also not reflect real-world environment response of an individual [20,23,26]. In addition, the conventional systems have other short-comings; like use of actual obstacles during experiments, which may increase the risk of adverse event during testing, required dedication of expensive infrastructure and relatively large space that is not readily available for the vast majority of patients, need for expert technicians and longer time periods associated in preparation and trials. Very few studies have assessed obstacle crossing using technologically advanced wearable sensors [20] that would not require motion tracking. However, often due to heavy cost of calculation (e.g. double integration of acceleration to estimate toe-clearance), these systems are incapable of real time joint position estimation, which is of key importance for virtual reality application. To our best knowledge, our proposed technique is the first system allows the assessment of obstacle crossing ability using a combination of body worn sensors and virtual reality.
The major affect of loss of joint proprioception and sensation is on gait and balance [3,4,6,7,27]. Diabetic neuropathy is known to reduces ankle muscle strength even before diabetic neuropathy is diagnosed [10]. The reduced joint proprioception makes obstacle negotiation difficult and increases the risk of falling. Studies have shown that patients with neurological disorders like diabetes, Parkinson’s disease, and stroke have compromised obstacle negotiation [28,29]. A reduction in toe obstacle clearance during obstacle crossing has been reported among patients with neurological disorders when compared to healthy subjects [15,18,29,30]. Literature suggests that obstacle crossing even among healthy older adults is compromised causing them to adopt different strategies to avoid obstacles [16,17,31]. This study evaluated the proof of concept of an innovative virtual reality game based system for quantifying patient ability in successful avoid obstacles. Three parameters were suggested to quantify obstacle crossing ability including obstacle crossing success rate (OCSR), reaction time (TR), and toe-obstacle clearance (TOC). Results suggest that all three parameters were significantly different between healthy subjects, subjects with diabetic neuropathy, and subjects with diabetes and no neuropathy. Additionally, results suggest that subjects with more severe neuropathy had an increased response delay to an approaching obstacle. On the same note, subject’s reaction to an approaching obstacle was delayed more by increasing the size of the obstacle and increasing the neuropathy severity.
The findings of reduced toe obstacle clearance among DPN were consistent with recent literature [15]. It seems that the combination of loss of joint proprioception coupled with reduced ankle muscle strength would likely cause reduction in TOC ability and OCSR in the DPN group. However, delay in reaction time, in particular by increasing the obstacle size, may be explained by delay in sensory response due to neuropathy, given the fact that the highest correlation was observed only between TR and VPT scores.
Lower rates of obstacle crossing success in patients with DPN is consistence with previous studies suggesting a high risk of falling in DPN group compared to healthy and diabetics without DPN. [5] Our results also suggest that the obstacle crossing success rate in subjects with diabetes without neuropathy was also lower than healthy subjects. This observation is consistence with recent studies suggesting that diabetes is an independent risk factor for falling. [11,12] Additional study is needed to explore whether quantification of obstacle crossing performance could be used as a more sensitive predictor for risk of falling in patients suffering from diabetes.
There are several limitations in this study. First, since real-time joint position visual feedback was provided during assessment, it may have aided somewhat towards increased clearance success rate. This in turn may reduce the effect size for recognizing potential damage in joint perception due to DPN. However, based on the significant differences observed between groups, the authors would like to conclude that the proposed paradigm of virtual obstacle avoidance was a successful attempt towards assessment of joint proprioception. Second, additional study is required to validate whether the observed deteriorations in virtual obstacle crossing performance due to diabetes and DPN are associated with the risk of falling. Third, using vibration perception testing alone may not be an accurate method to quantify neuropathy severity. Additional measures of sensory and autonomic neuropathy may help to assess neuropathy. Finally, the age of the study participants (55.4±8.9 years) is rather young from a geriatric point of view. Although the chronologic age of our population is slightly younger, the chronic medical condition of diabetes and associated comorbidities results in an effective clinical situation where this population physiologically and functionally more consistent with an older population. For example, Reistetter et al [32] by studying 79,526 persons with a first time hip fracture demonstrated that younger patients with diabetes had poorer outcomes (e.g. length of stay (LOS) in the medical rehabilitation unit or hospital) than patients with no diabetes. Their results also suggest that the difference between diabetes and non-diabetes in recovery outcomes after hip fracture is more pronounced in younger subjects than older subjects. This may suggest that fall prevention should be addressed in diabetes in earlier age than non-diabetes.
An early diagnosis of DPN would be of value in providing a change towards foot care before further complications arise. However, conventional modalities such as monofilament and VPT tests often diagnose neuropathy at late stage and are subjective. Gait laboratory based system can be used for an accurate and objective assessment of gait and balance deterioration due to reduce joint proprioception caused by neuropathy. However, these techniques are very expensive, they are not reimbursed by insurers and they are not suitable for busy clinics and routine clinical assessment. Additionally, it could be risky to examine patients who are vulnerable to trauma (such as diabetes) in real condition. Since even a small accident (e.g. hitting real-obstacle) could cause serious adverse event such as diabetic foot ulcer, which is difficult to heal. The proposed technique based on virtual reality can replace the assessments performed in a gait laboratory without imposing any risk to patients and without requirement of expensive motion analyzer systems and/or devoting a big gait laboratory space, which is often unaffordable for many small clinics. Additionally, the developed technique could be used by diabetes at home for assessing their motor function deterioration caused by diabetes and neuropathy, which in turn may help to prevent fall and other associated trauma caused by progression in neuropathy severity.
Finally, the paradigm presented can also be implemented as a training tool for obstacle avoidance/crossing in a virtual environment. Such a motor learning based virtual reality paradigm would be of greater benefit for patients than conventional balance training programs especially in a clinical environment. The visual information plays a significant role on foot elevation in feed-forward control of lower limbs locomotion during obstacle crossing [19]. Significant improvements in gait parameters and foot obstacle clearance using virtual obstacle and real time feedback have been demonstrated in post-stroke patients with hemiplegia [33]. During the actual phase of obstacle crossing an individual does not have complete visual information regarding clearance between the obstacle and the foot; thus they rely on proprioception of the leading limb and feed-forward mechanism of the trailing limb. Therefore, it stands to reason that providing visual feedback during obstacle crossing may be used as a motor learning paradigm to improve feedforward performance (improve in accuracy of prediction) via intact sensory feedbacks (e.g. visual, muscles, ligaments, etc).
Acknowledgments
The project described was supported in part by Award Number T35DK074390 from the National Institute of Diabetes and Digestive and Kidney Diseases and by a grant from the Qatar National Research Foundation (Award Number NPRP08-499-3-109). The content is solely the responsibility of the authors and does not necessarily represent the official views of the National Institute of Diabetes and Digestive and Kidney Diseases or the National Institutes of Health or the Qatar National Research Foundation.
The authors would also like to thank Steve Yeschek, Dr. Omar Haque, Dr. Mohammad Ahmad and Yaser Khan for their tremendous help in patient recruitment and data collection.
Footnotes
Conflict of Interest: None
References
- 1.National diabetes information clearing house. [April 2008];National diabetes statistics. http://diabetes.Niddk.Nih.Gov/dm/pubs/statistics.
- 2.Pirart J. Diabetes mellitus and its degenerative complications: A prospective study of 4,400 patients observed between 1947 and 1973 (author’s transl) Diabete & metabolisme. 1977;3:97–107. [PubMed] [Google Scholar]
- 3.van-Schie CHM. Neuropathy: Mobility and quality of life. Diabetes/Metabolism resaerch and reviews. 2008;24:S45–S51. doi: 10.1002/dmrr.856. [DOI] [PubMed] [Google Scholar]
- 4.Menz HB, Lord SR, St George R, Fitzpatrick RC. Walking stability and sensorimotor function in older people with diabetic peripheral neuropathy. Archives of Physical Medicine and Rehabilitation. 2004;85:245–252. doi: 10.1016/j.apmr.2003.06.015. [DOI] [PubMed] [Google Scholar]
- 5.Cavanagh PR, Derr JA, Ulbrecht JS, Maser RE, Orchard TJ. Problems with gait and posture in neuropathic patients with insulin-dependent diabetes mellitus. Diabet Med. 1992;9:469–474. doi: 10.1111/j.1464-5491.1992.tb01819.x. [DOI] [PubMed] [Google Scholar]
- 6.Turcot K, Allet L, Golay A, Hoffmeyer P, Armand S. Investigation of standing balance in diabetic patients with and without peripheral neuropathy using accelerometers. Clinical Biomechanics. 2009;24:716–721. doi: 10.1016/j.clinbiomech.2009.07.003. [DOI] [PubMed] [Google Scholar]
- 7.Najafi B, Horn D, Marclay S, Crews RT, Wu S, Wrobel JS. Assessing postural control and postural control strategy in diabetes patients using innovative and wearable technology. J Diabetes Sci Technol. 2010;4:780–791. doi: 10.1177/193229681000400403. [DOI] [PMC free article] [PubMed] [Google Scholar]
- 8.Wrobel JS, Najafi B. Diabetic foot biomechanics and gait dysfunction. J Diabetes Sci Technol. 2010;4:833–845. doi: 10.1177/193229681000400411. [DOI] [PMC free article] [PubMed] [Google Scholar]
- 9.Richardson JK, Hurvitz EA. Peripheral neuropathy: A true risk factor for falls. Journals of Gerontolgy A, Biological sciences and medical sciences. 1994;50:M211–215. doi: 10.1093/gerona/50a.4.m211. [DOI] [PubMed] [Google Scholar]
- 10.Gutierrez EM, Helber MD, Dealva D, Ashton-Miller JA, Richardson JK. Mild diabetic neuropathy affects ankle motor function. Clinical Biomechanics. 2001;16:522–528. doi: 10.1016/s0268-0033(01)00034-1. [DOI] [PubMed] [Google Scholar]
- 11.Miller DK, Lui LY, Perry HM, 3rd, Kaiser FE, Morley JE. Reported and measured physical functioning in older inner-city diabetic african americans. J Gerontol A Biol Sci Med Sci. 1999;54:M230–236. doi: 10.1093/gerona/54.5.m230. [DOI] [PubMed] [Google Scholar]
- 12.Volpato S, Leveille SG, Blaum C, Fried LP, Guralnik JM. Risk factors for falls in older disabled women with diabetes: The women’s health and aging study. J Gerontol A Biol Sci Med Sci. 2005;60:1539–1545. doi: 10.1093/gerona/60.12.1539. [DOI] [PMC free article] [PubMed] [Google Scholar]
- 13.Schwartz AV, Hillier TA, Sellmeyer DE, Resnick HE, Gregg E, Ensrud KE, Schreiner PJ, Margolis KL, Cauley JA, Nevitt MC, Black DM, Cummings SR. Older women with diabetes have a higher risk of falls: A prospective study. Diabetes Care. 2002;25:1749–1754. doi: 10.2337/diacare.25.10.1749. [DOI] [PubMed] [Google Scholar]
- 14.Wrobel JS, Crews RT, Connolly JE. Clinical factors associated with a conservative gait pattern in older male veterans with diabetes. J Foot Ankle Res. 2009;2:11. doi: 10.1186/1757-1146-2-11. [DOI] [PMC free article] [PubMed] [Google Scholar]
- 15.Liu M-W, Hsu W-C, Lu T-W, Chen H-L, Liu H-C. Patients with type ii diabetes mellitus display reduced toe-clearance with altered gait patterns during obstacle crossing. Gait & Posture. 2010;31:93–99. doi: 10.1016/j.gaitpost.2009.09.005. [DOI] [PubMed] [Google Scholar]
- 16.Yen H-C, Chen H-L, Liu M-W, Liu H-C, Lu T-W. Age effects on the inter-joint coordination during obstacle-crossing. Journal of Biomechanics. 2009;42:2501–2506. doi: 10.1016/j.jbiomech.2009.07.015. [DOI] [PubMed] [Google Scholar]
- 17.Harley C, Wilkie RM, Wann JP. Stepping over obstacles: Attention demands and aging. Gait & Posture. 2009;29:428–432. doi: 10.1016/j.gaitpost.2008.10.063. [DOI] [PubMed] [Google Scholar]
- 18.Said CM, Goldie P, Culham E, Sparrow W, Patla A, Morris ME. Control of lead and trail limbs during obstacle crossing following stroke. Physical Therapy. 2005;85:413–427. [PubMed] [Google Scholar]
- 19.Mohagheghi A, Moraes R, Patla A. The effects of distant and on-line visual information on the control of approach phase and step over an obstacle during locomotion. Experimental Brain Research. 2004;155:459–468. doi: 10.1007/s00221-003-1751-7. [DOI] [PubMed] [Google Scholar]
- 20.Daniel L, Charry E, Begg R. A prototype wireless inertial-sensing device for measuring toe clearance. 30th Annual International IEEE EMBS Conference; Vancouver, British Columbia, Canada. 2008. pp. 4899–4902. [DOI] [PubMed] [Google Scholar]
- 21.Najafi B, Khan T, Wrobel J. Laboratory in a box: Wearable sensors and its advantages for gait analysis. Conf Proc IEEE Eng Med Biol Soc. 2011;2011:6507–6510. doi: 10.1109/IEMBS.2011.6091605. [DOI] [PubMed] [Google Scholar]
- 22.Najafi B, Miller D, Jarrett BD, Wrobel JS. Does footwear type impact the number of steps required to reach gait steady state?: An innovative look at the impact of foot orthoses on gait initiation. Gait Posture. 2010;32:29–33. doi: 10.1016/j.gaitpost.2010.02.016. [DOI] [PMC free article] [PubMed] [Google Scholar]
- 23.Aminian K, Najafi B. Capturing human motion using body-fixed sensors: Outdoor measurement and clinical applications. Computer Animation and Virtual Worlds. 2004;15:79–94. [Google Scholar]
- 24.Boulton AJ, Vinik AI, Arezzo JC, Bril V, Feldman EL, Freeman R, Malik RA, Maser RE, Sosenko JM, Ziegler D. Diabetic neuropathies: A statement by the american diabetes association. Diabetes Care. 2005;28:956–962. doi: 10.2337/diacare.28.4.956. [DOI] [PubMed] [Google Scholar]
- 25.Lamoureux E, Sparrow W, Murphy A, Newton R. The effects of improved strength on obstacle neogiation in community living older adults. Gait & Posture. 2003;13:273–283. doi: 10.1016/s0966-6362(02)00101-7. [DOI] [PubMed] [Google Scholar]
- 26.Najafi B, Helbostad JL, Moe-Nilssen R, Zijlstra W, Aminian K. Does walking strategy in older people change as a function of walking distance? Gait Posture. 2009;29:261–266. doi: 10.1016/j.gaitpost.2008.09.002. [DOI] [PubMed] [Google Scholar]
- 27.Wrobel J, Najafi B. Diabetic foot biomechanics and gait dysfunction. J Diabetes Sci Technol. 2010;4:833–845. doi: 10.1177/193229681000400411. [DOI] [PMC free article] [PubMed] [Google Scholar]
- 28.Said CM, Goldie PA, Patla AE, Sparrow WA, Martin KE. Obstacle crossing in subjects with stroke. Archives of Physical Medicine and Rehabilitation. 1999;80:1054–1059. doi: 10.1016/s0003-9993(99)90060-6. [DOI] [PubMed] [Google Scholar]
- 29.Vitório R, Pieruccini-Faria F, Stella F, Gobbi S, Gobbi LTB. Effects of obstacle height on obstacle crossing in mild parkinson’s disease. Gait & Posture. 2010;31:143–146. doi: 10.1016/j.gaitpost.2009.09.011. [DOI] [PubMed] [Google Scholar]
- 30.Said CM, Goldie PA, Patla AE, Culham E, Sparrow WA, Morris ME. Balance during obstacle crossing following stroke. Gait & Posture. 2008;27:23–30. doi: 10.1016/j.gaitpost.2006.12.009. [DOI] [PubMed] [Google Scholar]
- 31.Galna B, Peters A, Murphy AT, Morris ME. Obstacle crossing deficits in older adults: A systematic review. Gait & Posture. 2009;30:270–275. doi: 10.1016/j.gaitpost.2009.05.022. [DOI] [PubMed] [Google Scholar]
- 32.Reistetter TA, Graham JE, Deutsch A, Markello SJ, Granger CV, Ottenbacher KJ. Diabetes comorbidity and age influence rehabilitation outcomes after hip fracture. Diabetes Care. 2011;34:1375–1377. doi: 10.2337/dc10-2220. [DOI] [PMC free article] [PubMed] [Google Scholar]
- 33.Jaffe DL, Brown DA, Pierson-Carey CD, Buckley EL, Lew HL. Stepping over obstacles to improve walking in individuals with poststroke hemiplegia. J Rehabil Res Dev. 2004;41:283–292. doi: 10.1682/jrrd.2004.03.0283. [DOI] [PubMed] [Google Scholar]