

Abstract
The order of action of genes in a regulatory hierarchy that is governed by a signal can often be determined by the method of epistasis analysis, in which the phenotype of a double mutant is compared with that of single mutants. The epistatic mutation may be in either the upstream or the downstream gene, depending on the nature of the two mutations and the type of regulation. Nevertheless, when the regulatory hierarchy satisfies certain conditions, simple rules allow the position of the epistatic locus in the pathway to be determined without detailed knowledge of the nature of the mutations, the pathway, or the molecular mechanism of regulation.
There are many examples in developmental biology of a choice between two programs of gene expression in response to an initial signal. For instance, sex chromosome karyotype determines the expression or repression of sex-determining genes in many animals; this in turn directs male or female development1,2. Control of the cell cycle in yeast3, aspects of embryonic pattern formation in Drosophila4, and vulval development5 and programmed cell death6 in Caenorhabditis elegans can also be described in these terms. Given mutations in two genes that affect such a choice, one of the first things one wants to know is the order in which they act. Does one regulate the other and, if so, which one? Genetic epistasis is a powerful tool for answering this question, because it can give answers without knowledge of all the genes in the pathway or the molecular nature of the gene products.
Consider sex determination in C. elegans7. In the wild type, sex is determined by X chromosome dosage. XO worms are males; XX hermaphrodites. If the tra-1 gene is knocked out (i.e. suffers a null mutation), both XO and XX become males. If her-1 is knocked out, both XO and XX become hermaphrodites. The phenotypes of tra-1−; her-1− double mutants are indistinguishable from those of tra-1− single mutants: both XO and XX animals are male. When, as in this case, the single mutations produce different phenotypes from the wild type and from each other, and the double mutant phenotype looks like one of the phenotypes produced by a single mutation, we say that this mutation is epistatic to the other. In this example, tra-1− is epistatic to her-1−. As illustrated in Fig. 1, these results are explained by a model in which X chromosome dosage regulates her-1 activity, her-1 negatively regulates tra-1, and tra-1 is required to direct hermaphrodite development in place of the male ground state. An alternative model in which tra-1 regulates her-1 is inconsistent with the epistasis of tra-1− to her-1−.
FIG 1.
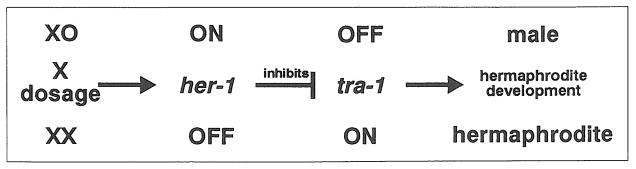
A model for sex determination in C. elegans. In C. elegans sex is determined by X chromosome dosage, acting through two genes her-1 and tra-1. When there is just one X chromosome (XO), her-1 is ON and inhibits tra-1, allowing male development. When there are two X chromosomes (XX), her-1 is OFF, allowing expression of tra-1, which causes hermaphrodite development7.
Is a downstream mutation always epistatic to an upstream mutation? The answer is no. For example, consider a positive regulatory pathway, programmed cell death in C. elegans (Fig. 2)6. In this model, a signal present in cells that are fated to die turns on ced-3- In turn, ced-3 activates unknown genes that kill the cell, and a known gene, ced-1, that causes it to be engulfed by neighboring cells. In a ced-3− mutant none of these downstream genes is turned on, and the cell remains a normal, living cell. In a ced-1− mutant, ced-3 still causes the cell to die, but without ced-1 it cannot be engulfed by neighboring cells, and its corpse persists. A ced-1−; ced-3− double mutant is indistinguishable from a ced-3− single mutant, since ced-1 cannot be activated without ced-3 Thus ced-3− is epistatic to ced-1−.
FIG 2.
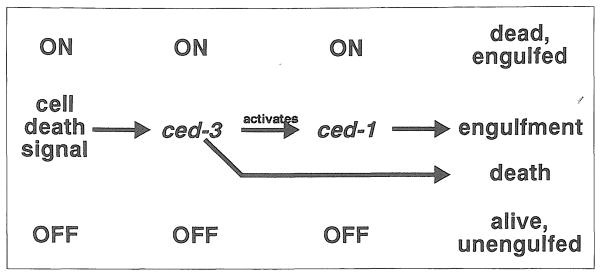
A model for the control of programmed cell death in C. elegans. In C. elegans development many cells undergo a stereotyped cell death program. The genes ced-1 and ced-3 are necessary for the normal completion of this program. The current model6 proposes that in cells fated to die a signal activates ced-3, causing cell death and turning on ced-1, which causes the dead cell to be engulfed by its neighbors. In a cell that would not normally die, ced-3 remains inactive, so the cell remains alive. Furthermore, because ced-3 is inactive, ced-1 also remains inactive, and the cell is not engulfed.
So, there’s a problem. We said that epistasis can be used to figure out the order of gene action. But in one case the downstream gene is epistatic to the upstream gene, and in another the upstream gene is epistatic to the downstream gene. The problem becomes even more complicated if constitutive mutations are considered. How then can epistasis be used to order genes in a regulatory pathway? The answer is that there are rules that determine whether the upstream or downstream gene will be epistatic. But what are the rules? What are the assumptions behind them? Can, one determine experimentally which rule applies to a given problem?
For a certain class of regulatory pathways, we can answer these questions. These pathways are regulatory hierarchies that are controlled by some sort of signal, and that obey the conditions listed in Box 1. In sex determination, the signal is X chromosome dosage, which can be deduced using X-linked marker mutations. In programmed cell death the signal is unknown, but can be determined by its correlation with cell lineage. Extracellular ligands, intracellular second messengers, DNA damage, time, or position in the organism are signals in other pathways. Null and constitutive mutations cause genes to fail to respond to the signal: a null mutant gene is off and a constitutive mutant gene is on, regardless of upstream influences.
Box 1. Assumptions underlying the interpretation of epistasis.
There is a signal that affects phenotype. The experimenter can find out the state of the signal, independently of genotype or phenotype.
The signal and the two genes under study are the sole determinants of phenotype under the conditions of the experiment.
The signal and the two genes are either on or off; there are no intermediate levels of activity. (For instance, partial loss-of-function mutations should be avoided.)
In the wild type the signal determines whether one of the genes (the upstream gene) is on or off; this in turn determines whether the second (downstream) gene is on or off.
It is important to realize that ‘regulation’ and ‘activity’ are extremely broadly defined. One enzyme in a biosynthetic pathway may be said to regulate the activity of a second by providing its substrate, even if both enzymes are present in all cells at all times. You need not know how genes regulate each other to use epistasis analysis. Regulation can be at any level of expression: transcriptional, translational or post-translational. On the other hand, epistasis analysis alone will not tell you in molecular detail how genes are regulated.
General rules for epistasis in a regulatory hierarchy governed by a signal
Given the assumptions in Box 1, there are basically two possible regulatory models: positive regulation, in which the downstream gene is on when the upstream gene is on, and negative regulation, in which the downstream gene is on when the upstream gene is off. An analysis of all possible combinations of null and constitutive mutations in both types of models, summarized in Table 1, allows three important generalizations:
Table 1.
Determining gene order in regulatory hierarchies by epistasis analysis
| Which signal states display mutant phenotypes? | Epistatic mutation | Type of mutation
|
Sign of regulation | |
|---|---|---|---|---|
| Upstream gene | Downstream gene | |||
| Same | Upstream | Null | Null | + |
| Constitutive | Constitutive | + | ||
| Null | Constitutive | − | ||
| Constitutive | Null | − | ||
| Opposite | Downstream | Null | Null | − |
| Constitutive | Constitutive | − | ||
| Null | Constitutive | + | ||
| Constitutive | Null | + | ||
The results of analysis of the eight possible cases in which regulation may be positive or negative and mutations either null or constitutive. In all eight cases, if there is simple epistasis, the epistatic mutation can be uniquely predicted to be in either the upstream or the downstream gene.
-
A given mutation only affects phenotype either when the signal is on, or when the signal is off, but not both.
For example, her-1− null mutations have a phenotype only in XO worms, and tra-1− null mutations only in XX worms.
-
If two mutations have phenotypic effects in opposite signal states and one is epistatic to the other, it is the downstream mutation that is epistatic to the upstream mutation.
In sex determination, tra-1− lies downstream of her-1−, and is epistatic to it.
-
If two mutations have phenotypic effects in the same signal state and one is epistatic to the other, it is the upstream mutation that is epistatic to the downstream mutation.
In the cell death pathway, ced-3− lies upstream of ced-1−, and is epistatic to it.
To see how these relationships arise we will go into one example in detail, before returning to a review of the applications of epistasis analysis and demonstrating some potential pitfalls.
Rules for a particular cases epistasis between null mutations in a positive regulatory hierarchy
Consider a positive regulatory hierarchy: the upstream gene (ups) and the downstream gene (dwn) could be ced-3 and ced-1, for instance. When the signal is off in the wild type, ups and dwn are off, and we call the resulting phenotype 000, with the zeroes standing for the off states of the signal, ups and dwn, respectively (Table 2, first row). In the cell death pathway, this would be a normal, living cell. If the signal is on, ups and dwn will both be on (111), corresponding to a dead, engulfed cell.
Table 2.
Epistasis between null mutations in a positive regulatory pathway
| ups genotype | dwn genotype | Signal off
|
Signal on
|
||||
|---|---|---|---|---|---|---|---|
| ups activity | dwn activity | Phenotype | ups activity | dwn activity | Phenotype | ||
| + | + | Off | Off | 000 (alive) | On | On | 111 (dead) |
| − | + | Off | Off | 000 (alive) | Off | Off | 100 (alive) |
| + | − | Off | Off | 000 (alive) | On | Off | 110 (persistent corpse) |
| − | − | Off | Off | 000 (alive) | Off | Off | 100 (alive) |
Phenotypes of cell death mutants are in parentheses.
Additional phenotypes can potentially arise in mutants. If the signal is on in an ups− null mutant (second row), we get 100, an absence of activities that does not occur in the wild type. This may produce a novel phenotype, or it may be indistinguishable from one of the wild-type phenotypes. In the cell death pathway, 100 looks just like 000, a living cell. The second opportunity for a new phenotype arises when the signal is on in dwn− null mutants (110). In the case of cell death this is in fact a phenotype never seen in the wild type: a persistent (nonengulfed) corpse.
In the ups−; dwn− double mutant both genes are always off because of the null mutations. We get 000 (live cell) when the signal is off and 100 (live cell) when the signal is on. This pattern of phenotypes is exactly the same as for the ups− single mutant, and distinct from the patterns for both the dwn− single mutant and wild type. ups− is therefore epistatic to dwn−.
Applications and potential misapplications
Table 3 lists several examples of the use of epistasis to determine the order of gene action. This list is not comprehensive, yet there are examples in yeast, worms, flies and plants, covering a wide range of biological processes. Epistasis analysis can be used repeatedly between different pairs of genes in the same complicated pathway to build elaborate maps of the order of gene action (see, for example, Refs 5, 7, 8).
Table 3.
Examples of epistasis analysis from yeast, worms, flies and plants
| Organism | Pathway | Signal | Upstream mutation | Downstream mutation | Ref. |
|---|---|---|---|---|---|
| Same states affected (upstream gene epistatic): | |||||
| S. cerevisiae | Cell cycle progression | Time | cdc28− | cdc4− | 3 |
| C. elegans | Programmed cell death | Lineage | ced-3− | ced-1− | 6 |
| C. elegans | Vulval development | Position | n300 | lin-15− | 5 |
| D. melanogaster | Sex determination | X: autosome ratio | tra− | ix− | 12 |
| Opposite states affected (downstream gene epistatic): | |||||
| S. cerevisiae | Mating type interconversion | Mother/daughter cell | swi5− | sdi1− | 13 |
| S. cerevisiae | Invertase expression | Glucose | snf1− | cid1− | 14 |
| S. cerevisiae | Cell cycle progression | α mating pheromone | cdc39− | ste4− | 9 |
| S. cerevisiae | Biosynthetic enzyme expression | Amino acid starvation | GCN2c | gcn3− | 15 |
| C. elegans | Larval/adult development | Time | lin-4− | lin-14− | 16 |
| C. elegans | Vulval development | Gonadal signal | let-23− | let-60c | 17 |
| C. elegans | Dauer larva formation | Pheromone | daf-1− | daf-12− | 18 |
| D. melanogaster | Segment identity | Position | esc− | BX-C− | 19 |
| D. melanogaster | Dorsoventral development | Position | fs(1)K10− | gurken− | 4 |
| D. melanogaster | Development of termini | Position | torsoc | tailless− | 20 |
| A. thaliana | Flower development | Position | superman− | pistillata− | 21 |
Superscript c denotes constitutive mutations.
There are dangers. To derive our rules, we made four assumptions (Box 1). If any one of these assumptions is false, the rules may lead to incorrect conclusions. We will give two examples.
Consider a bacterium that normally produces white colonies, but in response to ultraviolet (UV) light synthesizes a pigment (Fig. 3a). UV is sensed by the product of a gene called uvsA, which stimulates the transcription of a gene pigA that encodes an enzyme for the synthesis of pigment. A null mutation in pigA results in white colonies in both the presence and absence of UV. A partial loss-of-function mutation in uvsA results in colonies that change from white to slightly pigmented when exposed to UV. Since both mutations change the phenotype only in the presence of UV, the upstream gene ought to be epistatic. However, pigA−, the downstream mutation, is epistatic to the upstream uvsA− mutation.
FIG 3.
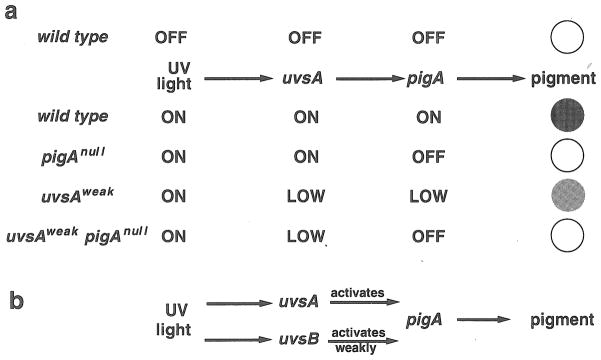
An example of misapplication of epistasis analysis. (a) In this hypothetical example a bacterium responds to UV light by synthesizing a protective pigment (shown as dark gray). The gene pigA, which encodes an enzyme that synthesizes the pigment, is activated in the presence of UV by a sensor encoded by uvsA. In the absence of UV, both genes are off and the bacteria produce a white colony. In the presence of UV both are fully on, and a pigmented colony results. A pigA null mutant (pigAnul1) is incapable of producing pigment and so remains white even in the presence of UV. A uvsA partial loss-of-function mutant (uvsAweak) responds only weakly to UV, producing low pigA activity and a slightly pigmented colony. The pigA null, although downstream, is epistatic to the uvsA partial loss-of-function mutation, since the double mutant remains white in UV. (b) In this variation of the model, UV light is sensed by two sensors, a major sensor encoded by uvsA and a minor sensor encoded by uvsB, which by itself can only weakly activate pigA. The epistasis relationship between a uvsA null mutation and a pigA null mutation in this model is identical to that between the uvsA partial loss-of-function mutation and the pigA null mutation in part (a). In particular, the uvsA null single mutant makes a slightly pigmented colony in UV light, because uvsB is still able to weakly activate pigA, and the double mutant makes a white colony, because it cannot synthesize pigment.
The rules fail in this case because the two-state assumption is violated. pigA has three states of activity, which might be called off, low and on. The low state occurs in a uvsA− mutant when exposed to UV. It might be objected that the problem results from a well known pitfall in epistasis analysis: use of a partial loss-of-function mutation of uvsA, rather than a null mutation (see, for example, Refs 9 and 10). A careful genetic analysis would reveal that uvsA− is not null. However, while such analysis is a valuable precaution, it will not always solve the problem. We can show this by slightly modifying the example. Suppose there are two UV sensors, a major one called uvsA and a minor one, not known to the researchers, that we will call uvsB (Fig. 3b). A uvsA− null mutant becomes slightly pigmented in UV light because uvsB can cause a small residual activation of pigA. Again, although both mutations affect colony color only in the presence of UV, the downstream pigA− mutation is epistatic to the upstream uvsA− mutation. In fact, one can develop a model precisely analogous to this in which ced-1 regulates ced-3, but there is some residual ced-3 expression in the absence of ced-1, leading to a persistent corpse.
This example shows why epistasis analysis alone is not a completely reliable method for determining the order of gene action. In general, a combination of molecular (e.g. direct measurement of ced-3 protein levels) and classical genetic methods will be required to confirm a model.
A second example is drawn from the analysis of vulval development in C. elegans (Fig. 4). There are two types of larval blast cells: central cells that have the potential to form a vulva (shown as white), and end cells that do not (gray). Some of the central cells are induced to form a vulva (black) by a signal from the gonad. Central cells that do not receive a signal lose the ability to form a vulva (gray). In multivulva mutants such as lin-15−, all central cells act as if they receive the signal, so that extra vulvae are formed. Signalling is blocked by vulvaless mutations like let-23−, so none of the central cells forms a vulva. let-23− is epistatic to lin-15−. Since let-23− has phenotypic effects only in the cells that receive the signal, and lin-15− has phenotypic effects only in the ones that do not, the second of our three rules applies. We conclude that let-23 is downstream of lin-15 (Ref. 5).
FIG 4.

Vulval development in C. elegans. In wild-type C. elegans larvae, there are two types of epidermal blast cells. Those in the center of the worm (white) have the potential to form a vulva in response to a signal from the gonad. Those near the ends (gray) do not. In multivulva mutants such as lin-15, all central cells form vulvae, even if they don’t receive a signal from the gonad. In most vulvaless mutants (e.g. let-23) the central cells cannot perceive the gonadal signal and do not form a vulva. In an exceptional vulvaless mutant, n300, central cells take on the fates of end cells, so that there are no cells with the potential for vulval lineages.
n300 is another vulvaless mutation that is superficially similar in phenotype to let-23−, and like let-23− is epistatic to lin-15−. Yet n300 is believed to act upstream of lin-15−. Why is n300 different from let-23−? By carefully examining the behavior of the blast cells in young larvae, Ferguson et al.5 found that they could distinguish between cells that had the potential to form a vulva (white) and those that did not (gray), regardless of position, because the former divide once before committing to a nonvulval fate. When they examined n300 larvae, they found that none of the blast cells divided. That is, n300 appeared to transform central blast cells into end blast cells.
This example shows how critically the interpretation of epistasis experiments can depend on understanding mutant phenotypes that may be quite subtle. If phenotype is changed in both signal states, the assumptions (Box 1) are wrong, and the rules cannot be used. The n300; lin-15− epistasis experiment can be interpreted by considering position (end versus central) to be the signal that acts in this pathway. In the wild type, position determines whether a blast cell has the potential to respond to the gonad. Since n300 and lin-15− both affect central cells and have no effect on end cells, the third rule applies, and the upstream mutation, n300, is epistatic.
Conclusion
We have shown how epistasis analysis is used to work out the relationships between genes in a regulatory hierarchy governed by a signal. (It is important to realize, however, that our analysis is not universal. For instance, although epistasis analysis can be used to order genes in a constitutive biosynthetic pathway, the logic is not the same as used here.) We say ‘is used’ because we believe these rules are already implicitly in use, and that the logic used to derive them is just a generalization of what has been tacitly used in the past. Our intention is to make explicit the assumptions on which the rules are based.
What good does it do to make the assumptions explicit? Suppose you have a case such as the cell death pathway, where two mutations have phenotypic effects for similar signal states, and one mutation is epistatic. Then either the epistatic mutation is upstream, or the assumptions on which the epistasis rules are based are false. This conclusion is logically rigorous, and it suggests experiments. For instance, one of the assumptions is that the phenotype of a cell is determined by the state of the signal and the expression of the two genes in that cell. In what ways might this be incorrect? One possibility is that the phenotype of one cell depends on gene expression in surrounding cells. (Indeed, one can construct models for cell death in which phenotype is nonautonomously determined, and ced-1 is upstream of ced-3.) This possibility can then be tested, for instance by genetic mosaic analysis11.
Acknowledgments
This work was supported by Research Grant HL46154 to L.A. from the US Public Health Service and by a fellowship to S.A.W. from the Packard Foundation. We thank Cori Bargmann, Siegfried Hekimi, Jonathan Hodgkin and Jim Thomas for comments.
References
- 1.Hodgkin J. Nature. 1990;344:721–728. doi: 10.1038/344721a0. [DOI] [PubMed] [Google Scholar]
- 2.McLaren A. Trends Genet. 1988;4:153–157. doi: 10.1016/0168-9525(88)90020-0. [DOI] [PubMed] [Google Scholar]
- 3.Hereford LM, Hartwell LH. J Mol Biol. 1974;84:445–461. doi: 10.1016/0022-2836(74)90451-3. [DOI] [PubMed] [Google Scholar]
- 4.Schüpbach T. Cell. 1987;49:699–707. doi: 10.1016/0092-8674(87)90546-0. [DOI] [PubMed] [Google Scholar]
- 5.Ferguson EL, Sternberg PW, Horvitz HR. Nature. 1987;326:259–267. doi: 10.1038/326259a0. [DOI] [PubMed] [Google Scholar]
- 6.Ellis HM, Horvitz HR. Cell. 1986;44:817–829. doi: 10.1016/0092-8674(86)90004-8. [DOI] [PubMed] [Google Scholar]
- 7.Hodgkin J. In: The Nematode Caenorhabditis elegans. Wood WB, editor. Cold Spring Harbor Laboratory Press; 1988. pp. 243–279. [Google Scholar]
- 8.Garret S, Broach J. Genes Dev. 1989;3:1336–1348. doi: 10.1101/gad.3.9.1336. [DOI] [PubMed] [Google Scholar]
- 9.Neiman AM, Chang F, Komachi K, Herskowitz I. Cell Regul. 1990;1:391–401. doi: 10.1091/mbc.1.5.391. [DOI] [PMC free article] [PubMed] [Google Scholar]
- 10.Shuster JR. Mol Cell Biol. 1982;2:1052–1063. doi: 10.1128/mcb.2.9.1052. [DOI] [PMC free article] [PubMed] [Google Scholar]
- 11.Yuan JY, Horvitz HR. Dev Biol. 1990;138:33–41. doi: 10.1016/0012-1606(90)90174-h. [DOI] [PubMed] [Google Scholar]
- 12.Baker BS, Ridge KA. Genetics. 1980;94:383–423. doi: 10.1093/genetics/94.2.383. [DOI] [PMC free article] [PubMed] [Google Scholar]
- 13.Nasmyth K, Stillman D, Kipling D. Cell. 1987;48:579–587. doi: 10.1016/0092-8674(87)90236-4. [DOI] [PubMed] [Google Scholar]
- 14.Neigeborn L, Carlson M. Genetics. 1987;115:247–253. doi: 10.1093/genetics/115.2.247. [DOI] [PMC free article] [PubMed] [Google Scholar]
- 15.Hannig EM, Williams NP, Wek RC, Hinnebusch AG. Genetics. 1990;126:549–562. doi: 10.1093/genetics/126.3.549. [DOI] [PMC free article] [PubMed] [Google Scholar]
- 16.Ambros V. Cell. 1989;57:49–57. doi: 10.1016/0092-8674(89)90171-2. [DOI] [PubMed] [Google Scholar]
- 17.Han M, Sternberg PW. Cell. 1990;63:921–932. doi: 10.1016/0092-8674(90)90495-z. [DOI] [PubMed] [Google Scholar]
- 18.Vowels JJ, Thomas JH. Genetics. 1992;130:105–123. doi: 10.1093/genetics/130.1.105. [DOI] [PMC free article] [PubMed] [Google Scholar]
- 19.Struhl G. Nature. 1981;293:36–41. doi: 10.1038/293036a0. [DOI] [PubMed] [Google Scholar]
- 20.Klingler M, Erdélyi M, Szabad J, Nüsslein-Volhard C. Nature. 1988;335:275–277. doi: 10.1038/335275a0. [DOI] [PubMed] [Google Scholar]
- 21.Bowman JL, et al. Development. 1992;114:599–615. doi: 10.1242/dev.114.3.599. [DOI] [PubMed] [Google Scholar]