Abstract
In this study we aimed to determine the soft tissue norms for the North Indian population based on the laymen perception of facial esthetics and to test the hypothesis that there are racial differences in cephalometric measurement between North Indians and White Americans norms. Two sets (Facial frontal and profile photographs) of 170 standardized facial photographs (76 males and 94 females in the age group of 18–28 years) were taken. A panel of judges which consisted of 20 laymen evaluated the photographs on the visual analogue scale to select a sample of 120 subjects (60 males and 60 females), which included individuals with esthetically pleasing appearance. Digital lateral cephalograms were made and anatomic landmarks were identified directly on the digital images. Seventeen soft tissue variables taken from Subtenley’s, Holdaway’s, Ricketts and Legan’s analysis were calculated electronically using the Dolphin (version 9) software package. Most measurements were similar to the white American norms, some differences were noticed in nasal prominence, basic upper lip thickness, and ‘H’ angle measurements. The independent-sample t test was used to compare the measurement differences of the North Indian men and women. North Indian males have relatively prominent and thicker upper lip, and increased basic upper lip thickness than the females. Lower lip was found to be more protrusive in females than in males.
Keywords: Soft tissue profile, Ethnic difference, Photographs, Cephalometric analysis
Introduction
Esthetics, as a subjective notion, has been defined in the past with expressions such as “the beautiful is that which pleases universally without a concept” by Kant [1], or “beauty is in the eye of the beholder” by Hungerford [2]. Facial esthetics is a key, not only to a person’s attractiveness and to powers of natural attraction to other people, but to their own self-confidence and esteem. Though the perception of beauty has always been a subject of interest and importance to people of all cultures, its quantification has changed over the centuries and differs from one population to another. Since the advent of roentgenographic cephalometry [3], several analyses have been put forward by various research workers. Every researcher was hoping, not only to explore and definitively describe the structure and the morphology of the craniofacial complex, but also to reach conclusions by establishing “cephalometric norms”. These average values of cephalometric variables, such as linear and angular measurements were used for orthodontic diagnosis and treatment planning.
In spite of possible ethnic differences most classical cephalometric standards are established based on sample populations of people with European-American ancestries. Therefore it is important to develop cephalometric standards for different ethnic groups [4]. Hence, the purpose of the present study is to establish soft tissue norms for the North Indian population based on the laymen perception of facial esthetics.
Aims and Objectives
The aim of this study is to:
Determine soft tissue norms for the North Indian population based on laymen perception of facial esthetics.
Compare the soft tissue norms of the North Indians with those of White Americans.
Investigate the differences between the soft tissue norms of males and females in the North Indian population.
Material and Method
Subjects
Five hundred and forty students from different colleges of North India were examined. From these students a sample of 170 individuals, 76 males and 94 females in the age group of 18–28 years was selected based on facial profile and status of occlusion. The selection criteria for the present study were to judge the individual on the basis of;
Well aligned maxillary and mandibular dental arches,
Angle’s Class I molar relationship with minimal or no crowding,
Normal overjet and overbite,
No history of previous orthodontic, prosthodontic or surgical treatment,
Esthetically pleasing appearance, and
Normal growth and development.
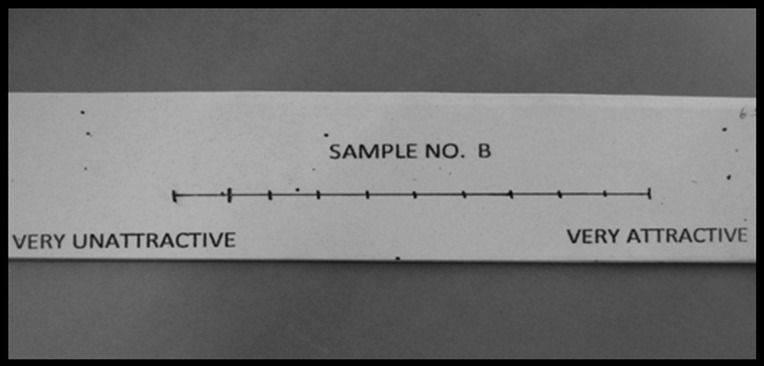
Facial frontal and profile photographs of 170 individuals were obtained in a natural head position (NHP) [5], which is defined as the physiological head position obtained by a relaxed individual when looking at a reference point ahead, herein represented by the individual’s eyes reflected in a mirror, centric relation, and relaxed lip posture [6]. A panel of judges was made which consisted of 20 laymen. This panel evaluated each of the 170 sets of photographs to select the sample, which included individuals with esthetically pleasing appearance. All the photographs were projected on a screen for 10 s. Each judge was given two booklets containing 170 pages of a 100 mm visual analogue scale (VAS) [7].VAS represents continuous scoring from 0 to 100 mm (i.e. very unattractive to very attractive) on a line on which the tens were indicated from 0 to 100 (Fig. 1).
Fig. 1.
Visual analogue scale represents continuous scoring from 0 to 100 mm
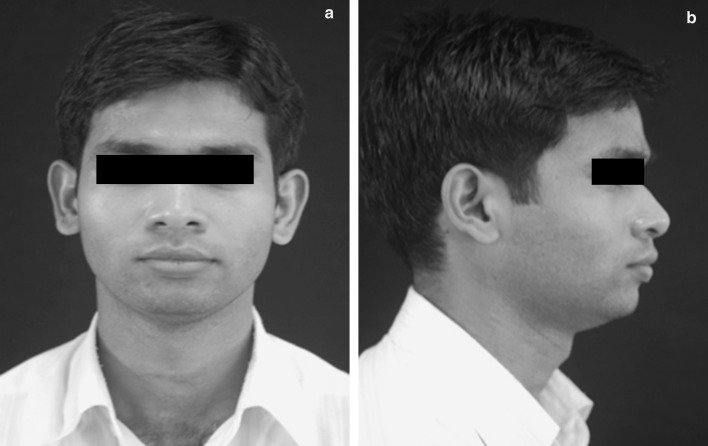
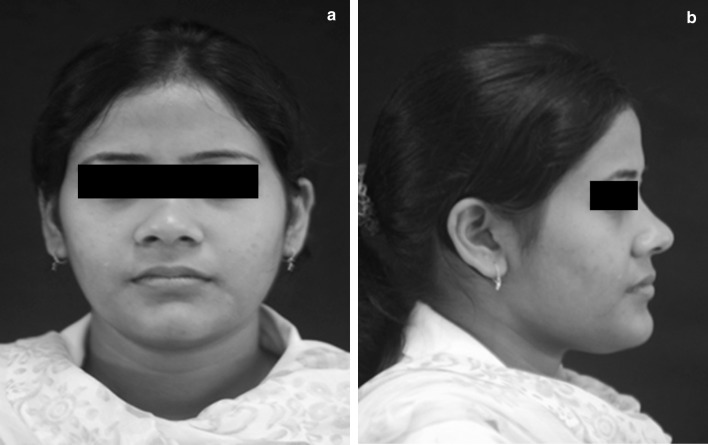
The scores for each set of photographs were recorded and tabulated. Means and standard deviations (SD) of these ratings were calculated. One male and one female photograph close to the median value were then selected to serve as reference set. Male reference set had a VAS score of 38.25 and the female set had a VAS score of 41.95 (Figs. 2, 3).
Fig. 2.
Reference set of photographs for male a frontal and b profile
Fig. 3.
Reference set of photographs for female a frontal and b profile
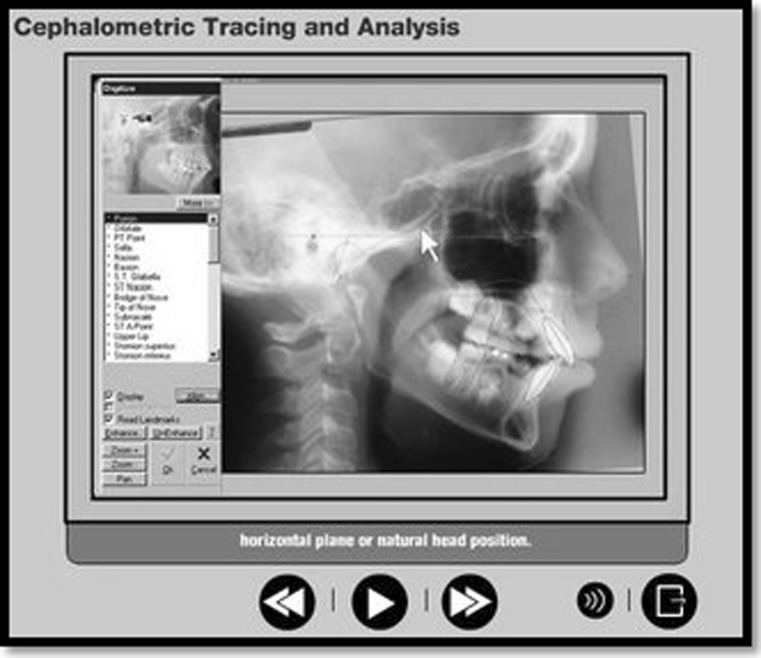
The set of same photographs was placed in a slide show and projected on a wall screen, showing every female face along with the female reference set, and every male face along with the male reference set for 15 s. The panel of lay judges was asked to rate the 170 sets of photograph again, in relation to the set of reference photographs on the VAS [7]. Means and SD of the ratings for each set of photographs were calculated and a sample of 120 subjects (60 males and 60 females) with average score close to the median value and a SD of 1.7 were then selected for the study. The lateral cephalometric radiograph of each selected subject was taken with digital cephalometer. For extraoral Radiography specifications were: ProMax X-ray unit (Planmeca, Helsinki, Finland) with Toshiba D-054SB-P X-ray tube, focal spot size 0.5 mm × 0.5 mm according to IEC 336, total filtration minimum 2.5 mm Aluminum, anode voltage 54–84 kV +5 %, anode current 1–16 mA +10 %. HCl computer with Pentium D CPU 2.66 GHz 496 MB RAM and monitor with Planmeca Dimaxis Pro 4.1.4 software. The cephalograms were imported into Dolphin software (Dolphin Imaging and management, Chatsworth, California). Landmark identification was performed directly on the monitor-displayed image with a mouse-controlled cursor connected with the computerized program for cephalometric analysis (Fig. 4).
Fig. 4.
Digitalized cephalograms were evaluated with the help of Dolphin software
After completing the digitizing of a set of landmarks, the program automatically generated the variables. The composite soft tissue cephalometric analysis consisting of 17 soft tissue variables comprising of 5 angular and 12 linear measurements taken from Subtenley’s [8], Holdaway’s [9], Ricketts [10] and Legan’s [11] analysis, was performed.
The following soft tissue angular measurements were taken:
Total soft tissue convexity It is the angle between Soft tissue nasion (N’), Tip of the nose (Nt) and Soft tissue pogonion (Pog’).
Facial convexity It is the angle formed by the line Glabella (G) to Subnasale (Sn) and the line Sn to Soft tissue pogonion (Pog’).
Facial angle The facial angle is formed by the intersection of the FH plane with a line extending from Soft tissue nasion to pogonion (N’–Pog’).
H angle It is the angle between N–Pog line and H-line joining Labrale Superius (Ls) and Soft tissue pogonion (Pog’).
Nasolabial angle It is angle between tangents to Columella (L) and Labrale Superius (Ls).
The following soft tissue linear measurements were taken:
Nasal prominence The horizontal distance between the tip of the nose (Nt) and a perpendicular line drawn to the Frankfort plane from the vermilion.
Subnasale to H line Measurement from Subnasale (Sn) to the H line (Ls–Pog’).
Superior sulcus depth The horizontal distance between the upper lip sulcus and a perpendicular line drawn from the vermilion to the Frankfort plane.
Inferior sulcus to H line The measurement at the point of greatest convexity between the vermilion border of the lower lip and the H line.
Upper lip to E line It is the linear distance from Labrale Superius (Ls) to the tangent plane joining tip of the nose (Nt) to soft tissue pogonion (Pog’).
Lower lip to E line It is linear distance from Labrale inferius (Li) to the tangent plane joining tip of the nose (Nt) to soft tissue pogonion (Pog’).
Basic upper lip thickness The dimension measured approximately 3 mm below point A (subspinale) and the drape of the upper lip.
Upper lip thickness The dimension from vermillion border of the upper lip to the most anterior portion on the central incisor.
Lower lip to H line Measurement of the lower lip to the H line.
Chin thickness The distance between the hard and soft tissue facial planes at the level of Supra pogonion.
Soft tissue facial height % The ratio of the distance between the Glabella (G) to Subnasale (Sn) and Subnasale (Sn) to soft tissue Menton (Me).
Sn Stomion/Stomion Me % The ratio of the distance between the Subnasale (Sn) to Stomion (St) and Stomion (St) to Menton (Me).
Statistical Analysis
All the statistical analyses were performed with the SPSS software package (SPSS for windows 98, version 11.5, SPSS, Chicago, III). The Mean and standard deviations for each of the soft tissue cephalometric parameters were calculated and the norms for the North Indian population (men and women) were established. The norms so established were compared with white American norms. The independent-sample t test was used to compare the measurement differences of the North Indian men and women.
Method Error
To eliminate intra examiner variability, all radiographs were digitized by one investigator. The error of the method was determined by randomly selecting 30 lateral cephalograms from the observation group. The digitization and measurements of the radiographs were repeated 3 weeks after the first measurement. A paired t test was applied to the first and second measurements. The difference between the first and the second measurements of the 30 radiographs was found to be insignificant.
Results
A composite soft tissue analysis was done to determine norms for North Indian Population and to compare the differences between North Indian males and females (Tables 1, 2).
Table 1.
Comparison between the soft tissue norms of the North Indians with those of White Americans
| Parameter (in °) | White American norms | North Indian norms | ||
|---|---|---|---|---|
| Mean | SD | Mean | SD | |
| H angle | 10 | 4 | 14.88 | 3.35 |
| Soft tissue convexity | 137 | 4 | 129.08 | 4.09 |
| Facial convexity | 12 | 4 | 12.71 | 4.98 |
| Facial angle | 91 | 7 | 89.14 | 11.29 |
| Sn stomion/stomion Me | 50 | 5 | 48.80 | 5.58 |
| Soft tissue facial height | 1 | 1 | 1.03 | 0.11 |
| Nasal prominence | 14–24 | – | 11.34 | 2.28 |
| Nasolabial angle | 102 | 8 | 103.84 | 12.63 |
| Chin thickness | 10–12 | – | 10.85 | 2.21 |
| Inferior sulcus to H line | 3 | 2 | 4.63 | 1.75 |
| Upper lip to E plane | −4 | 2 | −3.36 | 1.91 |
| Lower lip to E plane | −2 | 2 | −1.45 | 1.98 |
| Basic upper lip thickness | 16 | 3 | 14.78 | 2.33 |
| Upper lip thickness | 13 | 3 | 11.32 | 2.16 |
| Lower lip to H line | 0.5 | 2 | 0.54 | 1.43 |
| Superior sulcus depth | 3 | 1–4 | 2.64 | 0.90 |
| Subnasale to H line | 5 | 2 | 4.88 | 1.76 |
Table 2.
Comparison between the soft tissue norms of the North Indian men and women
| Parameter (in °) | Male (n = 60) | Female (n = 60) | t value | P value | S/NS | ||
|---|---|---|---|---|---|---|---|
| Mean | SD | Mean | SD | ||||
| H angle | 15.19 | 3.37 | 14.58 | 3.33 | 0.99 | 0.325 | NS |
| Soft tissue convexity | 129.12 | 3.45 | 129.05 | 4.68 | 0.09 | 0.929 | NS |
| Facial convexity | 12.56 | 4.92 | 12.86 | 5.07 | −0.33 | 0.744 | NS |
| Facial angle | 89.49 | 11.05 | 88.79 | 11.51 | 0.34 | 0.735 | NS |
| Sn stomion/stomion Me | 49.36 | 5.38 | 48.24 | 5.76 | 1.11 | 0.271 | NS |
| Soft tissue facial height | 1.03 | 0.12 | 1.04 | 0.10 | −0.50 | 0.621 | NS |
| Nasal prominence | 11.53 | 2.66 | 11.15 | 1.81 | 0.91 | 0.363 | NS |
| Naso labial angle | 102.24 | 15.82 | 105.43 | 8.15 | −1.39 | 0.168 | NS |
| Superior sulcus depth | 2.81 | 1.02 | 2.47 | 0.74 | 2.07 | 0.041 | S |
| Inferior sulcus to H line | 5.47 | 1.67 | 3.80 | 1.41 | 5.94 | 0.000 | S |
| Upper lip thickness | 12.60 | 1.84 | 10.05 | 1.66 | 7.97 | 0.000 | S |
| Lower lip to H line | 0.08 | 1.45 | 1.00 | 1.26 | −3.70 | 0.000 | S |
| Subnasale to H line | 5.22 | 2.03 | 4.53 | 1.37 | 2.19 | 0.030 | S |
| Upper lip to E plane | −3.32 | 2.12 | −3.39 | 1.69 | 0.21 | 0.834 | NS |
| Lower lip to E plane | −1.93 | 2.00 | −0.98 | 1.87 | −2.68 | 0.009 | S |
| Basic upper lip thickness | 16.08 | 2.36 | 13.48 | 1.40 | 7.34 | 0.000 | S |
| Chin thickness | 11.30 | 2.40 | 10.41 | 1.93 | 2.24 | 0.027 | S |
S Significant, NS Not significant
Discussion
The initial step of this study was to collect sets of facial photographs of males and females from 540 subjects based on facial profile and status of occlusion. The subjects in our study were young adults in the range of 18–28 years. The photographic views selected for the sets were full-face and profile views of each individual. Frontal photographs generally are rated more attractive than profile views [12], and simultaneous presentation of frontal and profile views probably would be advantageous [13].
A panel of 20 adult laymen was constructed. Lay judges were then asked to rate the photographs on VAS [7] which are most often used as a measuring instrument for dental, dentofacial, or facial aesthetics. Most authors have used a VAS without reference photographs [14], but more recently the use of reference photographs has been advocated [15, 16]. Reference photographs can help the panel members to use the scale more uniformly. Therefore, in this study only one reference set for each sex with the median score of the scale was chosen. Cephalometry is an important tool in orthodontic diagnosis, treatment planning, and evaluation of treatment results and prediction of growth.
The major sources of error in cephalometric analysis include radiographic film magnification, tracing, measuring, recording, and landmark identification [17, 18] and thus one of the efforts to improve the precision in landmark identification should be directed towards improvement in the image quality [19] Digital radiography could revolutionize both clinical and research practices in craniofacial cephalometrics as occurred with the introduction of computer programs, digitizers, and plotters in the 1970s. The potential advantages of digital technology lie in the ability to (1) manipulate the image, (2) reduce radiation dose, and (3) improve storage and access of information. Thus in this study digitalized cephalograms were evaluated with the help of Dolphin software.
The composite soft tissue analyses were formed, which included 17 variables taken from Legan and Burstone [11], Ricketts [10], Subtenley [8] and Holdaway [9]. These analyses have received extensive clinical research usage in the field of both orthodontics and orthognathic surgery. Unfortunately, their soft tissue norms are based on whites and cannot always be applied to the other racial and ethnic groups.
In the present study, it was found that the white American soft tissue norms and the North Indian adult’s values were generally similar. Only in nasal prominence, basic upper lip thickness, and ‘H’ angle measurements, significant differences were seen.
When comparison was made between the North Indian males and females, statistically significant differences were found in 8 variables i.e. subnasale to H line (P < 0.030), superior sulcus depth (P < 0.041), inferior sulcus to H line (P < 0.000), lower lip to E plane (P < 0.009), basic upper lip thickness (P < 0.000), upper lip thickness (P < 0.000), lower lip to H line (P < 0.000) and chin thickness (P < 0.02). The comparison showed that males have significantly increased lip strain, thicker upper lip, fuller upper lip, protrusive upper lip and prominent chin. The soft tissue chin thickness is important in treatment planning as if, the chin thickness is decreased, one can retract the upper and lower incisors too far back. Larger chin could be related to the less convex facial profile in the males. Females displayed protrusive lower lip and decreased soft tissue chin thickness than males.
The study comprised of the samples between 18 and 28 years old North Indians. Further studies are required on different age groups to see age related changes in soft tissue drape. Because of marked variation in the dentoskeletal framework, hard tissue variables can also be taken along with soft tissue variables in the future study.
Clinical Implications
This study was undertaken on a large number of samples to establish soft tissue norms for the North Indian population (both males and females).
A composite analysis was performed to include various soft tissue parameters from various analyses. These variables have received extensive clinical and research usage in the field of both orthodontics and orthognathic surgery.
As these norms were established by using VAS, with reference photograph and digital lateral cephalograms to reduce various sources of error in cephalometric analysis, norms thus established are recommended to be used in the diagnosis and treatment planning of the North Indian population.
Summery and Conclusion
This study was designed to determine the relevance of the various soft tissue norms in the evaluation of facial esthetics of the North Indian adults and to compare the differences between the North Indian males and females.
The results showed:
Soft tissue cephalometric norms for the North Indian adults were determined according to the laymen perception of facial esthetics. Lay judges considered Individuals with a relatively smaller nose, protrusive lips and slightly convex profile, to be more esthetic.
Generally, most measurements were similar to the white American norms. Some differences were noticed in nasal prominence, basic upper lip thickness, and ‘H’ angle measurements. These differences should be considered when formulating an orthodontic diagnosis and treatment plan for the North Indian adults.
On an average, the North Indian males have relatively prominent and thicker upper lip, and increased basic upper lip thickness than lower lip was found to be more protrusive in females than in males.
The results of this study should be an aid in designing treatment plans that are consistent with the perception of beauty, attractiveness, and facial balance for our native North Indian population.
References
- 1.Edler RJ. Background considerations to facial esthetics. J Orthod. 2001;28:159–168. doi: 10.1093/ortho/28.2.159. [DOI] [PubMed] [Google Scholar]
- 2.Naini FB, Moss JP, Gill DS. The enigma of facial beauty: esthetics, proportions deformity, and controversy. Am J Orthod Dentofacial Orthop. 2006;130:277–282. doi: 10.1016/j.ajodo.2005.09.027. [DOI] [PubMed] [Google Scholar]
- 3.Broadbent Holly B. A new X-ray technique and its application to orthodontia. Angle Orthod. 1981;2:45–66. [Google Scholar]
- 4.Hwang HS, Kim WS, McNamara JA. Ethnic differences in the soft tissue profile of Korean and European-American adults with normal occlusion and well-balanced faces. Angle Orthod. 2002;72:72–80. doi: 10.1043/0003-3219(2002)072<0072:EDITST>2.0.CO;2. [DOI] [PubMed] [Google Scholar]
- 5.Miyajima K, McNamara JA, Jr, Kimura T. Craniofacial structure of Japanese and European-American adults with normal occlusions and well-balanced faces. Am J Orthod Dentofacial Orthop. 1996;110(4):431–438. doi: 10.1016/S0889-5406(96)70047-1. [DOI] [PubMed] [Google Scholar]
- 6.Alcalde RE, Jinno T, Orsini MG, Sasaki A, Sugiyama RM, Matsumura T. Soft tissue cephalometric norms in Japanese adults. Am J Orthod Dentofacial Orthop. 2000;118:84–89. doi: 10.1067/mod.2000.104411. [DOI] [PubMed] [Google Scholar]
- 7.Kiekens RMA, Maltha JC, van’t Hof MA, Kuijpers-Jagtman AM. A measuring system for facial aesthetics in Caucasian adolescents: reproducibility and validity. Eur J Orthod. 2005;27:579–584. doi: 10.1093/ejo/cji053. [DOI] [PubMed] [Google Scholar]
- 8.Subtenley ID. A longitudinal study of soft tissue facial structures and their profile characteristics defined in relation to underlying skeletal structures. Am J Orthod Dentofacial Orthop. 1959;45:481–507. [Google Scholar]
- 9.Holdaway RA. Soft-tissue cephalometric analysis and its use in orthodontic treatment planning. Am J Orthod Dentofacial Orthop. 1983;4:1–28. doi: 10.1016/0002-9416(83)90144-6. [DOI] [PubMed] [Google Scholar]
- 10.Ricketts RM. Perspective in the clinical application in cephalometry. Angle Orthod. 1981;51:115–150. doi: 10.1043/0003-3219(1981)051<0115:PITCAO>2.0.CO;2. [DOI] [PubMed] [Google Scholar]
- 11.Legan HL, Burstone CJ. Soft tissue cephalometric analysis for orthognathic surgery. J Oral Surg. 1980;38:744. [PubMed] [Google Scholar]
- 12.Kerr WJS, O’Donnell JM. Panel perception of facial attractiveness. Br J orthod. 1990;17:299–304. doi: 10.1179/bjo.17.4.299. [DOI] [PubMed] [Google Scholar]
- 13.Phillips C, Tulloch C, Dann C. Rating of facial attractiveness. Community Dent Oral Epidemiol. 1992;20:214–220. doi: 10.1111/j.1600-0528.1992.tb01719.x. [DOI] [PubMed] [Google Scholar]
- 14.Howells DJ, Shaw WC. The validity and reliability of rating of dental and facial attractiveness for epidemiological use. Am J Orthod Dentofacial Orthop. 1985;88:402–408. doi: 10.1016/0002-9416(85)90067-3. [DOI] [PubMed] [Google Scholar]
- 15.Peeling RH, Kuijper-Jagtman AM, Hoeksma JB. A photographic scale to measure facial aesthetics. Eur J Orthod. 1995;17:101–109. doi: 10.1093/ejo/17.2.101. [DOI] [PubMed] [Google Scholar]
- 16.Faure JC, Rieffe C, Maltha JC. The influence of different facial components on facial aesthetics. Eur J Orthod. 2002;24:1–7. doi: 10.1093/ejo/24.1.1. [DOI] [PubMed] [Google Scholar]
- 17.Midtgard J, Bjork G, Linder-Aronson S. Reproducibility of cephalometric landmarks and errors of measurements of cephalometric cranial distances. Eur J Orthod. 1974;44:56–61. doi: 10.1043/0003-3219(1974)044<0056:ROCLAE>2.0.CO;2. [DOI] [PubMed] [Google Scholar]
- 18.Houston WJB, Mahler RE, McElroy D, Sherriff M. Sources of error in measurements from cephalometric radiographs. Eur J Orthod. 1986;8:149–151. doi: 10.1093/ejo/8.3.149. [DOI] [PubMed] [Google Scholar]
- 19.Eppley BL. Computerized digital enhancement in craniofacial cephalometric radiography. J Oral Maxillofac Surg. 1991;49:1038–1043. doi: 10.1016/0278-2391(91)90133-7. [DOI] [PubMed] [Google Scholar]


