

Abstract
Background
Clear-cell renal cell carcinoma (ccRCC) is one of the most common types of kidney cancer in adults; however, its causes are not completely understood. The study was designed to filter the key pathways and genes associated with the occurrence or development of ccRCC, acquaint its pathogenesis at gene and pathway level, to provide more theory evidence and targeted therapy for ccRCC.
Methods
Gene set enrichment analysis (GSEA) and meta-analysis (Meta) were used to screen the critical pathways and genes which may affect the occurrence and progression of ccRCC on the transcription level. Corresponding pathways of significant genes were obtained with the online website DAVID (http://david.abcc.ncifcrf.gov/).
Results
Thirty seven consistent pathways and key genes in these pathways related to ccRCC were obtained with combined GSEA and meta-analysis. These pathways were mainly involved in metabolism, organismal systems, cellular processes and environmental information processing.
Conclusion
The gene pathways that we identified could provide insight concerning the development of ccRCC. Further studies are needed to determine the biological function for the positive genes.
Keywords: Clear-cell renal cell carcinoma (ccRCC), Gene set enrichment analysis, Meta-analysis, Key pathways
Introduction
Renal cell carcinoma (RCC) is one of the most common genitourinary malignancies, accounting for about 3 % of all cancers worldwide [1]. Clear cell renal cell carcinoma (ccRCC) is the most common histological type of renal cell carcinoma, also called conventional RCC, which represents 75–80 % of RCC. The male/female ratio is approximately 2:1 [2]. Initial treatment is most commonly a radical or partial nephrectomy and remains the mainstay of curative treatment [3]. Where the tumor is confined to the renal parenchyma, the 5-year survival rate is 60–70 %, but this is lowered considerably where metastases have spread. It is relatively resistant to radiation therapy and chemotherapy, although some cases respond to immunotherapy.
After the completion of the Human Genome Project, advances in microarray technology led to global gene expression profiling of ccRCC [4–6]. Microarray technology profiles the expression levels of thousands of genes simultaneously, providing a snapshot of transcript levels in the cells/tissues being studied; it is a powerful tool to study ccRCC. All microarray data are available from the Gene Expression Omnibus (GEO) public database at NCBI [7]. However, the large amounts of data acquired must be reduced or ‘translated’ to a smaller set of genes representing meaningful biological differences between control and test systems and validated in an experimental or clinical setting. It is a challenge to analyze such high information from microarray datasets to identify molecular pathways and key genes deregulated in ccRCC. To resolve this conflict, Subramanian describes a method gene set enrichment analysis (GSEA) which has been recognized as a breakthrough for the gene set and functional pathways analysis [8]. GSEA is a method that allows us to search the key genes and pathways associated with the occurrence and development of disease by analyzing diverse experimental datasets. However, the difference of platforms, the sample capacity and the standardization affect the result more or less. Meta-analysis of microarray data can be a better way to solve the problem of poor reproducibility and reliability [9]. In our study, after a standardized microarray preprocessing for all the expression datasets, GSEA and a meta-analysis were used to detect the mixing pathways and key genes which can provide the theoretical basis to the further perception of the biological mechanism of ccRCC.
Materials and methods
Data collection
We used clear cell renal cell carcinoma as the keywords and set the limit of study type expression profiling by array and a species limit of humans to search GEO (http://www.ncbi.nlm.nih.gov/geo/) for the relevant gene datasets. Search results provided 2,762 identified datasets involved in ccRCC. Studies that met all of the following criteria were included: (1) the data were about genome-wide RNA expression; (2) the complete microarray raw or normalized data were effective; (3) the data provided a comparison of renal tissue between ccRCC patients and normal controls relatively; (4) datasets contained more than three samples; (5) the raw data were expressed as CEL files. Finally, there were three gene expression datasets which met the selection criteria (Table 1).
Table 1.
Characteristics of datasets selected in the studies
| GEO accession | Contributor | Years | Chip | Experimental design | Probs | Source | Disease | Normal |
|---|---|---|---|---|---|---|---|---|
| GSE781 | Lenburg ME | 2003 | HG-U133A | Paired, tissues | 22,283 | Homo sapiens | 7 | 7 |
| GSE6344 | Gumz ML | 2007 | HG-U133A | Paired, tissues | 22,283 | Homo sapiens | 10 | 10 |
| GSE36895 | Peña-Llopis S | 2012 | HG-U133_Plus_2 | Paired, tissues | 54,675 | Homo sapiens | 23 | 23 |
Paired = compare clear cell renal carcinomas to normal controls from the same patients with clear cell renal carcinoma
Gene set enrichment analysis
The category version 2.10.1 package was used to perform with GSEA. General statistical analysis and computing was processed in the R statistical programming language [10]. The Robust Multichip Averaging (RMA) [11] algorithm in the affy conductor package [12] was used for each affymetrix raw dataset to calculate background-adjusted, normalized and log2 probe set intensities. The only genes we selected should have been mapped to an explicit KEGG pathway for the purpose of analyzing the GSEA and meta-analysis further [13]. We performed pathway analysis of each dataset independently. The measure of variability was within the interquartile range (IQR) and a cut-off was set up to remove IQR values under 0.5 for all the remaining genes. If one gene was targeted for multiple probe sets, we retained the probe set with the largest variability. Genes in each pathway went through the Student’s t test, and each pathway’s p value was obtained in the permutation test with 1,000 times. The p value was not more than 0.05.
Meta-analysis
To obtain the differentially expressed genes from the remaining genes of each dataset above, meta-analysis was carried out in SAS 9.13. The following formula was applied to calculate chi-square value of each gene [14]:
(K is the number of the datasets).
To calculate p value of each gene, and retained the genes with p < 0.05. Significant genes were used to obtain the pathways of the KEGG from DAVID Bioinformatics Resources 6.7 (http://david.abcc.ncifcrf.gov/).
Results
GSEA analysis
According to the inclusion criteria, we obtained three datasets in the end. Tissues used to extract the total RNA were matched pairs from clear cell renal cell carcinoma and normal tissue adjacent to renal cell carcinoma. The fuhrman grade of ccRCC was no more than three. Due to the samples used, genomic profiling were matched pairs. It reduced the influence of multiple factors on GSEA and Meta-analysis, ensuring the reliability of the obtained conclusion.
The three inclusion datasets contained 40 ccRCC cases and 40 controls. GSEA method was used separately on each dataset to find the significantly changed genes and the significant co-pathways. After GSEA analysis, 8,506 significantly changed genes were screened out from the three gene expression microarray datasets. Overlap existed in the up-regulated and down-regulated pathways. There were fourteen mixing pathways including 206 up-regulated and 253 down-regulated pathways from three datasets. Detailed information about the analysis results is shown in Table 2.
Table 2.
Summary of each dataset used gene set enrichment analysis (GSEA)
Meta-analysis
To further identify the results above, meta-analysis was used to detect differentially expressed genes between two experimental groups. We got the p value for each gene based on unpaired t test. A total of 1,150 significant genes were detected (p < 0.05). Furthermore, the Database for Annotation, Visualization and Integrated Discovery (DAVID) (http://david.abcc.ncifcrf.gov/) was utilized for the annotation of these genes. We imported the official gene symbols of 1,150 genes into the gene functional classification tool of DAVID. In order to identify biologically relevant molecular networks of these genes, KEGG (http://www.genome.jp/kegg/), a distinct pathway analysis tools of bioinformatics endowed with comprehensive knowledgebase was used. There were 1,038 genes identified by KEGG. In total, 48 KEGG pathways were detected. More details were shown in Table 3.
Table 3.
Common significant pathways were obtained from 3 clear cell renal carcinoma tissue datasets by meta-analysis
| Pathway entry | Pathway names | p value | Number of genes expressed in the pathways | Up- or down-regulated pathways |
|---|---|---|---|---|
| map00280 | Valine, leucine and isoleucine degradation | 8.79E−14 | 33 | Up |
| map00020 | Citrate cycle (TCA cycle) | 1.55E−10 | 24 | Up |
| map00010 | Glycolysis/gluconeogenesis | 1.41E−08 | 33 | Up |
| map00640 | Propanoate metabolism | 3.35E−08 | 22 | Up |
| map00071 | Fatty acid metabolism | 2.58E−07 | 24 | Up |
| map00620 | Pyruvate metabolism | 1.34E−06 | 23 | Up |
| map00650 | Butanoate metabolism | 5.21E−06 | 20 | Up |
| map00330 | Arginine and proline metabolism | 1.16E−04 | 24 | Up |
| map00190 | Oxidative phosphorylation | 4.13E−04 | 44 | Up |
| map00260 | Glycine, serine and threonine metabolism | 4.36E−04 | 16 | Up |
| map05012 | Parkinson’s disease | 5.80E−04 | 43 | Up |
| map04514 | Cell adhesion molecules (CAMs) | 5.95E−04 | 44 | Down |
| map03320 | PPAR signaling pathway | 6.52E−04 | 27 | Up |
| map05416 | Viral myocarditis | 0.00107 | 27 | Down |
| map00380 | Tryptophan metabolism | 0.00119 | 18 | Up |
| map04142 | Lysosome | 0.00129 | 39 | Up |
| map00410 | beta-Alanine metabolism | 0.00183 | 12 | Up |
| map00100 | Steroid biosynthesis | 0.00292 | 10 | Up |
| map04610 | Complement and coagulation cascades | 0.00363 | 25 | Up |
| map00051 | Fructose and mannose metabolism | 0.00451 | 15 | Down |
| map04612 | Antigen processing and presentation | 0.00605 | 28 | Down |
| map05219 | Bladder cancer | 0.00611 | 17 | Down |
| map05212 | Pancreatic cancer | 0.00669 | 25 | Down |
| map00670 | One carbon pool by folate | 0.00782 | 9 | Up |
| map05330 | Allograft rejection | 0.00819 | 15 | Down |
| map00310 | Lysine degradation | 0.01017 | 17 | Up |
| map05110 | Vibrio cholerae infection | 0.01223 | 20 | Up |
| map00903 | Limonene and pinene degradation | 0.01281 | 8 | Up |
| map05130 | Pathogenic Escherichia coli infection | 0.01493 | 20 | Down |
| map04940 | Type I diabetes mellitus | 0.01510 | 16 | Down |
| map05010 | Alzheimer’s disease | 0.01525 | 46 | Up |
| map04540 | Gap junction | 0.01631 | 28 | Down |
| map00630 | Glyoxylate and dicarboxylate metabolism | 0.01987 | 8 | Up |
| map00072 | Synthesis and degradation of ketone bodies | 0.02115 | 6 | Down |
| map05214 | Glioma | 0.02205 | 21 | Down |
| map05222 | Small cell lung cancer | 0.02571 | 26 | Down |
| map04512 | ECM–receptor interaction | 0.02571 | 26 | Down |
| map05120 | Epithelial cell signaling in helicobacter pylori infection | 0.02621 | 22 | Up |
| map04510 | Focal adhesion | 0.03278 | 53 | Down |
| map00250 | Alanine, aspartate and glutamate metabolism | 0.03679 | 12 | Up |
| map04666 | Fc gamma R-mediated phagocytosis | 0.03719 | 28 | Down |
| map04360 | Axon guidance | 0.03811 | 36 | Down |
| map04012 | ErbB signaling pathway | 0.03873 | 26 | Up |
| map05332 | Graft-versus-host disease | 0.04031 | 14 | Down |
| map05200 | Pathways in cancer | 0.06820 | 79 | Down |
| map00270 | Cysteine and methionine metabolism | 0.06916 | 12 | Up |
| map05320 | Autoimmune thyroid disease | 0.08014 | 16 | Down |
| map05322 | Systemic lupus erythematosus | 0.09307 | 27 | Down |
The results of GSEA and meta-analysis
To search the intersection pathways, a comparative analysis was made subsequently between the significant common pathways of GSEA and meta-analysis. At last, 37 consistent pathways and significant genes (p < 0.05) in these pathways were obtained. These pathways mainly concerned metabolism, organismal systems, cellular processes, environmental information processing, and human diseases. The details are shown in Table 4.
Table 4.
Common crossing significant pathways and genes between the results of GSEA and meta-analysis
| Pathway entry | Pathway names | Classification | Up- or down-regulated | p value | Number of key genes | Included genes (p value) |
|---|---|---|---|---|---|---|
| map00020 | Citrate cycle (TCA cycle) | Metabolism; carbohydrate metabolism | up | 1.55E−10 | 24 | DLST(1.58E−05), ACO2(0.009461), SUCLG2(0.001127), ACO1(3.37E−08), SUCLG1(7.68E−13), OGDHL(7.95E−10), ACLY(6.53E−05), OGDH(0.015859), PCK2(3.66E−08), PDHB(3.11E−07), PCK1(8.90E−06), SDHB(0.000273), IDH3G(0.000767), SDHC(0.002922), SDHD(0.002733), DLD(0.001570), IDH2(4.67E−07), IDH1(4.72E−05), PDHA1(3.64E−07), SUCLA2(0.002727), MDH2(0.041430), MDH1(3.71E−05), FH(8.33E−05), PC(2.46E−08) |
| map00071 | Fatty acid metabolism | Metabolism; lipid metabolism | up | 2.58E−07 | 24 | ACAA2(0.015364), ACOX1(1.77E−07), GCDH(2.55E−07), ACADSB(1.06E−05), ACADM(0.000825), CPT2(0.012060), ACADS(0.000351), EHHADH(0.009979), ADH6(6.28E−10), ECHS1(1.41E−09), ADH1B(1.11E−05), ACAT1(3.35E−05), PECI(0.000010), ALDH3A2(0.001311), CPT1A(0.028547), CYP4A11(3.26E−05), ALDH7A1(0.000678), CYP4A22(5.91E−05), ALDH1B1(1.21E−06), ALDH2(2.04E−05), HADH(0.009979), ALDH9A1(7.68E−06), ACAA1(6.20E−09), ACSL5(0.000549) |
| map00100 | Steroid biosynthesis | Metabolism; lipid metabolism | up | 0.00292 | 10 | TM7SF2(8.34E−08), CEL(0.000000), EBP(0.000483), CYP27B1(1.05E−07), LIPA(1.42E−08), CYP51A1(0.006793), DHCR7(0.038355), HSD17B7(0.017025), SC5DL(2.60E−05), FDFT1(0.000663) |
| map00190 | O idative phosphorylation | Metabolism; energy metabolism | Up | 4.13E−04 | 44 | UQCRC1(1.72E−10), NDUFB8(0.026633), ATP5B(0.000024968), COX7B(5.76E−05), ATP5G1(0.000552), ATP6V1B2(0.020631), UQCRFS1(4.82E−08), COX5A(9.06E−06), ATP12A(0.002001), ATP6V1B1(8.54E−11), COX5B(0.005213), ATP5G3(5.48E−05), NDUFB1(1.20E−06), ATP6V0B(3.18E−07), ATP6V0C(0.001556), NDUFS7(0.005646), NDUFS8(0.000199), ATP5L(6.10E−05), NDUFS3(0.001237), ATP6V0D1(0.000687), NDUFS2(9.52E−07), NDUFS1(0.000719), TCIRG1(2.68E−06), NDUFA4(6.21E−12), NDUFA3(0.000707), NDUFA4L2(0.000000), NDUFA6(3.74E−06), COX8A(2.45E−06), ATP6V1H(2.04E−09), NDUFA10(0.002332497), LHPP(1.05E−07), ATP6V1D(2.09E−05), PPA2(0.005748), SDHB(0.000273), ATP6V1A(0.000647), ATP6V0E2(1.46E−07), UQCRH(0.008671), NDUFV1(9.75E−06), SDHC(0.002922), SDHD(0.002733), ATP5C1(2.40E−06), ATP5A1(1.85E−07), ATP6V0A4(1.33E−15), UQCRB(0.000496) |
| map00250 | Alanine, aspartate and glutamate metabolism | Metabolism; amino acid metabolism | Up | 0.03679 | 12 | GOT2(9.07E−07), GLUL(0.014290), GOT1(0.000478), ASS1(8.40E−11), ALDH5A1(9.42E−06), GLS(0.011416), ABAT(8.77E−11), ALDH4A1(3.26E−08), ASNS(0.005671), ASL(0.001059), AGXT(8.18E−05), DDO(0.002112) |
| map00260 | Glycine, serine and threonine metabolism | Metabolism; amino acid metabolism | Up | 4.36E−04 | 16 | SHMT1(0.003744), SHMT2(4.22E−08), GATM(0.001104), AMT(3.71E−07), MAOA(0.000363), GCAT(2.42E−06), AGXT(8.18E−05), PIPOX(2.83E−09), GLDC(1.54E−08), ALAS1(4.18E−06), CTH(1.48E−06), DLD(0.001570), PHGDH(1.25E−05), DAO(5.49E−10), PSAT1(0.000768), SARDH(0.000146) |
| map00270 | Cysteine and methionine metabolism | Metabolism; amino acid metabolism | Up | 0.06916 | 12 | GOT2(9.07E−07), ADI1(6.10E−05), LDHB(9.05E−10), CTH(1.48E−06), LDHA(5.38E−14), AHCY(6.74E−05), GOT1(0.000478), DNMT3L(0.000176), DNMT1(3.44E−06), AHCYL1(7.94E−05), AHCYL2(1.62E−08), MPST(0.000405) |
| map00280 | Valine, leucine and isoleucine degradation | Metabolism; amino acid metabolism | Up | 8.79E−14 | 33 | HSD17B10(1.92E−07), ACADSB(1.06E−05), EHHADH(0.009979), ECHS1(1.41E−09), ACAT1(3.35E−05), ALDH3A2(0.001311), AUH(3.90E−05), MCCC2(0.01761787), MUT(2.71E−05), IVD(1.36E−05), OXCT1(1.70E−06), MCCC1(0.000919), ACAD8(1.38E−07), HADH(3.58E−10), HMGCL(2.12E−07), ALDH6A1(1.54E−09), ACAA2(0.015364), ACADM(0.000824944), ACADS(0.000351), BCKDHB(1.18E−06), DBT(0.000280), ALDH7A1(0.000678), HMGCS2(0.025830), ALDH1B1(1.21E−06), AOX1(0.000215), DLD(0.001570), ALDH2(2.04E−05), ABAT(8.77E−11), HIBCH(3.29E−05), PCCB(4.63E−09), PCCA(1.72E−07), ALDH9A1(7.68E−06), ACAA1(6.20E−09) |
| map00310 | Lysine degradation | Metabolism; amino acid metabolism | Up | 0.01017 | 17 | DLST(1.58E−05), GCDH(2.55E−07), EHHADH(0.009979), OGDHL(7.95E−10), AASS(4.95E−05), ECHS1(1.41E−09), OGDH(0.015859), ACAT1(3.35E−05), ALDH3A2(0.001311), PIPOX(2.83E−09), ALDH7A1(0.000678), ALDH1B1(1.21E−06), PLOD2(7.01E−10), PLOD3(2.04E−06), ALDH2(2.04E−05), HADH(3.58E−10), ALDH9A1(7.68E−06) |
| map00330 | Arginine and proline metabolism | Metabolism; amino acid metabolism | Up | 1.16E−04 | 24 | SAT1(0.003288), ALDH18A1(0.000317), ASS1(8.40E−11), GATM(0.001104), MAOA(0.000363), ASL(0.001059), ALDH3A2(0.001311), CKB(0.017515), GOT2(9.07E−07), ALDH7A1(0.000678), GLUL(0.014290), GOT1(0.000478), P4HA2(0.042440), P4HA1(5.46E−10), ALDH1B1(1.21E−06), CKMT2(6.95E−06), ARG2(1.53E−07), GLS(0.011416), ALDH2(2.04E−05), PRODH2(1.88E−10), ALDH4A1(3.26E−08), DAO(5.49E−10), OAT(1.18E−06), ALDH9A1(7.68E−06) |
| map00380 | Tryptophan metabolism | Metabolism; amino acid metabolism | Up | 0.00119 | 18 | DDC(7.22E−06), GCDH(2.55E−07), KYNU(0.021680), MAOA(0.000363), EHHADH(0.009979), OGDHL(7.95E−10), ECHS1(1.41E−09), IDO1(5.75E−06), OGDH(0.015859), ACAT1(3.35E−05), ALDH3A2(0.001311), ALDH7A1(0.000678), ALDH1B1(1.21E−06), AOX1(0.000215), ALDH2(2.04E−05), CAT(0.000463), HADH(3.58E−10), ALDH9A1(7.68E−06) |
| map00410 | beta-Alanine metabolism | Metabolism; metabolism of other amino acids | Up | 0.00183 | 12 | ALDH7A1(0.000678), ACADM(0.000825), ALDH1B1(1.21E−06), UPB1(0.030295), EHHADH(0.009979), ALDH2(2.04E−05), ABAT(8.77E−11), DPYS(3.24E−05), ECHS1(1.41E−09), HIBCH(3.29E−05), ALDH3A2(0.001311), ALDH9A1(7.68E−06) |
| map00620 | Pyruvate metabolism | Metabolism; carbohydrate metabolism | Up | 1.34E−06 | 23 | LDHB(9.05E−10), LDHA(5.38E−14), ME2(0.009738), ACACB(0.015700), GRHPR(0.000187), PCK2(3.66E−08), ACAT1(3.35E−05), ALDH3A2(0.001311), PDHB(3.11E−07), PCK1(8.90E−06), HAGH(1.21E−06), ALDH7A1(0.000678), ALDH1B1(1.21E−06), PKM2(1.23E−05), PKLR(0.000109), AKR1B1(0.023956), DLD(0.001570), ALDH2(2.04E−05), PDHA1(3.64E−07), ALDH9A1(7.68E−06), MDH2(0.041430), MDH1(3.71E−05), PC(4.74E−08) |
| map00630 | Glyo ylate and dicarbo ylate metabolism | Metabolism; carbohydrate metabolism | Up | 0.01987 | 8 | MTHFD1(0.007709), MTHFD2(0.001166), ACO2(0.009461), ACO1(3.37E−08), HAO2(1.30E−07), GRHPR(0.000187), MDH2(0.041430), MDH1(3.71E−05) |
| map00640 | Propanoate metabolism | Metabolism; carbohydrate metabolism | Up | 3.35E−08 | 22 | ALDH6A1(1.54E−09), LDHB(9.05E−10), LDHA(5.38E−14), ACADM(0.000825), SUCLG2(0.001127), SUCLG1(7.68E−13), EHHADH(0.009979), ECHS1(1.41E−09), ACACB(0.015700), ACAT1(3.35E−05), ACSS3(0.016867), ALDH3A2(0.001311), ALDH7A1(0.000678), MUT(2.71E−05), ALDH1B1(1.21E−06), ALDH2(2.04E−05), ABAT(8.77E−11), HIBCH(3.29E−05), SUCLA2(0.002727), PCCB(4.63E−09), PCCA(1.72E−07), ALDH9A1(7.68E−06) |
| map00650 | Butanoate metabolism | Metabolism; carbohydrate metabolism | Up | 5.21E−06 | 20 | ACADS(0.000351), ALDH5A1(9.42E−06), EHHADH(0.009979), ECHS1(1.41E−09), ACAT1(3.35E−05), ALDH3A2(0.001311), PDHB(3.11E−07), ACSM3(0.000166), ALDH7A1(0.000678), HMGCS2(0.025830), ALDH1B1(1.21E−06), OXCT1(1.70E−06), ALDH2(2.04E−05), ABAT(8.77E−11), BDH2(2.94E−05), PDHA1(3.64E−07), HADH(3.58E−10), BDH1(1.61E−05), ALDH9A1(7.68E−06), HMGCL(2.12E−07) |
| map00670 | One carbon pool by folate | Metabolism; metabolism of cofactors and vitamins | Up | 0.00782 | 9 | MTHFD1(0.007709), TYMS(1.33E−06), MTHFS(5.33E−05), MTHFD2(0.001166), SHMT1(0.003744), SHMT2(4.22E−08), ALDH1L1(9.60E−05), AMT(3.71E−07), FTCD(9.75E−08) |
| map03320 | PPAR signaling pathway | Organismal systems; endocrine system | Up | 6.52E−04 | 27 | ACOX2(9.21E−10), ACOX1(1.77E−07), CPT2(0.012060), EHHADH(0.009979), AQP7(7.03E−08), CYP4A22(5.91E−05), SORBS1(0.005358), APOC3(0.000893), ANGPTL4(6.66E−15), ACSL5(0.000549), ACADM(0.000825), SCD(2.00E−07), PCK2(3.66E−08), DBI(0.000967), CPT1A(0.028547), PCK1(8.90E−06), CYP4A11(3.26E−05), CD36(5.44E−06), HMGCS2(0.025830), FABP3(0.000589), FABP1(7.22E−12), GK(3.94E−07), FABP7(2.69E−05), SLC27A2(0.000151), FABP5(4.10E−10), FABP6(3.08E−06), ACAA1(6.20E−09) |
| map04510 | Focal adhesion | Cellular processes; cell communication | Down | 0.032781 | 53 | PGF(0.000247), PDGFA(0.019680), TLN2(2.47E−07), PTEN(0.003678), PAK2(0.000209), PAK4(0.002613), SHC1(0.000611), PDGFD(0.000349), PRKCA(2.22E−05), EGFR(1.41E−07), ACTN1(0.000296), FLNA(0.035792), PRKCB(0.021118), VEGFB(0.020498), VEGFC(0.026817), MAPK1(2.74E−05), CCND1(5.27E−09), CRKL(0.007581), CCND3(0.000176), CCND2(0.000658), JUN(0.013527), VEGFA(1.13E−09), COL1A2(0.000143), PDGFRA(3.14E−06), LAMC1(1.19E−05), COL1A1(0.003965), CAV2(3.20E−12), CAV1(2.03E−12), ERBB2(3.60E−05), COL3A1(0.017713), ITGB1(4.97E−06), RAC2(1.03E−05), BCL2(0.040852), COL6A2(0.000499), PIK3R3(0.002499), LAMB1(0.004054), EGF(4.00E−10), FN1(3.26E−07), COL4A4(2.16E−08), COL4A2(0.000133), FLT1(3.53E−06), VAV3(0.002113), COL4A1(4.37E−07), MET(6.32E−06), MAPK10(2.71E−07), BIRC3(3.98E−07), COL5A2(0.000159), COL4A6(7.63E−11), KDR(0.001381), LAMA2(0.000494), VWF(9.83E−10), LAMA4(6.92E−08), ITGA5(9.13E−07) |
| map04512 | ECM–receptor interaction | Environmental information processing; signaling molecules and interaction | Down | 0.02571 | 26 | COL3A1(0.017712), DAG1(0.000975), SDC4(0.006038), ITGB1(4.97E−06), SDC3(0.001060), CD47(0.000105), CD44(0.000548), COL6A2(0.000499), AGRN(0.040523), LAMB1(0.004054), FN1(3.26E−07), COL4A4(2.16E−08), COL4A2(0.000133), COL4A1(4.37E−07), HSPG2(0.001932), COL5A2(0.000159), COL4A6(7.63E−11), LAMA2(0.000494), VWF(9.83E−10), SDC1(0.040455), LAMA4(6.92E−08), CD36(5.44E−06), ITGA5(9.13E−07), COL1A2(0.000143), COL1A1(0.003965), LAMC1(1.19E−05) |
| map04514 | Cell adhesion molecules (CAMs) | Environmental information processing; signaling molecules and interaction | Down | 5.95E−04 | 44 | HLA-DQB1(0.000000), CLDN16(1.72E−08), CLDN8(0.000000), MPZL1(0.000543), CLDN10(2.25E−05), ITGB2(7.34E−10), L1CAM(1.08E−05), HLA-DMB(1.83E−06), SDC4(0.006038), ITGB1(4.97E−06), CDH4(0.032744), HLA-DMA(1.04E−07), CDH5(0.000118), ITGAM(9.55E−07), SDC3(0.001060), VCAM1(0.001385), HLA-DRB4(0.000000), CD2(0.000423), CD4(0.000493), HLA-DPB1(3.92E−08), SELPLG(3.67E−06), SPN(0.039304), ICAM1(0.000321), PTPRC(1.12E−05), PTPRM(0.003162), ICAM2(0.021949), NLGN1(0.000208), NFASC(1.88E−06), CD99(2.14E−07), HLA-C(3.59E−06), HLA-B(8.79E−07), CD40(2.68E−07), HLA-E(3.29E−06), HLA-G(7.03E−06), HLA-F(5.75E−07), SIGLEC1(0.002946), SDC1(0.040455), CD86(1.91E−07), CD34(0.005288), PECAM1(6.83E−07), CD58(0.013779), HLA-DPA1(3.32E−07), VCAN(7.27E−05), JAM3(0.039287), HLA-DRA(8.95E−06) |
| map04610 | Complement and coagulation cascades | Organismal systems; immune system | Up | 0.00363 | 25 | C7(3.66E−07), C3AR1(6.36E−08), A2M(0.015678), C3(9.80E−07), C5(6.29E−10), C1S(0.032201), BDKRB2(0.002440), KLKB1(0.020648), SERPINA5(3.33E−16), SERPINE1(0.002613), CFI(0.024368), CFD(8.97E−06), KNG1(0.000000), PLAT(0.000362), F11(2.44E−09), CR2(4.58E−05), F8(0.006901), SERPING1(0.032058), PLG(1.90E−09), PROC(9.00E−07), C1QA(4.11E−08), VWF(9.83E−10), C1QB(1.61E−09), PROS1(0.024909), F2R(0.034193) |
| map04612 | Antigen processing and presentation | Organismal systems; immune system | Down | 0.00605 | 28 | HLA-DQB1(0.000000), PDIA3(0.039365), LGMN(0.002506), IFI30(0.006301), HLA-DMB(1.83E−06), HLA-DMA(1.04E−07), CANX(0.000217), CD74(0.000111), B2M(0.008700), TAPBP(6.91E−08), HSPA2(3.45E−06), TAP2(0.002398), TAP1(2.37E−08), HLA-DRB4(0.000000), HSPA6(1.12E−05), HSPA4(0.000390), CD4(0.000493), HLA-DPB1(3.92E−08), HSP90AA1(0.00004952), CREB1(0.039261), HLA-C(3.59E−06), CTSS(2.98E−06), HLA-B(8.79E−07), HLA-E(3.29E−06), HLA-G(7.03E−06), HLA-F(5.75E−07), HLA-DPA1(3.32E−07), CTSB(0.015631), HLA-DRA(8.95E−06) |
| map04666 | Fc gamma R-mediated phagocytosis | Organismal systems; immune system | Down | 0.03719 | 28 | WASF3(0.000154), MARCKSL1(0.009354), WASF2(1.25E−05), ASAP2(0.017588), PIP5K1B(6.36E−05), ASAP1(1.36E−06), ASAP3(0.000381), ARPC5(2.53E−06), DOCK2(2.13E−06), RAC2(1.03E−05), GSN(0.000397), INPP5D(1.39E−05), PPAP2A(0.005090), PIK3R3(0.002499), PRKCA(2.22E−05), PTPRC(1.12E−05), VAV3(0.002113), SPHK2(4.65E−09), LYN(3.36E−05), HCK(4.00E−08), PRKCB(0.021118), MAPK1(2.74E−05), ARPC1B(1.77E−05), CRKL(0.007581), FCGR2B(0.007829), FCGR2C(5.76E−05), PLCG2(6.23E−08), MARCKS(4.86E−07), FCGR2A(2.11E−07) |
| map04940 | Type I diabetes mellitus | Human diseases; endocrine and metabolic diseases | Down | 0.01511 | 16 | HLA-DQB1(0.000000), PRF1(9.91E−05), HLA-C(3.59E−06), HLA-B(8.79E−07), HLA-DMB(1.83E−06), HLA-E(3.29E−06), HLA-DMA(1.04E−07), HLA-G(7.03E−06), HLA-F(5.75E−07), CD86(1.91E−07), CPE(0.000140), HLA-DRB4(0.000000), HLA-DPA1(3.32E−07), HLA-DPB1(3.92E−08), HSPD1(0.002241), FAS(0.000865), HLA-DRA(8.95E−06) |
| map05010 | Alzheimer’s disease | Human diseases; neurodegenerative diseases | Up | 0.01525 | 46 | HSD17B10(1.92E−07), UQCRC1(1.72E−10), NDUFB8(0.026633), ATP5B(0.000025), COX7B(5.76E−05), SNCA(8.65E−05), MME(5.58E−07), ATP5G1(0.000552), UQCRFS1(4.82E−08), COX5A(9.06E−06), COX5B(0.005213), ATP5G3(5.48E−05), NDUFB1(1.20E−06), NDUFS7(0.005646), TNFRSF1A(0.018183), CASP3(0.001836), APOE(0.002175), CALML3(6.10E−05), NDUFS8(0.000199), FAS(0.000865), CHP(1.02E−05), NDUFS3(0.001237), PLCB1(0.000313), GAPDH(1.55E−06), NDUFS2(9.52E−07), NDUFS1(0.000719), NDUFA4(6.21E−12), NDUFA3(0.000707), ADAM10(0.001821), NDUFA4L2(0.000000), NDUFA6(3.74E−06), COX8A(2.45E−06), CYCS(0.000302), NDUFA10(0.002332), ITPR3(0.001233), ITPR2(4.78E−09), MAPK1(2.74E−05), SDHB(0.000273), ATP2A2(0.003118), UQCRH(0.008671), NDUFV1(9.75E−06), SDHC(0.002922), SDHD(0.002733), ATP5C1(2.40E−06), ATP5A1(1.85E−07), UQCRB(0.000496) |
| map05012 | Parkinson’s disease | Human diseases; neurodegenerative diseases | Up | 5.80E−04 | 43 | UQCRC1(1.72E−10), NDUFB8(0.026633), ATP5B(0.000025), SLC6A3(3.26E−05), SNCA(8.65E−05), UCHL1(0.000664), COX7B(5.76E−05), PINK1(0.009949), ATP5G1(0.000552), UQCRFS1(4.82E−08), COX5A(9.06E−06), COX5B(0.005213), ATP5G3(5.48E−05), NDUFB1(1.20E−06), NDUFS7(0.005646), CASP3(0.001836), HTRA2(0.016642), NDUFS8(0.000199), NDUFS3(0.001237), NDUFS2(9.52E−07), NDUFS1(0.000719), NDUFA4(6.21E−12), NDUFA3(0.000707), SLC25A4(0.001148), SLC25A5(5.04E−09), NDUFA4L2(0.000000), NDUFA6(3.74E−06), COX8A(2.45E−06), CYCS(0.000302), UBE2J1(0.002195), UBE2L6(1.49E−07), NDUFA10(0.002332), SDHB(0.000273), UBA1(0.018511), UQCRH(0.008671), SDHC(0.002922), NDUFV1(9.75E−06), PPID(0.016505), SDHD(0.002733), ATP5C1(2.40E−06), ATP5A1(1.85E−07), UBB(1.00E−04), UQCRB(0.000496) |
| map05110 | Vibrio cholerae infection | Human diseases; infectious diseases | Up | 0.01223 | 20 | PRKCA(2.22E−05), TCIRG1(2.68E−06), ADCY3(2.20E−06), KDELR2(0.002836), ATP6V1H(2.04E−09), PDIA4(0.013818), ATP6V1B2(0.020631), ATP6V1B1(8.54E−11), ATP6V1D(2.09E−05), ATP6V0B(3.18E−07), PRKCB(0.021118), ATP6V0C(0.001556), ATP6V1A(0.000647), ATP6V0E2(1.46E−07), PLCG2(6.23E−08), ERO1L(5.50E−06), ATP6V0D1(0.000687), ATP6V0A4(1.33E−15), KCNQ1(2.22E−06), SEC61G(3.22E−11) |
| map05120 | Epithelial cell signaling in Helicobacter pylori infection | Human diseases; infectious diseases | Up | 0.02621 | 22 | EGFR(1.41E−07), TCIRG1(2.68E−06), ADAM10(0.001821), LYN(3.36E−05), MET(6.32E−06), ATP6V1H(2.04E−09), ATP6V1B2(0.020631), MAPK10(2.71E−07), ATP6V1B1(8.54E−11), CCL5(0.000176), ATP6V1D(2.09E−05), ATP6V0B(3.18E−07), ATP6V0C(0.001556), ATP6V1A(0.000647), CASP3(0.001836), ATP6V0E2(1.46E−07), JUN(0.013527), PLCG2(6.23E−08), ATP6V0A4(1.33E−15), ATP6V0D1(0.000687), JAM3(0.039287), CHUK(0.001478) |
| map05212 | Pancreatic cancer | Human diseases; cancers | Down | 0.00669 | 25 | PGF(0.000247), ERBB2(3.60E−05), TGFB1(1.25E−05), ACVR1B(0.020268), CDKN2A(6.57E−07), RAC2(1.03E−05), RALB(0.003717), TGFA(4.14E−06), EGF(4.00E−10), PIK3R3(0.002499), CHUK(0.001478), EGFR(1.41E−07), RALBP1(0.017196), ARHGEF6(1.56E−07), TP53(0.015394), MAPK10(2.71E−07), RB1(1.23E−05), STAT1(0.008747), RALGDS(0.001720), VEGFB(0.020498), VEGFC(0.026817), MAPK1(2.74E−05), CCND1(5.27E−09), VEGFA(1.13E−09), JAK1(0.003297) |
| map05219 | Bladder cancer | Human diseases; cancers | Down | 0.00612 | 17 | EGFR(1.41E−07), FGFR3(0.004060), PGF(0.000247), ERBB2(3.60E−05), MMP9(0.013659), TP53(0.015394), RB1(1.23E−05), VEGFB(0.020498), VEGFC(0.026817), MAPK1(2.74E−05), TYMP(9.37E−07), CCND1(5.27E−09), CDKN1A(0.004616), CDKN2A(6.57E−07), VEGFA(1.13E−09), EGF(4.00E−10), MYC(9.64E−06) |
| map05222 | Small cell lung cancer | Human diseases; cancers | Down | 0.02571 | 26 | CKS1B(5.60E−06), FHIT(3.52E−07), PTEN(0.003678), ITGB1(4.97E−06), BCL2(0.040852), PIK3R3(0.002499), LAMB1(0.004054), MYC(9.64E−06), TRAF5(0.010154), CHUK(0.001478), FN1(3.26E−07), COL4A4(2.16E−08), COL4A2(0.000133), COL4A1(4.37E−07), CYCS(0.000302), TP53(0.015394), SKP2(0.001476), RB1(0.041380), BIRC3(3.98E−07), COL4A6(7.63E−11), LAMA2(0.000494), LAMA4(6.92E−08), CCND1(5.27E−09), CDKN1B(8.75E−05), PIAS1(0.019851), LAMC1(1.19E−05) |
| map05320 | Autoimmune thyroid disease | Human diseases; immune diseases | Down | 0.08014 | 16 | HLA-DQB1(0.000000), TG(0.001762), PRF1(9.91E−05), HLA-C(3.59E−06), CD40(2.68E−07), HLA-B(8.79E−07), HLA-DMB(1.83E−06), HLA-E(3.29E−06), HLA-DMA(1.04E−07), HLA-G(7.03E−06), HLA-F(5.75E−07), CD86(1.91E−07), HLA-DRB4(0.000000), HLA-DPA1(3.32E−07), HLA-DPB1(3.92E−08), FAS(0.000865), HLA-DRA(8.95E−06) |
| map05322 | Systemic lupus erythematosus | Human diseases; immune diseases | Down | 0.09307 | 27 | HLA-DQB1(0.000000), C7(3.80E−07), C3(9.80E−07), C5(6.29E−10), SNRPD1(0.000590), C1S(0.032201), HLA-DMB(1.83E−06), HLA-DMA(1.04E−07), HIST1H2BK(1.05E−05), HLA-DRB4(0.000000), H2AFZ(0.001992), H2AFY(0.011433), HIST1H4C(0.025179), HLA-DPB1(3.92E−08), FCGR3B(8.53E−06), HIST1H2BE(0.009017), ACTN1(0.000296), CD40(2.68E−07), TRIM21(0.000120), C1QA(4.11E−08), C1QB(1.61E−09), CD86(1.91E−07), FCGR2B(0.007829), FCGR2C(5.76E−05), H2AFY2(0.000330), HLA-DPA1(3.32E−07), FCGR2A(2.11E−07), HLA-DRA(8.95E−06) |
| map05330 | Allograft rejection | Human diseases; immune diseases | Down | 0.00818 | 15 | HLA-DQB1(0.000000), PRF1(9.91E−05), HLA-C(3.59E−06), CD40(2.68E−07), HLA-B(8.79E−07), HLA-DMB(1.83E−06), HLA-E(3.29E−06), HLA-DMA(1.04E−07), HLA-G(7.03E−06), HLA-F(5.75E−07), CD86(1.91E−07), HLA-DRB4(0.000000), HLA-DPA1(3.32E−07), HLA-DPB1(3.92E−08), FAS(0.000865), HLA-DRA(8.95E−06) |
| map05332 | Graft-versus-host disease | Human diseases; immune diseases | Down | 0.04031 | 14 | HLA-DQB1(0.000000), PRF1(9.91E−05), HLA-C(3.59E−06), HLA-B(8.79E−07), HLA-DMB(1.83E−06), HLA-E(3.29E−06), HLA-DMA(1.04E−07), HLA-G(7.03E−06), HLA-F(5.75E−07), CD86(1.91E−07), HLA-DRB4(0.000000), HLA-DPA1(3.32E−07), FAS(0.000865), HLA-DPB1(3.92E−08), HLA-DRA(8.95E−06) |
| map05416 | Viral myocarditis | Human diseases; cardiovascular diseases | Down | 0.00107 | 27 | HLA-DQB1(0.000000), PRF1(9.91E−05), CAV1(2.03E−12), DAG1(0.000975), ITGB2(7.34E−10), HLA-DMB(1.83E−06), HLA-DMA(1.04E−07), CASP3(0.001836), RAC2(1.03E−05), HLA-DRB4(0.000000), HLA-DPB1(3.92E−08), ICAM1(0.000321), CYCS(0.000302), HLA-C(3.59E−06), CD40(2.68E−07), HLA-B(8.79E−07), MYH9(0.011717), HLA-E(3.29E−06), MYH8(0.014687), HLA-G(7.03E−06), HLA-F(5.75E−07), LAMA2(0.000494), CD86(1.91E−07), CCND1(5.27E−09), HLA-DPA1(3.32E−07), MYH14(0.000268), HLA-DRA(8.95E−06), MYH10(0.002797) |
Discussion
Clear cell renal cell carcinoma is one of the most common types of kidney cancer in adult; however, its causes are not completely understood. The selection of differentially expressed genes and consistent pathways helps us to explore their underlying molecular mechanisms, thereby providing insights into biological function. Single gene-marker-based approaches can fail to detect transcriptional programs that are distributed across an entire network of genes are yet subtle at the level of individual gene [15]. Genome-wide microarrays can locate gene families and pathways which show a consistent alteration in a disease state. Pathway analysis is a valid method to reduce a major deviation and can obtain interesting common genes and pathways by mixing differently expressed genes from different datasets.
Some studies have been published. The study of Tun et al. [16] used gene expression profiling of early-stage ccRCC combined with a comprehensive bioinformatics analyses to reveal the significant pathway and transcription factors which take effect in the development of ccRCC. Meanwhile, Maruschke et al. [17] used microarray expression analysis to determine 16 gene sets that distinguish expression profiles from grade 1 and grade 3 tumor tissues based on MSigDB data bank analysis. The two studies above were single dataset analysis. However, multi-microarray dataset analysis for the development of ccRCC was rare. This study uses three datasets based on a novel GSEA carried out by KEGG dataset and meta-analysis approach to identify the common significant genes and genetic pathways with p < 0.05 associated ccRCC. And our findings suggest that most genes and pathways involved in ccRCC are the same according to their functional classification. In this study, we discussed several differentially expressed pathways and genes among crossing pathways which suggest the role of these pathways and genes in ccRCC based on their functional classification.
Metabolism pathways
The metabolism pathways in our study were predominantly focused on carbohydrate metabolism, lipid metabolism, energy metabolism, amino acid metabolism, metabolism of other amino acids, metabolism of cofactors and vitamins. ccRCC is increasingly being recognized as a metabolic disease. Numerous studies have shown a significant association between body mass index, obesity and the development of kidney cancer [18]. In a case–control study from Iowa, diets richest in animal and saturated fats, oleic acid and cholesterol were associated with statistically significant increases in RCC (1.9–2.6-fold, depending on the factor) [19]. These metabolic abnormalities provide protection for the tumor but also may provide a source of vulnerability and therapeutic opportunity. Citrate cycle (TCA cycle) discovered in this study belongs to Carbohydrate metabolism; it is part of a metabolic pathway coupled to mitochondrial oxidative phosphorylation that converts nutrients to energy in aerobic cells. Recently, heterozygous germline mutations in fumarate hydratase (FH) or succinate dehydrogenase (SDH) of the TCA cycle have been shown to predispose individuals to tumors [20]. SDHB/C/D is the key gene in the Citrate cycle and oxidative phosphorylation pathway in our article. SDH is one of the seven known kidney cancer genes involved in pathways that respond to metabolic stress and/or nutrient stimulation [21]. Targeting the fundamental metabolic abnormalities in kidney cancer provides a unique opportunity for the development of more effective forms of therapy for this disease. Recently, early-onset renal tumors have been found to develop in individuals with germ line SDHB mutations [22, 23]. In preclinical models, increased succinate has been shown to inhibit HIF prolyl hydroxylase and affect HIF stability [24]. HIF can strengthen the expression of vascular endothelial growth factor (VEGF), glucose transcript factor 1 (GLUT-1) and glycolytic enzyme in the downstream target genes; promote the generation of blood vessels and energy metabolism of cells; and possibly play an important role in the developing progress in the excessive expression of malignant tumor [25, 26].
Cellular processes and cell communication
Focal adhesion pathway (Fig. 1) in our result belongs to cellular processes and cell communication. In cell biology, focal adhesions (cell–matrix adhesions or FAs) are specific types of large macromolecular assemblies through which both mechanical force and regulatory signals are transmitted. Cell–matrix adhesions play essential roles in important biological processes including cell motility, cell proliferation, cell differentiation, regulation of gene expression and cell survival [27]. Tumor epithelial and endothelial cells require attachment to the extracellular matrix (ECM) for survival; on loss of adhesion, they undergo anoikis [28, 29]. Quinazoline-based drugs trigger anoikis in renal cancer cells by targeting the focal adhesion survival signaling. This potent antitumor action against human RCC suggests a novel quinazoline-based therapy targeting renal cancer [30]. VEGFA/B/C (marked by red stars in Fig. 1) is significant gene in focal adhesion pathway. The role of VEGF in particular has been explored as a key factor in the pathogenesis of RCC. VEGF functions to increase vascular permeability, induce endothelial cell proliferation and migration, and promote endothelial cell survival [31]. Furthermore, VEGF receptor expression has been observed in RCC cells, suggesting that VEGF may also serve as an autocrine stimulus in RCC [32]. The high VEGF expression in RCC is the direct result of inactivation of the Von Hippel–Lindau tumor suppressor gene (VHL). Data suggest that VHL inactivation occurs in the majority of ccRCC [33]. Therapeutic targeting of VEGF in RCC has strong biologic rationale. Substantial clinical activity has been reported in clinical trials with VEGF-targeting agents [34, 35]. Further investigation is needed to optimally use these agents for maximal clinical benefit.
Fig. 1.
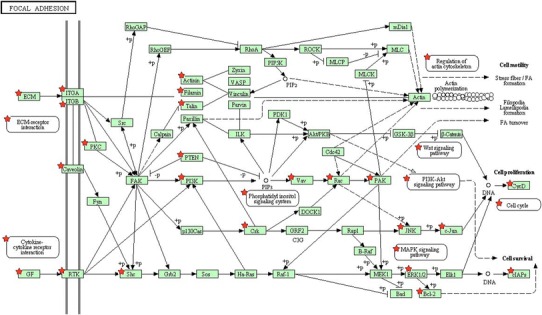
Focal adhesion pathway (the chart is from the KEGG database, ★p < 0.05, genes symbolized by ★ and correlation p values can be found in map04510 of Table 4)
Environmental information processing
Extracellular matrix–receptor interaction and cell adhesion molecule (CAM) pathways were in this classification. They are all about signaling molecules and interaction. The extracellular matrix (ECM) consists of a complex mixture of structural and functional macromolecules and serves an important role in tissue and organ morphogenesis and in the maintenance of cell and tissue structure and function [36]. There is close connection between ECM–receptor interaction and focal adhesion pathway, which is also a significant pathway. At the cell–extracellular matrix contact points, specialized structures are formed and termed focal adhesions, where bundles of actin filaments are anchored to transmembrane receptors of the integrin family through a multi-molecular complex of junctional plaque proteins [37]. There is increasing evidence that certain integrins associate with receptor tyrosine kinases (RTKs) to activate signaling pathways that are necessary for tumor invasion and metastasis [38]. Zhou et al. [39] found that multiple canonical cancer-associated signaling pathways including focal adhesion, cell cycle and ECM–receptor interaction were significantly more likely to be disrupted in ccRCC than expected by chance. This is consistent with the results of our study.
CD47 is a key gene in ECM–receptor interaction pathway, which is involved in the increase in intracellular calcium concentration that occurs upon cell adhesion to extracellular matrix. As has been found by other investigators, CD47 over expression may be associated with ferric nitrilotriacetate-induced renal cortical tubular damage and regeneration that lead to a polycystic state, and with tumor progression and metastasis of the induced RCCs [40].
Other pathways and genes
Human diseases and organismal systems are the two remaining classifications associated with ccRCC. Pathways such as type I diabetes mellitus, epithelial cell signaling in helicobacter pylori infection, bladder cancer, systemic lupus erythematosus and so on all belonged to the classification of human diseases. They are mainly about endocrine and metabolic diseases, neurodegenerative diseases, infectious diseases, cancers, immune diseases and cardiovascular diseases. Some diseases above belong to endocrine or immune system organic system in the classification of organismal systems. Most of genes in these pathways can be enriched in the above pathways. HLA-DQB1 appears in 8 pathways in human diseases, organismal systems and environmental information processing classification is an important gene for ccRCC, and this has widely been reported in the literature. Patients with RCC whose tumors did not express HLA-DQA1 or HLA-DQB1 molecules demonstrated poor clinical response [41]. EGFR and VEGFA/B/C expression in human disease pathways play an important regulatory role in tumor angiogenesis, invasion and metastasis. Based on the EGFR/VEGF target in the treatment of cancer is the hot spot in drug research [42].
Conclusion
The pathogenesis of ccRCC is quite complicated. It is effective to identify differentially expressed genes and deduce their underlying molecular pathways based on gene set enrichment analysis and meta-analysis. The significant genes and pathways were mainly focused on metabolism, cellular processes and cell communication, environmental information processing, human diseases and organismal systems. They may have some connections with ccRCC. Furthermore, we verified some of the results by searching the literature in the discussion section. The conclusion is relatively reliable and can be used to guide further study. Further experiments are needed to verify specific links between these results and ccRCC.
Conflict of interest
The authors declare that they have no conflicts of interests.
Footnotes
Haipeng Huang, Yanyan Tang and Wenwu He have contributed equally to this work.
References
- 1.Jemal A, Siegel R, Ward E, Murray T, Xu J, Thun MJ. Cancer statistics, 2007. CA Cancer J Clin. 2009;57:43–66. doi: 10.3322/canjclin.57.1.43. [DOI] [PubMed] [Google Scholar]
- 2.Cohen HT, McGovern FJ. Renal-cell carcinoma. N Engl J Med. 2005;353:2477–2490. doi: 10.1056/NEJMra043172. [DOI] [PubMed] [Google Scholar]
- 3.Rini BI, Rathmell WK, Godley P. Renal cell carcinoma. Curr Opin Oncol. 2008;20:300–306. doi: 10.1097/CCO.0b013e3282f9782b. [DOI] [PubMed] [Google Scholar]
- 4.Lenburg ME, Liou LS, Gerry NP, Frampton GM, Cohen HT, Christman MF. Previously unidentified changes in renal cell carcinoma gene expression identified by parametric analysis of microarray data. BMC Cancer. 2003;3:31. doi: 10.1186/1471-2407-3-31. [DOI] [PMC free article] [PubMed] [Google Scholar]
- 5.Gumz ML, Zou H, Kreinest PA, Childs AC, Belmonte LS, LeGrand SN, Wu KJ, Luxon BA, Sinha M, Parker AS, Sun LZ, Ahlquist DA, Wood CG, Copland JA. Secreted frizzled-related protein 1 loss contributes to tumor phenotype of clear cell renal cell carcinoma. Clin Cancer Res. 2007;13:4740–4749. doi: 10.1158/1078-0432.CCR-07-0143. [DOI] [PubMed] [Google Scholar]
- 6.Pena-Llopis S, Vega-Rubin-de-Celis S, Liao A, Leng N, Pavia-Jimenez A, Wang S, Yamasaki T, Zhrebker L, Sivanand S, Spence P, Kinch L, Hambuch T, Jain S, Lotan Y, Margulis V, Sagalowsky AI, Summerour PB, Kabbani W, Wong SW, Grishin N, Laurent M, Xie XJ, Haudenschild CD, Ross MT, Bentley DR, Kapur P, Brugarolas J. BAP1 loss defines a new class of renal cell carcinoma. Nat Genet. 2012;44:751–759. doi: 10.1038/ng.2323. [DOI] [PMC free article] [PubMed] [Google Scholar]
- 7.Barrett T, Troup DB, Wilhite SE, Ledoux P, Rudnev D, Evangelista C, Kim IF, Soboleva A, Tomashevsky M, Edgar R. NCBI GEO: mining tens of millions of expression profiles—database and tools update. Nucleic Acids Res. 2007;35:D760–D765. doi: 10.1093/nar/gkl887. [DOI] [PMC free article] [PubMed] [Google Scholar]
- 8.Subramanian A, Tamayo P, Mootha VK, Mukherjee S, Ebert BL, Gillette MA, Paulovich A, Pomeroy SL, Golub TR, Lander ES. Gene set enrichment analysis: a knowledge-based approach for interpreting genome-wide expression profiles. Proc Natl Acad Sci USA. 2005;102:15545–15550. doi: 10.1073/pnas.0506580102. [DOI] [PMC free article] [PubMed] [Google Scholar]
- 9.Greenbaum D, Jansen R, Gerstein M. Analysis of mRNA expression and protein abundance data: an approach for the comparison of the enrichment of features in the cellular population of proteins and transcripts. Bioinformatics. 2002;18:585–596. doi: 10.1093/bioinformatics/18.4.585. [DOI] [PubMed] [Google Scholar]
- 10.Hornik K (2012) The comprehensive R archive network. Wiley interdisciplinary reviews: Computational statistics
- 11.Gregory Alvord W, Roayaei JA, Quiñones OA, Schneider KT. A microarray analysis for differential gene expression in the soybean genome using Bioconductor and R. Brief Bioinform. 2007;8(6):415–431. doi: 10.1093/bib/bbm043. [DOI] [PubMed] [Google Scholar]
- 12.Gentleman RC, Carey VJ, Bates DM, Bolstad B, Dettling M, Dudoit S, Ellis B, Gautier L, Ge Y, Gentry J. Bioconductor: open software development for computational biology and bioinformatics. Genome Biol. 2004;5:R80. doi: 10.1186/gb-2004-5-10-r80. [DOI] [PMC free article] [PubMed] [Google Scholar]
- 13.Ogata H, Goto S, Sato K, Fujibuchi W, Bono H, Kanehisa M. KEGG: kyoto encyclopedia of genes and genomes. Nucleic Acids Res. 1999;27:29–34. doi: 10.1093/nar/27.1.29. [DOI] [PMC free article] [PubMed] [Google Scholar]
- 14.Brown MB (1975) 400: A method for combining non-independent, one-sided tests of significance. Biometrics 987–992
- 15.MacDonald JW, Ghosh D. COPA—cancer outlier profile analysis. Bioinformatics. 2006;22:2950–2951. doi: 10.1093/bioinformatics/btl433. [DOI] [PubMed] [Google Scholar]
- 16.Tun HW, Marlow LA, von Roemeling CA, Cooper SJ, Kreinest P, Wu K, Luxon BA, Sinha M, Anastasiadis PZ, Copland JA. Pathway signature and cellular differentiation in clear cell renal cell carcinoma. PLoS One. 2010;5:e10696. doi: 10.1371/journal.pone.0010696. [DOI] [PMC free article] [PubMed] [Google Scholar]
- 17.Maruschke M, Reuter D, Koczan D, Hakenberg OW, Thiesen HJ. Gene expression analysis in clear cell renal cell carcinoma using gene set enrichment analysis for biostatistical management. BJU Int. 2011;108:E29–E35. doi: 10.1111/j.1464-410X.2010.09794.x. [DOI] [PubMed] [Google Scholar]
- 18.Chow WH, Gridley G, Fraumeni JF, Jr, Jarvholm B. Obesity, hypertension, and the risk of kidney cancer in men. N Engl J Med. 2000;343:1305–1311. doi: 10.1056/NEJM200011023431804. [DOI] [PubMed] [Google Scholar]
- 19.Brock KE, Gridley G, Chiu BC, Ershow AG, Lynch CF, Cantor KP. Dietary fat and risk of renal cell carcinoma in the USA: a case-control study. Br J Nutr. 2009;101:1228. doi: 10.1017/S0007114508056043. [DOI] [PMC free article] [PubMed] [Google Scholar]
- 20.Pollard PJ, Wortham NC, Tomlinson IP. The TCA cycle and tumorigenesis: the examples of fumarate hydratase and succinate dehydrogenase. Ann Med. 2003;35:632–639. doi: 10.1080/07853890310018458. [DOI] [PubMed] [Google Scholar]
- 21.Linehan WM, Srinivasan R, Schmidt LS. The genetic basis of kidney cancer: a metabolic disease. Nat Rev Urol. 2010;7:277–285. doi: 10.1038/nrurol.2010.47. [DOI] [PMC free article] [PubMed] [Google Scholar]
- 22.Vanharanta S, Buchta M, McWhinney SR, Virta SK, Peczkowska M, Morrison CD, Lehtonen R, Januszewicz A, Jarvinen H, Juhola M, Mecklin JP, Pukkala E, Herva R, Kiuru M, Nupponen NN, Aaltonen LA, Neumann HP, Eng C. Early-onset renal cell carcinoma as a novel extraparaganglial component of SDHB-associated heritable paraganglioma. Am J Hum Genet. 2004;74:153–159. doi: 10.1086/381054. [DOI] [PMC free article] [PubMed] [Google Scholar]
- 23.Ricketts C, Woodward ER, Killick P, Morris MR, Astuti D, Latif F, Maher ER. Germline SDHB mutations and familial renal cell carcinoma. J Natl Cancer Inst. 2008;100:1260–1262. doi: 10.1093/jnci/djn254. [DOI] [PubMed] [Google Scholar]
- 24.Isaacs JS, Jung YJ, Mole DR, Lee S, Torres-Cabala C, Chung YL, Merino M, Trepel J, Zbar B, Toro J, Ratcliffe PJ, Linehan WM, Neckers L. HIF overexpression correlates with biallelic loss of fumarate hydratase in renal cancer: novel role of fumarate in regulation of HIF stability. Cancer Cell. 2005;8:143–153. doi: 10.1016/j.ccr.2005.06.017. [DOI] [PubMed] [Google Scholar]
- 25.Carmeliet P, Dor Y, Herbert JM, Fukumura D, Brusselmans K, Dewerchin M, Neeman M, Bono F, Abramovitch R, Maxwell P, Koch CJ, Ratcliffe P, Moons L, Jain RK, Collen D, Keshert E. Role of HIF-1alpha in hypoxia-mediated apoptosis, cell proliferation and tumour angiogenesis. Nature. 1998;394:485–490. doi: 10.1038/28867. [DOI] [PubMed] [Google Scholar]
- 26.Rapisarda A, Uranchimeg B, Scudiero DA, Selby M, Sausville EA, Shoemaker RH, Melillo G. Identification of small molecule inhibitors of hypoxia-inducible factor 1 transcriptional activation pathway. Cancer Res. 2002;62:4316–4324. [PubMed] [Google Scholar]
- 27.Petit V, Thiery JP. Focal adhesions: structure and dynamics. Biol Cell. 2000;92:477–494. doi: 10.1016/S0248-4900(00)01101-1. [DOI] [PubMed] [Google Scholar]
- 28.Frisch SM, Francis H. Disruption of epithelial cell-matrix interactions induces apoptosis. J Cell Biol. 1994;124:619–626. doi: 10.1083/jcb.124.4.619. [DOI] [PMC free article] [PubMed] [Google Scholar]
- 29.Frisch SM, Screaton RA. Anoikis mechanisms. Curr Opin Cell Biol. 2001;13:555–562. doi: 10.1016/S0955-0674(00)00251-9. [DOI] [PubMed] [Google Scholar]
- 30.Sakamoto S, Schwarze S, Kyprianou N. Anoikis disruption of focal adhesion-Akt signaling impairs renal cell carcinoma. Eur Urol. 2011;59:734–744. doi: 10.1016/j.eururo.2010.12.038. [DOI] [PMC free article] [PubMed] [Google Scholar]
- 31.Jacobsen J, Grankvist K, Rasmuson T, Bergh A, Landberg G, Ljungberg B. Expression of vascular endothelial growth factor protein in human renal cell carcinoma. BJU Int. 2004;93:297–302. doi: 10.1111/j.1464-410X.2004.04605.x. [DOI] [PubMed] [Google Scholar]
- 32.Tsuchiya N, Sato K, Akao T, Kakinuma H, Sasaki R, Shimoda N, Satoh S, Habuchi T, Ogawa O, Kato T. Quantitative analysis of gene expressions of vascular endothelial growth factor-related factors and their receptors in renal cell carcinoma. Tohoku J Exp Med. 2001;195:101–113. doi: 10.1620/tjem.195.101. [DOI] [PubMed] [Google Scholar]
- 33.Rini BI, Small EJ. Biology and clinical development of vascular endothelial growth factor-targeted therapy in renal cell carcinoma. J Clin Oncol. 2005;23:1028–1043. doi: 10.1200/JCO.2005.01.186. [DOI] [PubMed] [Google Scholar]
- 34.Negrier S, Gravis G, Perol D, Chevreau C, Delva R, Bay JO, Blanc E, Ferlay C, Geoffrois L, Rolland F, Legouffe E, Sevin E, Laguerre B, Escudier B. Temsirolimus and bevacizumab, or sunitinib, or interferon alfa and bevacizumab for patients with advanced renal cell carcinoma (TORAVA): a randomised phase 2 trial. Lancet Oncol. 2011;12:673–680. doi: 10.1016/S1470-2045(11)70124-3. [DOI] [PubMed] [Google Scholar]
- 35.Rini BI, Escudier B, Tomczak P, Kaprin A, Szczylik C, Hutson TE, Michaelson MD, Gorbunova VA, Gore ME, Rusakov IG, Negrier S, Ou YC, Castellano D, Lim HY, Uemura H, Tarazi J, Cella D, Chen C, Rosbrook B, Kim S, Motzer RJ. Comparative effectiveness of axitinib versus sorafenib in advanced renal cell carcinoma (AXIS): a randomised phase 3 trial. Lancet. 2011;378:1931–1939. doi: 10.1016/S0140-6736(11)61613-9. [DOI] [PubMed] [Google Scholar]
- 36.van der Flier A, Sonnenberg A. Function and interactions of integrins. Cell Tissue Res. 2001;305:285–298. doi: 10.1007/s004410100417. [DOI] [PubMed] [Google Scholar]
- 37.Burridge K, Fath K, Kelly T, Nuckolls G, Turner C. Focal adhesions: transmembrane junctions between the extracellular matrix and the cytoskeleton. Annu Rev Cell Biol. 1988;4:487–525. doi: 10.1146/annurev.cb.04.110188.002415. [DOI] [PubMed] [Google Scholar]
- 38.Guo W, Giancotti FG. Integrin signalling during tumour progression. Nat Rev Mol Cell Biol. 2004;5:816–826. doi: 10.1038/nrm1490. [DOI] [PubMed] [Google Scholar]
- 39.Zhou L, Chen J, Li Z, Li X, Hu X, Huang Y, Zhao X, Liang C, Wang Y, Sun L, Shi M, Xu X, Shen F, Chen M, Han Z, Peng Z, Zhai Q, Zhang Z, Yang R, Ye J, Guan Z, Yang H, Gui Y, Wang J, Cai Z, Zhang X. Integrated profiling of microRNAs and mRNAs: microRNAs located on Xq27.3 associate with clear cell renal cell carcinoma. PLoS One. 2010;5:e15224. doi: 10.1371/journal.pone.0015224. [DOI] [PMC free article] [PubMed] [Google Scholar]
- 40.Nishiyama Y, Tanaka T, Naitoh H, Mori C, Fukumoto M, Hiai H, Toyokuni S. Overexpression of integrin-associated protein (CD47) in rat kidney treated with a renal carcinogen, ferric nitrilotriacetate. Jpn J Cancer Res. 1997;88:120–128. doi: 10.1111/j.1349-7006.1997.tb00356.x. [DOI] [PMC free article] [PubMed] [Google Scholar]
- 41.Mizumori O, Zembutsu H, Kato Y, Tsunoda T, Miya F, Morizono T, Tsukamoto T, Fujioka T, Tomita Y, Kitamura T, Ozono S, Miki T, Naito S, Akaza H, Nakamura Y. Identification of a set of genes associated with response to interleukin-2 and interferon-alpha combination therapy for renal cell carcinoma through genome-wide gene expression profiling. Exp Ther Med. 2010;1:955–961. doi: 10.3892/etm.2010.148. [DOI] [PMC free article] [PubMed] [Google Scholar]
- 42.Dienstmann R, Brana I, Rodon J, Tabernero J. Toxicity as a biomarker of efficacy of molecular targeted therapies: focus on EGFR and VEGF inhibiting anticancer drugs. Oncologist. 2011;16:1729–1740. doi: 10.1634/theoncologist.2011-0163. [DOI] [PMC free article] [PubMed] [Google Scholar]