

Abstract
Human papillomavirus (HPV) was recently recognized as a new risk factor for head and neck squamous cell carcinoma. For oropharyngeal cancers, an HPV+ status is associated with better prognosis in a subgroup of nonsmokers and nondrinkers. However, HPV infection is also involved in the biology of head and neck carcinoma (HNC) in patients with a history of tobacco use and/or alcohol consumption. Thus, the involvement of HPV infection in HN carcinogenesis remains unclear, and further studies are needed to identify and analyze HPV-specific pathways that are involved in this process. Using a quantitative proteomics-based approach, we compared the protein expression profiles of two HPV+ HNC cell lines and one HPV− HNC cell line. We identified 155 proteins that are differentially expressed (P < 0.01) in these three lines. Among the identified proteins, prostate stem cell antigen (PSCA) was upregulated and eukaryotic elongation factor 1 alpha (EEF1α) was downregulated in the HPV+ cell lines. Immunofluorescence and western blotting analyses confirmed these results. Moreover, PSCA and EEF1α were differentially expressed in two clinical series of 50 HPV+ and 50 HPV− oral cavity carcinomas. Thus, our study reveals for the first time that PSCA and EEF1α are associated with the HPV-status, suggesting that these proteins could be involved in HPV-associated carcinogenesis.
1. Introduction
Head and neck cancers (HNCs) constitute a heterogeneous group of tumors that often arise in the oral cavity, oropharynx, hypopharynx, and larynx. HNC is the sixth most common cancer, with as many as 466,831 new cases diagnosed in men in 2008 [1]. HNC generally has a poor prognosis; its 5-year survival rate ranges between 40 and 50%. HNC patients usually have histories of heavy tobacco and alcohol consumption. However, the International Agency for Research in Cancer (IARC) has recently recognized human papillomavirus (HPV) as a risk factor for oropharyngeal squamous cell carcinoma (OSCC). Indeed, numerous studies have provided consistent evidence that HPV has an etiologic role in 20 to 50% of OSCCs, and it is associated with a better prognosis in terms of survival and response to therapy [2].
Although the relationship between HPV infection and patient prognosis seems clear in oropharyngeal carcinoma, this relationship is less evident in the other anatomical sites affected by HNC, such as the oral cavity, larynx, and hypopharynx. The meta-analysis performed by Ragin and Taioli, which examined the relationship between HPV and overall survival, did not show any differences between HPV+ and HPV− patients with cancers at nonoropharyngeal sites [3]. Recently, we demonstrated that HPV+ oral SCC patients with a history of tobacco use and/or alcohol consumption have a significantly poorer prognosis compared to HPV− patients [4], and two Swedish studies reported that oral HPV infection is associated with a dramatically increased risk of recurrence in oral SCCs [5, 6]. However, other studies have failed to demonstrate an association between HPV status and prognosis [7–9]. Therefore, it seems clear that the biology of oropharyngeal tumors in younger patients, nondrinkers, and nonsmokers is distinct from that of nonoropharyngeal SCC in older patients and those with a history of tobacco use and/or alcohol consumption [10]. While it is unclear whether tobacco is a risk factor for HPV-induced oropharyngeal tumors, smoking has a negative impact on the survival of HPV+ patients [11]. Thus, researchers agree that there are several possible physiological states according to the patient's HPV infection status, which may or may not be associated with the classical risk factors. Therefore, it is important to understand these differences and the signaling pathways responsible for HPV infection.
Proteomic analysis represents a promising approach for identifying HPV-related signaling pathways. However, a paucity of literature exists regarding the biology of HPV-mediated head and neck tumors. A small number of proteomic studies have been conducted, and these investigations have identified HPV-specific protein candidates in HNC. Additional proteins with altered expression levels were previously identified using 2D electrophoresis followed by mass spectrometry. S100A8, a calcium-binding protein, is a powerful biomarker of HPV18 infection in oral SCC patients [12] and is involved in tumor development and progression [13]. In another study, Melle et al. detected two interesting protein markers that were significantly upregulated in HPV+ oral SCC, TRX and E-FABP [14].
Here, we used a quantitative proteomic-based approach to visualize major changes in protein expression between HPV+ and HPV− HNSCC cell lines. Among these proteins, we selected two candidates to validate our proteomic approach and studied their involvement in the carcinogenesis of HPV+ head and neck cancers. To this end, we performed immunohistochemistry on two clinical series (50 HPV+ oral SCC patients and 50 HPV− oral SCC patients) to support our results. In summary, this study aimed to establish a proteomic signature of HPV infection in head and neck cancer in order to better understand the mechanisms by which HPV drives head and neck carcinogenesis.
2. Materials and Methods
2.1. Cell Lines
The cell lines used in this study, which were derived from head and neck squamous cell carcinomas, are described in Table 1. Previous to the experiences described below, we performed PCR using E6 and E7 primers to confirm the HPV status of each cell line. The 93VU-174T cell line was obtained from Dr. de Winter (University Medical Center of Amsterdam). The UPCI-SCC-131, Detroit 562, UPCI-SCC-90, and UPCI-SCC-154 cell lines were grown in Minimum Essential Medium (MEM, Gibco Life Technologies, Paisley, UK) supplemented with 10% fetal bovine serum (FBS, Lonza, Verviers, Belgium), 2% L-glutamine (PAA Laboratories, Pasching, Austria), 1% penicillin/streptomycin (PAA Laboratories, Pasching, Austria), and 1% nonessential amino acids (Gibco Life Technologies, Paisley, UK) at 37°C in a humidified 95% air-5% CO2 atmosphere. The FaDU and 93VU-147T cell lines were grown in Dulbecco's Modified Eagle Medium (DMEM, Lonza, Verviers, Belgium) supplemented with 10% FBS, 2% L-glutamine, and 1% penicillin/streptomycin at 37°C in a humidified 95% air-5% CO2 atmosphere. The culture medium was changed three times each week, and the cells were passaged when they reached 90% confluence. Table 1 presents the characteristics of the cell lines used in this study.
Table 1.
Description of the characteristics of the cell lines used.
| Cell line name | Anatomical site | TNM stage | Sex | HPV status | Origin |
|---|---|---|---|---|---|
| FaDU | Hypopharynx | TxNxMx | Male | HPV-negative | ATCC |
| UPCI-SCC-131 | Oral cavity | T2N2M0 | Male | HPV-negative | ATCC |
| Detroit 562 | Pharynx | TxNxMx | Female | HPV-negative | ATCC |
| UPCI-SCC-90 | Oropharynx | T2N1M0 | Male | HPV-positive | ATCC |
| 93VU-147T | Oral cavity | T4N2 | Male | HPV-positive | University Medical Center of Amsterdam |
| UPCI-SCC-154 | Oral cavity | T4N2 | Male | HPV-positive | ATCC |
2.2. Protein Extraction and Sample Preparation
For total protein extraction, cells were washed twice in cold PBS and centrifuged, and the cell pellets were stored at −80°C. Protein extraction was performed using 6 M guanidinium chloride (lysis buffer from the ICPL kit, SERVA, Germany). The solution was then ultrasonicated for 3 × 10 sec (60% amplitude, U50 IKAtechnik, IMLAB, Boutersem, Belgium) and incubated for 20 min at room temperature. The supernatant was recovered by centrifugation (13,000 rpm for 30 min at 4°C), and the protein concentration was determined according to the Bradford method, using bovine gamma-globulin as a standard.
The proteins were reduced, and their cysteines were alkylated using an ICPL kit (SERVA). The proteins were recovered via acetone precipitation and digested into peptides using trypsin at an enzyme/substrate ratio of 1 : 50 overnight at 37°C. The next day, trypsin digestion was stopped by adding 0.1% formic acid.
2.3. Proteomic Analysis: LC MS/MS Analysis
Protein identification and quantification were performed using a label-free strategy on an UHPLC-HRMS platform (Eksigent 2D Ultra and AB SCIEX TripleTOF 5600). The peptides (2 μg) were separated on a 25 cm C18 column (Acclaim PepMap100, 3 μm, Dionex) using a linear gradient (5–35% over 120 min) of acetonitrile (ACN) in water containing 0.1% formic acid at a flow rate of 300 nL min−1. To obtain the highest possible retention time stability, which is required for label-free quantification, the column was equilibrated with a 10× volume of 5% ACN before each injection. Mass spectra (MS) were acquired across 400–1500 m/z in high-resolution mode with a 500 msec accumulation time. The precursor selection parameters were as follows: intensity threshold 200 cps, 50 precursors maximum per cycle, 50 msec accumulation time, and 15 sec exclusion after one spectrum. These parameters led to a duty cycle of 3 sec per cycle, ensuring that high-quality extracted ion chromatograms (XICs) were obtained for peptide quantification.
2.4. Data Processing
ProteinPilot Software (v4.1) was used to conduct a database search against the UniProt Trembl database (09/30/2011 version), which was restricted to Homo sapiens entries. The search parameters included differential amino acid mass shifts for carbamidomethyl cysteine, all biological modifications, amino acid substitutions, and missed trypsin cleavage.
For peptide quantification, PeakView was used to construct XICs for the top 5 peptides of each protein identified with an FDR lower than 1%. Only unmodified and unshared peptides were used for quantification. Peptides were also excluded if their identification confidence was below 0.99, as determined by ProteinPilot. A retention time window of 2 min and a mass tolerance of 0.015 m/z were used. The calculated XICs were exported into MarkerView, and they were normalized based on the summed area of the entire run. Only proteins presenting a fold change higher/lower than 1.5/0.6 with a P value lower than 0.05 across the 3 biological replicates analyzed were taken into account for metabolic characterization. Fold changes were assessed using Student's t-test. Finally, proteins identified with 1 peptide were validated manually.
2.5. Immunofluorescence Staining
Cells were seeded at a density of 5 × 10⁵ cells/well in 12-well plates containing sterile round glass coverslips and grown at 37°C and 5% CO2 for 5 days. The cells were washed with PBS and fixed with 4% paraformaldehyde for 15 min. The fixed cells were rinsed with PBS, permeabilized with 0.1% Triton X-100 in PBS for 15 min and blocked with 0.05% casein for 20 min. Then, the cells were treated overnight with primary antibodies against PSCA (Pierce anti-PSCA rabbit polyclonal antibody, Thermo Scientific, Rockford, USA) and EEF1α (anti-EEF1A1 rabbit antibody (N-term), Abgent, Huissen, The Netherlands), which were diluted 1 : 50 in blocking solution. The next day, the cells were washed with PBS containing 0.1% Triton X-100 and incubated with Alexa Fluor 488-conjugated anti-rabbit IgG (Invitrogen, Gent, Belgium) for 1 h. The cells were washed with PBS containing 0.1% Triton X-100 for 15 min, rinsed with distilled water for 10 min and mounted with Vectashield Mounting Medium containing DAPI (Vector Laboratories). The cells were observed by confocal microscopy using an Olympus FV1000D laser scanning inverted microscope (Olympus, Hamburg, Germany). The exposure time of each photo was 27.59 s/frame, pictures were captured at 1600 pix/1600 pix, and the pixel time was 10.0 μs/pix. The background noise was adjusted in the same manner and to the same level for each picture. Each picture was analyzed semiquantitatively.
2.6. Western Blot Analysis
Proteins were extracted from cells using BugBuster Protein extraction reagent (Novagen, Darmstadt, Germany), and the protein concentrations of the extracts were determined using a Bio-Rad protein assay (BioRad Laboratories, München, Germany). Four microliters 4× LDS sample buffer (NuPAGE, Invitrogen) and 1 μL 20× reducing agent (Fermentas) were added to each protein extract, and the sample volume was brought to 20 μL with deionized water. The samples were heated at 95°C for 5 min, and 30 μg of proteins was separated on 4–20% Mini Protean Gels (BioRad Laboratories, München, Germany). After electrophoresis, the proteins were electrotransferred onto nitrocellulose membranes (Hybond ECL, Amersham). Nonspecific binding sites were blocked by incubation with PBS containing 5% nonfat milk at room temperature for 1 h. Immunodetection was performed overnight at 4°C using anti-EEF1α (anti-EEF1A1 rabbit antibody (N-term), Abgent, Huissen, The Netherlands) and anti-PSCA (Pierce anti-PSCA rabbit polyclonal antibody, Thermo Scientific, Rockford, USA) antibodies, which were diluted 1 : 100 in PBS containing 2% nonfat milk. The membrane was washed three times with PBS and incubated for 1 h at room temperature with HRP-conjugated goat anti-rabbit IgG (GE Healthcare Life Sciences, Buckinghamshire, UK), which was diluted in PBS containing 2% nonfat milk. The bound peroxidase was detected using the SuperSignal West Femto kit (Roche), and the bands were visualized by exposing the membranes to photosensitive film (Hyperfilm ECL, Amersham Pharmacia Biotech).
2.7. Patients and Tissue Samples
We examined 100 formalin-fixed, paraffin-embedded oral SCC specimens obtained from patients who underwent radical curative surgery between January 2004 and December 2008 at Saint Pieter's Hospital (Brussels) or the EpiCURA Center (Baudour). The tumors were classified according to the TNM classification of the International Union Against Cancer. Table 2 presents the clinical data of our patients. Among these 100 cases, 50 were HPV+ and 50 were HPV−. This study was approved by the Saint Pieter's Hospital Institutional Review Board (AK/09-09-47/3805AD).
Table 2.
Clinical data of the 100 oral SCC patients.
| Variables | Number of cases |
|---|---|
| Age (years) | |
| Range | 36–90 |
| Mean | 58 |
| Sex | |
| Male | 82 |
| Female | 18 |
| Anatomic site | |
| Cheeks | 4 |
| Mouth floor | 32 |
| Tongue | 36 |
| Gums | 8 |
| Mandible | 5 |
| Palate | 2 |
| Retromolar trigone | 2 |
| Lips | 2 |
| Other | 9 |
| Grade (differentiation) | |
| Well | 30 |
| Moderately | 51 |
| Poorly | 19 |
| TNM stage | |
| T1-T2 | 72 |
| T3-T4 | 28 |
| N stage | |
| N0 | 53 |
| N1 | 12 |
| N2 | 33 |
| N3 | 2 |
| Metastasis | |
| M0 | 100 |
| M1 | 0 |
| Risk factors | |
| Tobacco (90 cases) | |
| Smoker | 67 |
| Nonsmoker | 16 |
| Former smoker | 7 |
| Alcohol (90 cases) | |
| Drinker | 58 |
| Nondrinker | 9 |
| Former drinker | 23 |
| Histology | |
| Bone infiltration | 2 |
| Perineural invasion | 10 |
| Positive node | 19 |
| Capsular evasion | 11 |
| Recurrence | |
| Local | 11 |
| Ganglionic | 6 |
| Distant metastases | 4 |
2.8. HPV Detection and Typing
HPV detection and typing of paraffin-embedded tissues were performed as described in our previous work [9]. DNA extraction was performed using a QIAamp DNA Mini Kit (Qiagen, Benelux, Belgium), according to the manufacturer's protocol. HPV was detected using PCR with GP5+/GP6+ primers. All DNA extracts were analyzed for the presence of 18 different HPV genotypes using a TaqMan-based real-time quantitative PCR targeting type-specific sequences of the following viral genes: 6 E6, 11 E6, 16 E7, 18 E7, 31 E6, 33 E6, 35 E6, 39 E7, 45 E7, 51 E6, 52 E7, 53 E6, 56 E7, 58 E6, 59 E7, 66 E6, 67 L1, and 68 E7. In each PCR assay, β-globin levels were assessed using real-time quantitative PCR to verify the quality of the DNA in the samples and measure the amount of input DNA.
2.9. Immunohistochemistry of HPV+ and HPV− Oral Carcinoma Samples
All tumors samples were fixed for 24 h in 10% buffered formaldehyde, dehydrated, and embedded in paraffin. Immunohistochemistry was performed on 5 μm thick sections mounted on silane-coated glass sides. The paraffin-embedded tissue specimens were deparaffinized in toluene, soaked in ethanol, and then soaked in PBS. They were pretreated in a pressure cooker (11 min for PSCA and 6 min for EEF1α) in a 10% citrate buffer solution (for EEF1α) or a 10% EDTA solution (for PSCA) to unmask the antigens. Then, the sections were incubated in 0.06% hydrogen peroxide for 5 min to block endogenous peroxidase activity, rinsed in PBS, blocked with Protein Block (Serum-Free, Dako, Carpinteria, USA), and incubated at 4°C overnight with rabbit anti-PSCA (Thermo Scientific, Rockford, USA) or anti-EEF1α (Bio-Connect, TE Huissen, The Netherlands). The next day, the tissues were incubated with Post Blocking Antibody for 15 min, followed by PowerVision (ImmunoLogic, Duiven, The Netherlands) for 30 min. The slides were washed with PBS between incubation steps. Finally, the localization of the antibody/antigen complex was visualized by staining with DAB (BioGenex, Fremont, USA), and the sections were counterstained with Luxol Fast Blue and mounted with a synthetic medium. To exclude antigen-independent staining, controls, for which the incubation step with the primary antibody was omitted, were examined. In all cases, these controls were negative.
2.10. Semiquantitative Immunohistochemical Analysis
Two independent investigators, who were blinded to the clinical details of the patients, assessed PSCA and EEF1α immunoreactivities in all tumor areas using an optical microscope (Axiocam MRc5, Zeiss). The mean intensity (MI) was defined as follows: 0 (negative), 1 (weak), 2 (moderate), and 3 (strong). The percentage of immunopositive cells (labeling index, LI) was categorized as follows: 0 (0% positive cells), 1 (1–25%), 2 (26–75%), and 3 (76–100%). Statistical analysis was performed using the Mann-Whitney test to compare the MI and LI values between the HPV+ and HPV− samples.
3. Results
3.1. Protein Profiling of HPV+ versus HPV− Head and Neck Cancer Cell Lines
Protein profiling using label-free quantification was conducted to identify proteins whose expression was altered by HPV infection. To elucidate the specific effects of HPV in head and neck carcinogenesis and identify potential candidates, we compared the differential patterns of protein expression between one HPV− cell line (FaDU) and two HPV+ cell lines (93VU-147T and UPCI-SCC90). Proteins extracts were analyzed in triplicate for each cell line using tandem mass spectrometry.
For this analysis, we were interested in proteins that had increased or decreased expression levels and are clinically relevant.
Analysis of the three cancer cell lines identified 2221 proteins, among which 155 were differentially expressed between the HPV− and HPV+ cells with significant P values of <0.01; 56 of these were downregulated, and 99 were upregulated (Table 3). Two interesting candidates caught our attention due to their known properties and their large fold changes. The expression of prostate stem cell antigen (PSCA) (Accession number: D3DWI6) was reduced 140-fold in the FaDu cells compared to the HPV+ cell lines. Moreover, PSCA has been reported to be oncogenic in some epithelial cells and a tumor suppressor in others. Eukaryotic elongation factor 1 α (EEF1α) (Accession number: Q6IPS9) expression was four fold higher in the HPV− cells than the HPV+ cell lines. Its upregulation was recently reported to be associated with increased cell proliferation and oncogenic transformation.
Table 3.
Proteins with decreased and increased abundance between the HPV− cell line and the HPV+ cell lines.
| Accession number | P value | Fold change | Protein name | Number of peptide identified (95%) |
|---|---|---|---|---|
| tr∣D3DWI6∣D3DWI6_HUMAN | 0.007 | 0.007 | Prostate stem cell antigen | 1 |
| tr∣Q6LES2∣Q6LES2_HUMAN | 0.000005 | 0.045 | ANXA4 protein | 22 |
| tr∣B3KY42∣B3KY42_HUMAN | 0.001 | 0.062 | cDNA FLJ46788 fis, clone TRACH3028855, highly similar to Pseudouridylate synthase 7 | 1 |
| tr∣B4E2Q6∣B4E2Q6_HUMAN | 0.003 | 0.093 | Regulation of nuclear pre-mRNA domain-containing protein 2 | 2 |
| tr∣F8WE04∣F8WE04_HUMAN | 0.00156 | 0.111 | Heat shock protein beta-1 | 54 |
| tr∣Q59GW6∣Q59GW6_HUMAN | 0.00375 | 0.134 | Acetyl-CoA acetyltransferase, cytosolic variant | 20 |
| tr∣B7Z992∣B7Z992_HUMAN | 0.00369 | 0.137 | cDNA FLJ53698, highly similar to Gelsolin | 39 |
| tr∣A8K287∣A8K287_HUMAN | 0.00793 | 0.143 | Synaptosomal-associated protein | 1 |
| tr∣A8K5J7∣A8K5J7_HUMAN | 0.00757 | 0.150 | cDNA FLJ77290, highly similar to Homo sapiens BCL2-associated athanogene 5 | 1 |
| tr∣B2R4I8∣B2R4I8_HUMAN | 0.00098 | 0.159 | cDNA, FLJ92106, highly similar to Homo sapiens adaptor-related protein complex 3, sigma 1 subunit(AP3S1), | 2 |
| tr∣E9PPU0∣E9PPU0_HUMAN | 0.00505 | 0.168 | Epiplakin | 97 |
| tr∣B7Z6B8∣B7Z6B8_HUMAN | 0.00178 | 0.171 | 2,4-dienoyl-CoA reductase, mitochondrial | 10 |
| tr∣Q6NVI1∣Q6NVI1_HUMAN | 0.00008 | 0.197 | MARCKS protein | 26 |
| tr∣C9JEJ2∣C9JEJ2_HUMAN | 0.00782 | 0.199 | Choline-phosphate cytidylyltransferase A | 15 |
| tr∣Q9BRV4∣Q9BRV4_HUMAN | 0.00187 | 0.202 | Vesicle-associated membrane protein 3 (Cellubrevin) | 3 |
| tr∣B2RCZ7∣B2RCZ7_HUMAN | 0.00005 | 0.204 | Ethylmalonic encephalopathy 1, isoform CRA_a | 18 |
| tr∣B4DL87∣B4DL87_HUMAN | 0.00444 | 0.206 | cDNA FLJ52243, highly similar to Heat-shock protein beta-1 | 70 |
| tr∣B7WPG3∣B7WPG3_HUMAN | 0.00444 | 0.208 | Heterogeneous nuclear ribonucleoprotein L-like | 1 |
| tr∣Q6IAX6∣Q6IAX6_HUMAN | 0.00052 | 0.213 | 3′-phosphoadenosine 5′-phosphosulfate synthase 1 OS | 1 |
| tr∣E7EMB1∣E7EMB1_HUMAN | 0.00413 | 0.227 | Switch-associated protein 70 | 9 |
| tr∣E9PMV1∣E9PMV1_HUMAN | 0.00202 | 0.238 | Plectin | 10 |
| tr∣F5GXF7∣F5GXF7_HUMAN | 0.00479 | 0.252 | Zinc finger protein 185 | 16 |
| tr∣E5RJR5∣E5RJR5_HUMAN | 0.00022 | 0.252 | S-phase kinase-associated protein 1 | 4 |
| tr∣E7ESP4∣E7ESP4_HUMAN | 0.00135 | 0.259 | Integrin alpha-2 | 12 |
| tr∣Q96IF9∣Q96IF9_HUMAN | 0.00454 | 0.273 | VCP protein | 112 |
| tr∣F8W785∣F8W785_HUMAN | 0.00221 | 0.276 | Golgi integral membrane protein 4 | 1 |
| tr∣B7Z5V6∣B7Z5V6_HUMAN | 0.00881 | 0.278 | cDNA FLJ57046, highly similar to Lysosomal alpha-glucosidase | 4 |
| tr∣A6NEL0∣A6NEL0_HUMAN | 0.00582 | 0.279 | Non-histone chromosomal protein HMG-14 | 19 |
| tr∣G0TQY6∣G0TQY6_HUMAN | 0.00471 | 0.281 | Lutheran blood group | 19 |
| tr∣A8K4W6∣A8K4W6_HUMAN | 0.00045 | 0.287 | Phosphoglycerate kinase | 123 |
| tr∣Q53RU4∣Q53RU4_HUMAN | 0.00154 | 0.292 | Putative uncharacterized protein MSH2 | 4 |
| tr∣A8K2Y9∣A8K2Y9_HUMAN | 0.0011 | 0.308 | 6-phosphogluconate dehydrogenase, decarboxylating | 33 |
| tr∣B3KMV5∣B3KMV5_HUMAN | 0.00078 | 0.319 | cDNA FLJ12728 fis, clone NT2RP2000040, highly similar to Protein FAM62A | 9 |
| tr∣B3KMN7∣B3KMN7_HUMAN | 0.00131 | 0.320 | cDNA FLJ11717 fis, clone HEMBA1005241 | 5 |
| tr∣B4DN60∣B4DN60_HUMAN | 0.00015 | 0.323 | Asparagine-tRNA ligase, cytoplasmic | 10 |
| tr∣B1ANK7∣B1ANK7_HUMAN | 0.00465 | 0.347 | Fumarate hydratase | 19 |
| tr∣Q0VDC6∣Q0VDC6_HUMAN | 0.00257 | 0.357 | FKBP1A protein | 9 |
| tr∣C8KIL8∣C8KIL8_HUMAN | 0.00769 | 0.368 | Glutathione reductase delta8 alternative splicing variant | 1 |
| tr∣B4DUK1∣B4DUK1_HUMAN | 0.00161 | 0.375 | cDNA FLJ51310, moderately similar to Peroxiredoxin-6 | 10 |
| tr∣E9PP14∣E9PP14_HUMAN | 0.00564 | 0.383 | GDP-L-fucose synthase | 1 |
| tr∣D6RE99∣D6RE99_HUMAN | 0.00776 | 0.399 | Histidine triad nucleotide-binding protein 1 | 8 |
| tr∣B1AKP7∣B1AKP7_HUMAN | 0.00099 | 0.403 | TAR DNA binding protein | 11 |
| tr∣Q6FHQ6∣Q6FHQ6_HUMAN | 0.00442 | 0.418 | IDH1 protein | 21 |
| tr∣A8K4I2∣A8K4I2_HUMAN | 0.00771 | 0.421 | Histone 1, H1c | 123 |
| tr∣A0PK02∣A0PK02_HUMAN | 0.00526 | 0.424 | PLXNB2 protein | 3 |
| tr∣Q6IAW5∣Q6IAW5_HUMAN | 0.00939 | 0.446 | CALU protein | 22 |
| tr∣Q6ZNW0∣Q6ZNW0_HUMAN | 0.0098 | 0.449 | cDNA FLJ27036 fis, clone SLV08019, highly similar to Homo sapiens stomatin (EPB72)-like 2 (STOML2) | 10 |
| tr∣A4UCS8∣A4UCS8_HUMAN | 0.00267 | 0.455 | Enolase | 130 |
| tr∣Q5TZZ9∣Q5TZZ9_HUMAN | 0.00184 | 0.461 | ANXA1 protein | 96 |
| tr∣E2DRY6∣E2DRY6_HUMAN | 0.00118 | 0.504 | Enolase | 217 |
| tr∣A4D105∣A4D105_HUMAN | 0.00122 | 0.514 | Replication protein A3, 14 kDa | 7 |
| tr∣Q5TCI8∣Q5TCI8_HUMAN | 0.00168 | 0.530 | Lamin A/C | 119 |
| tr∣B2R5W3∣B2R5W3_HUMAN | 0.00065 | 0.566 | cDNA, FLJ92658, highly similar to Homo sapiens poly (ADP-ribose) polymerase family, member 1 (PARP1) | 51 |
| tr∣B4E0E1∣B4E0E1_HUMAN | 0.00065 | 0.566 | cDNA FLJ53442, highly similar to Poly (ADP-ribose) polymerase 1 | 52 |
| tr∣D6W5C0∣D6W5C0_HUMAN | 0.0096 | 0.608 | Spectrin, beta, nonerythrocytic 1, isoform CRA_b | 39 |
| tr∣E9KL44∣E9KL44_HUMAN | 0.00912 | 0.646 | Epididymis tissue sperm binding protein | 39 |
| tr∣B7Z6F8∣B7Z6F8_HUMAN | 0.00713 | 1.244 | Clathrin interactor 1 | 6 |
| tr∣A8K7A4∣A8K7A4_HUMAN | 0.00524 | 1.414 | cDNA FLJ76904, highly similar to Homo sapiens methionine adenosyltransferase II, beta (MAT2B) | 12 |
| tr∣F8WDI0∣F8WDI0_HUMAN | 0.00874 | 1.505 | Ubiquitin-like-conjugating enzyme ATG3 | 2 |
| tr∣B3KRT1∣B3KRT1_HUMAN | 0.00437 | 1.706 | Inositol-3-phosphate synthase 1 | 11 |
| tr∣Q6PK50∣Q6PK50_HUMAN | 0.0069 | 1.788 | HSP90AB1 protein | 65 |
| tr∣Q6NVC0∣Q6NVC0_HUMAN | 0.00315 | 1.80 | SLC25A5 protein | 37 |
| tr∣E5RH41∣E5RH41_HUMAN | 0.00169 | 1.848 | Transcription initiation factor IIE subunit beta | 1 |
| tr∣B4DYH1∣B4DYH1_HUMAN | 0.00023 | 1.878 | Heat shock 105 kDa/110 kDa protein 1, isoform CRA_b | 52 |
| tr∣E9PQI8∣E9PQI8_HUMAN | 0.00195 | 1.888 | U4/U6.U5 tri-snRNP-associated protein 1 | 3 |
| tr∣B5BTY7∣B5BTY7_HUMAN | 0.00798 | 1.966 | T-complex protein 1 subunit beta | 46 |
| tr∣B4DUG4∣B4DUG4_HUMAN | 0.00275 | 1.975 | cDNA FLJ51308 | 1 |
| tr∣B3KTJ9∣B3KTJ9_HUMAN | 0.00804 | 1.975 | cDNA FLJ38393 fis, clone FEBRA2007212 | 15 |
| tr∣D6R938∣D6R938_HUMAN | 0.00024 | 1.986 | Calcium/calmodulin-dependent protein kinase (CaM kinase) II delta | 2 |
| tr∣A8K259∣A8K259_HUMAN | 0.00046 | 2.070 | cDNA FLJ78501, highly similar to Homo sapiens serpin peptidase inhibitor, clade H (heat shock protein 47), member 1, (collagen binding protein 1) (SERPINH1) | 18 |
| tr∣Q54A51∣Q54A51_HUMAN | 0.00291 | 2.079 | Basigin (Ok blood group), isoform CRA_a | 20 |
| tr∣Q6IPH7∣Q6IPH7_HUMAN | 0.00287 | 2.131 | RPL14 protein | 19 |
| tr∣A8K9U6∣A8K9U6_HUMAN | 0.00504 | 2.132 | cDNA FLJ76121, highly similar to Homo sapiens zinc finger CCCH-type, antiviral 1 (ZC3HAV1) | 7 |
| tr∣D3DPU2∣D3DPU2_HUMAN | 0.00049 | 2.135 | Adenylyl cyclase-associated protein | 59 |
| tr∣B3KN49∣B3KN49_HUMAN | 0.00667 | 2.165 | cDNA FLJ13562 fis, clone PLACE1008080, highly similar to Homo sapiens hexamethylene bis-acetamide inducible 1 (HEXIM1) | 6 |
| tr∣E9PR70∣E9PR70_HUMAN | 0.0005 | 2.167 | Serpin H1 | 17 |
| tr∣Q05D43∣Q05D43_HUMAN | 0.00597 | 2.195 | YBX1 protein | 25 |
| tr∣E7EQV9∣E7EQV9_HUMAN | 0.00711 | 2.247 | Ribosomal protein L15 | 5 |
| tr∣A8K2Q6∣A8K2Q6_HUMAN | 0.00501 | 2.278 | Peptidyl-prolyl cis-trans isomerase | 3 |
| tr∣Q05CM9∣Q05CM9_HUMAN | 0.000005 | 2.287 | PSIP1 protein | 18 |
| tr∣Q7L7Q6∣Q7L7Q6_HUMAN | 0.00109 | 2.321 | RTN4 | 6 |
| tr∣Q5U077∣Q5U077_HUMAN | 0.00247 | 2.379 | L-lactate dehydrogenase | 38 |
| tr∣F5GZA8∣F5GZA8_HUMAN | 0.00582 | 2.384 | SH3 domain-binding protein 1 | 6 |
| tr∣E7EPK6∣E7EPK6_HUMAN | 0.00396 | 2.394 | 40S ribosomal protein S24 | 7 |
| tr∣Q8TBR3∣Q8TBR3_HUMAN | 0.00685 | 2.414 | Fusion (Involved in t(12;16) in malignant liposarcoma) | 33 |
| tr∣A8MX94∣A8MX94_HUMAN | 0.00964 | 2.475 | Glutathione S-transferase P | 50 |
| tr∣B4DUI3∣B4DUI3_HUMAN | 0.00619 | 2.484 | Eukaryotic translation initiation factor 3 subunit J | 10 |
| tr∣Q6P1N4∣Q6P1N4_HUMAN | 0.00019 | 2.492 | IQGAP1 protein | 64 |
| tr∣A4QPB0∣A4QPB0_HUMAN | 0.00019 | 2.492 | IQ motif containing GTPase activating protein 1 | 83 |
| tr∣B7ZBH1∣B7ZBH1_HUMAN | 0.00876 | 2.499 | Eukaryotic translation initiation factor 6 | 9 |
| tr∣B4DZI8∣B4DZI8_HUMAN | 0.00931 | 2.525 | Coatomer protein complex, subunit beta 2 | 8 |
| tr∣B4DWA0∣B4DWA0_HUMAN | 0.00454 | 2.535 | cDNA FLJ54188, moderately similar to High mobility group protein HMG-I/HMG-Y | 8 |
| tr∣B4DY28∣B4DY28_HUMAN | 0.0063 | 2.556 | cDNA FLJ61189, highly similar to Cysteine and glycine-rich protein 1 | 2 |
| tr∣B7Z921∣B7Z921_HUMAN | 0.00179 | 2.601 | cDNA FLJ61669, highly similar to Transcription elongation regulator 1 | 5 |
| tr∣Q8NF45∣Q8NF45_HUMAN | 0.00368 | 2.657 | FLJ00353 protein | 8 |
| tr∣F8WEE0∣F8WEE0_HUMAN | 0.00313 | 2.672 | Protein NDRG1 | 1 |
| tr∣E9PIM9∣E9PIM9_HUMAN | 0.00026 | 2.676 | Ribonuclease H1 | 24 |
| tr∣B4E2D3∣B4E2D3_HUMAN | 0.00154 | 2.685 | Nuclear pore complex protein Nup50 | 4 |
| tr∣Q6FI03∣Q6FI03_HUMAN | 0.00472 | 2.715 | G3BP protein | 27 |
| tr∣B7Z7L3∣B7Z7L3_HUMAN | 0.00077 | 2.752 | NADH-cytochrome b5 reductase 3 | 10 |
| tr∣B1AH89∣B1AH89_HUMAN | 0.00436 | 2.775 | Tubulin tyrosine ligase-like family, member 12 | 14 |
| tr∣Q6IBT3∣Q6IBT3_HUMAN | 0.00347 | 2.783 | CCT7 protein | 37 |
| tr∣Q53HV2∣Q53HV2_HUMAN | 0.00347 | 2.783 | Chaperonin containing TCP1, subunit 7 (Eta) variant | 45 |
| tr∣Q5W0H4∣Q5W0H4_HUMAN | 0.00403 | 2.793 | Tumor protein, translationally controlled 1 | 13 |
| tr∣B4DZX7∣B4DZX7_HUMAN | 0.00318 | 2.817 | Thioredoxin domain containing, isoform CRA_b | 1 |
| tr∣B3KRA1∣B3KRA1_HUMAN | 0.00016 | 2.844 | cDNA FLJ33914 fis, clone CTONG2016575, highly similar to SON PROTEIN | 3 |
| tr∣B7Z8R6∣B7Z8R6_HUMAN | 0.00049 | 2.846 | cDNA FLJ51445, highly similar to AMBP protein | 1 |
| tr∣Q6IAX2∣Q6IAX2_HUMAN | 0.0057 | 2.852 | RPL21 protein | 13 |
| tr∣B2R4F3∣B2R4F3_HUMAN | 0.00842 | 2.868 | cDNA, FLJ92068, highly similar to Homo sapiens Rho GDP dissociation inhibitor (GDI) beta (ARHGDIB) | 3 |
| tr∣D3DQ70∣D3DQ70_HUMAN | 0.00312 | 2.882 | SERPINE1 mRNA binding protein 1, isoform CRA_d | 15 |
| tr∣E7ERF4∣E7ERF4_HUMAN | 0.00326 | 2.973 | Adenylosuccinate lyase | 10 |
| tr∣B2RAU8∣B2RAU8_HUMAN | 0.00573 | 3.071 | cDNA, FLJ95131, highly similar to Homo sapiens nucleolar and coiled-body phosphoprotein 1 (NOLC1) | 11 |
| tr∣B4DIT0∣B4DIT0_HUMAN | 0.00069 | 3.098 | Anion exchange protein 2 | 2 |
| tr∣B5MCA4∣B5MCA4_HUMAN | 0.00511 | 3.111 | Epithelial cell adhesion molecule | 4 |
| tr∣Q6GMS8∣Q6GMS8_HUMAN | 0.00075 | 3.140 | Syntaxin-16 | 2 |
| tr∣B3KN82∣B3KN82_HUMAN | 0.00899 | 3.209 | cDNA FLJ13913 fis, clone Y79AA1000231, highly similar to Nucleolar protein NOP5 | 12 |
| tr∣B4E0L0∣B4E0L0_HUMAN | 0.00362 | 3.211 | cDNA FLJ54030, highly similar to Polymerase delta-interacting protein 3 | 9 |
| tr∣D3DSF7∣D3DSF7_HUMAN | 0.00302 | 3.236 | SON DNA binding protein, isoform CRA_b | 7 |
| tr∣F8VVL1∣F8VVL1_HUMAN | 0.00199 | 3.278 | Density-regulated protein | 6 |
| tr∣A8K787∣A8K787_HUMAN | 0.0069 | 3.285 | cDNA FLJ75273, highly similar to Homo sapiens solute carrier family 25 (mitochondrial carrier; adenine nucleotide translocator), member 4 | 17 |
| tr∣B4DSL9∣B4DSL9_HUMAN | 0.00403 | 3.297 | cDNA FLJ58748, highly similar to U3 small nucleolar RNA-associated protein 6homolog | 2 |
| tr∣B3KWL6∣B3KWL6_HUMAN | 0.00036 | 3.382 | Methionine aminopeptidase | 7 |
| tr∣B3KPR5∣B3KPR5_HUMAN | 0.00165 | 3.421 | cDNA FLJ32094 fis, clone OCBBF2000986, highly similar to Homo sapiens elongation factor Tu GTP binding domain containing 1, transcript variant 1 | 1 |
| tr∣Q14222∣Q14222_HUMAN | 0.00673 | 3.562 | EEF1A protein | 108 |
| tr∣Q16577∣Q16577_HUMAN | 0.00673 | 3.562 | Elongation factor 1-alpha | 143 |
| tr∣Q53H88∣Q53H88_HUMAN | 0.0034 | 3.579 | Dynactin 2 variant | 7 |
| tr∣Q59GP5∣Q59GP5_HUMAN | 0.00198 | 3.601 | Eukaryotic translation elongation factor 1 alpha 2 variant | 45 |
| tr∣Q68CS0∣Q68CS0_HUMAN | 0.00079 | 3.630 | Ornithine aminotransferase, mitochondrial | 7 |
| tr∣F5GXR3∣F5GXR3_HUMAN | 0.00387 | 3.972 | Parathymosin | 1 |
| tr∣F5H8L6∣F5H8L6_HUMAN | 0.00141 | 3.996 | Dipeptidyl peptidase 3 | 17 |
| tr∣Q6IPS9∣Q6IPS9_HUMAN | 0.00459 | 4.001 | Elongation factor 1-alpha | 311 |
| tr∣F8W940∣F8W940_HUMAN | 0.00537 | 4.120 | CUGBP Elav-like family member 1 | 3 |
| tr∣B7ZLC9∣B7ZLC9_HUMAN | 0.00416 | 4.234 | GEMIN5 protein | 3 |
| tr∣Q6FIG4∣Q6FIG4_HUMAN | 0.00017 | 4.372 | RAB1B protein | 19 |
| tr∣F5H4R6∣F5H4R6_HUMAN | 0.00067 | 4.373 | Nucleosome assembly protein 1-like 1 | 32 |
| tr∣Q6PK82∣Q6PK82_HUMAN | 0.00008 | 4.425 | AP3D1 protein | 5 |
| tr∣B3KW52∣B3KW52_HUMAN | 0.0073 | 4.443 | cDNA FLJ42145 fis, clone TESTI4000228, highly similar to Mus musculus ubiquitin family domain containing 1 (Ubfd1), mRNA | 2 |
| tr∣E9PS95∣E9PS95_HUMAN | 0.00885 | 4.636 | Mitochondrial glutamate carrier 1 | 1 |
| tr∣Q6FH57∣Q6FH57_HUMAN | 0.00045 | 4.653 | Peptidyl-prolyl cis-trans isomerase | 4 |
| tr∣B3KN79∣B3KN79_HUMAN | 0.00107 | 4.681 | cDNA FLJ13894 fis, clone THYRO1001671, highly similar to 59 kDa 2′-5′-oligoadenylate synthetase-like protein | 3 |
| tr∣Q53GW1∣Q53GW1_HUMAN | 0.00487 | 4.697 | Vesicle transport-related protein isoform a variant (Fragment) | 3 |
| tr∣Q5U0I6∣Q5U0I6_HUMAN | 0.00098 | 4.810 | RAB1A protein | 14 |
| tr∣Q5TBU5∣Q5TBU5_HUMAN | 0.00439 | 5.144 | Adipose specific 2 | 1 |
| tr∣E9PK25∣E9PK25_HUMAN | 0.000007 | 6.239 | Cofilin-1 | 96 |
| tr∣F8W7I9∣F8W7I9_HUMAN | 0.00003 | 6.928 | Ran GTPase-activating protein 1 | 15 |
| tr∣B3KU10∣B3KU10_HUMAN | 0.00049 | 7.509 | Interferon-induced GTP-binding protein Mx1 | 22 |
| tr∣Q75MY7∣Q75MY7_HUMAN | 0.0005 | 7.948 | MX2 | 11 |
| tr∣D2KFR9∣D2KFR9_HUMAN | 0.00057 | 8.090 | Signal transducer and activator of transcription 1-alpha/beta | 3 |
| tr∣E9PCQ3∣E9PCQ3_HUMAN | 0.00031 | 8.511 | Ubiquitin carboxyl-terminal hydrolase | 1 |
| tr∣B4DTE6∣B4DTE6_HUMAN | 0.0066 | 8.644 | cDNA FLJ56243, highly similar to Melanoma-associated antigen 4 | 6 |
| tr∣Q8IV97∣Q8IV97_HUMAN | 0.00356 | 10.882 | Solute carrier family 7 (Cationic amino acid transporter, y+ system), member 5 | 3 |
| tr∣Q96J85∣Q96J85_HUMAN | 0.00055 | 14.133 | C-Mpl binding protein | 1 |
| tr∣F5H667∣F5H667_HUMAN | 0.00003 | 16.263 | Aspartyl/asparaginyl beta-hydroxylase | 4 |
| tr∣A5GZA6∣A5GZA6_HUMAN | 0.000002 | 53.611 | Cysteine-rich with EGF-like domain protein 2 | 2 |
| tr∣B4DZM8∣B4DZM8_HUMAN | 0.00002 | 145.941 | 26S proteasome non-ATPase regulatory subunit 5 | 2 |
3.2. PSCA and EEF1α Expression in Different HPV+ and HPV− Head and Neck Cancer Cell Lines
To confirm our mass spectrometry results, we studied the expression of PSCA and EEF1α by immunocytochemistry in six head and neck cancer cell lines: 3 HPV+ cell lines (93VU-147T, UPCI-SCC90 and UPCI-SCC154) and 3 HPV− cell lines (FaDU, Detroit and UPCI-SCC131). The results of the immunofluorescence analysis of PSCA in all cell lines are presented in Figure 1. PSCA was mainly nuclear, but it was also distributed at a low level throughout the cytoplasm. PSCA was overexpressed in HPV+ cell lines compared to HPV− cell lines (Figures 1(a), 1(b), and 1(c)). These results are consistent with those obtained in our proteomic analysis.
Figure 1.
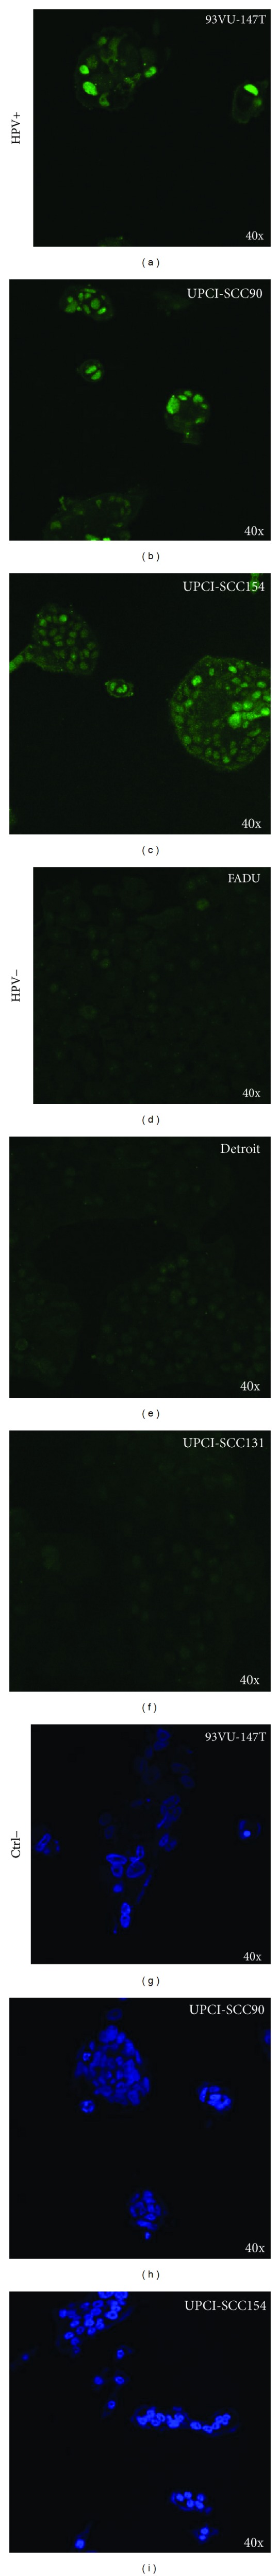
Immunofluorescence staining of PSCA in three HPV+ cell lines ((a), (b), and (c)) and three HPV− cell lines with control DAPI staining ((d), (e), and (f)). Alexa Fluor 488 labeling; confocal microscopy; exposure time of 27.59 s/frame; capture condition of 1600 pix/1600 pix and pixel time of 10.0 μs/pix.
Figure 2 illustrates the differential expression of EEF1α between HPV+ and HPV− cell lines. EEF1α was primarily nuclear, but it was also diffuse throughout the cytoplasm. We also noted a marked difference in the expression of this protein in both cell populations (HPV+ and HPV−). In fact, as expected, confocal microscopy examination of EEF1α revealed an increase in the intensity of the immunofluorescence signal in the HPV− cells (Figures 2(d), 2(e), and 2(f)) compared to the HPV+ cells, which showed weak expression of EEF1α (Figures 2(a), 2(b), and 2(c)). This observation was validated using western blotting to compare the EEF1α expression levels of the cell lines used in our proteomic analysis. In FaDU cell extracts, a band was detected at 50 kDa, which corresponds to the mass of the EEF1α protein (Figure 3). This band was not observed in the HPV+ cell lines. We used actin as a loading control, which was detected at 43 kDa in the extracts from all three cell lines (Figure 3). After several attempts, we were not able to validate PSCA expression by western blotting because the primary antibody was not suitable for this technique.
Figure 2.
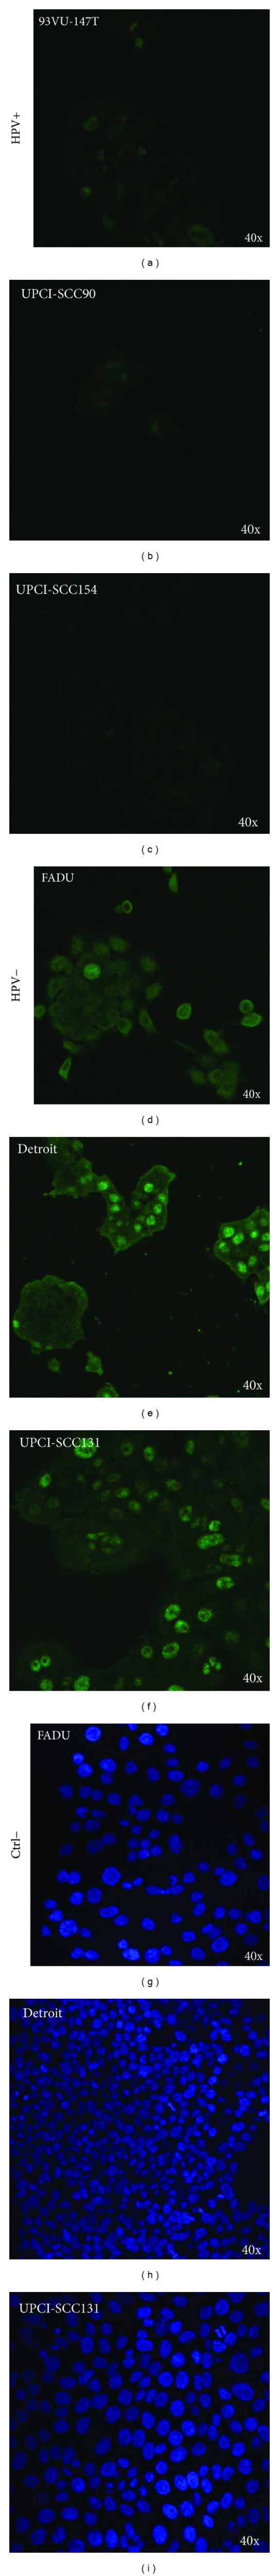
Immunofluorescence staining of EEF1α in three HPV+ cell lines with control DAPI staining ((a), (b), and (c)) and three HPV− cell lines ((d), (e), and (f)). Alexa Fluor 488 labeling; confocal microscopy; exposure time of 27.59 s/frame; capture condition of 1600 pix/1600 pix and pixel time of 10.0 μs/pix.
Figure 3.
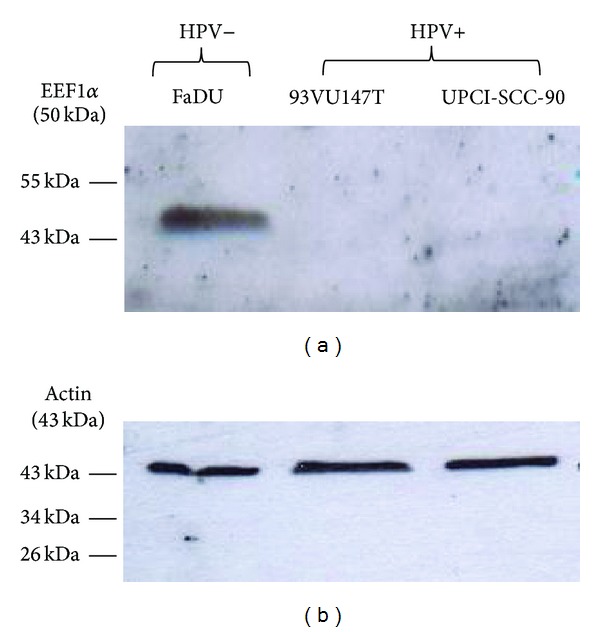
Western blot analysis demonstrating the upregulation of EEF1α in the HPV− cell line, FaDu.
3.3. PSCA Protein Expression in Surgical Specimens of OSCC
Among the 50 HPV+ cases, qRT-PCR targeting 18 HPV subtypes revealed that 100% of the cases were infected by HPV-16, with two coinfections, HPV-53 and HPV-39. After confirming our results in vitro, we evaluated PSCA expression in clinical series of oral cancer. Fifty HPV+ and fifty HPV− oral cancer specimens were examined by immunohistochemistry. As shown in Figure 4(d), PSCA immunostaining was strong in both the cytoplasm and nucleus (Figure 4(d)). To determine whether there was differential protein expression, we compared the two groups (HPV+ versus HPV−) using a nonparametric Mann-Whitney test (Figure 4(e)). PSCA was significantly upregulated in the HPV+ oral tumors compared to the HPV− oral tumors (P = 0.006) in terms of the labeling index (LI), which corresponds to the percentage of immunopositive cells.
Figure 4.
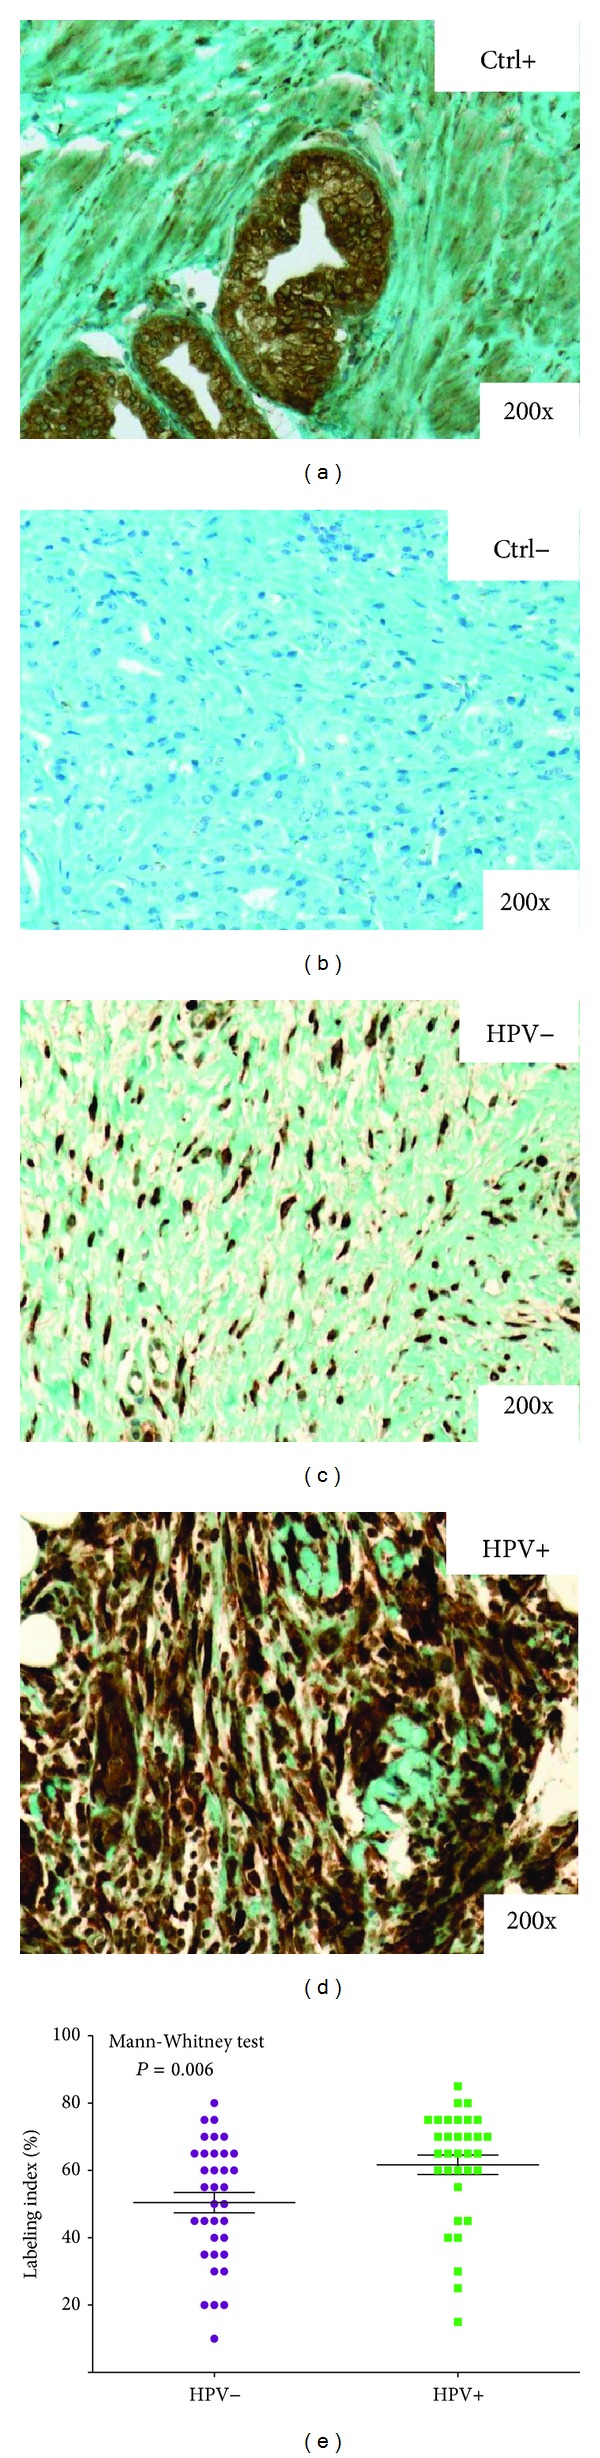
Typical immunohistochemical staining profile of PSCA in HPV− (c) and HPV+ (d) oral tumors. The graph represents the results of the Mann-Whitney test of the PSCA mean labeling index values in the 50 HPV+ and 50 HPV− tumors (e). Panels (a) and (b) show positive and negative controls for PSCA in oral tumors, respectively.
3.4. EEF1α Protein Expression in Surgical Specimens of OSCC
Figures 5(c) and 5(d) present the results of our immunohistochemical analysis of EEF1α expression in the same clinical series (50 HPV+ OSCCs versus 50 HPV− OSCCs). EEF1α was localized in both the nucleus and cytoplasm, but significantly stronger staining intensity was observed in the nucleus (Figure 5(d)). As expected, semiquantitative analysis demonstrated that EEF1α expression was increased in HPV− carcinomas compared to HPV+ carcinomas. Indeed, a statistically significant difference in terms of the mean intensity (MI) values between the HPV+ and HPV− tumors was calculated using a nonparametric Mann-Whitney test (P = 0.03) (Figure 5(e)).
Figure 5.
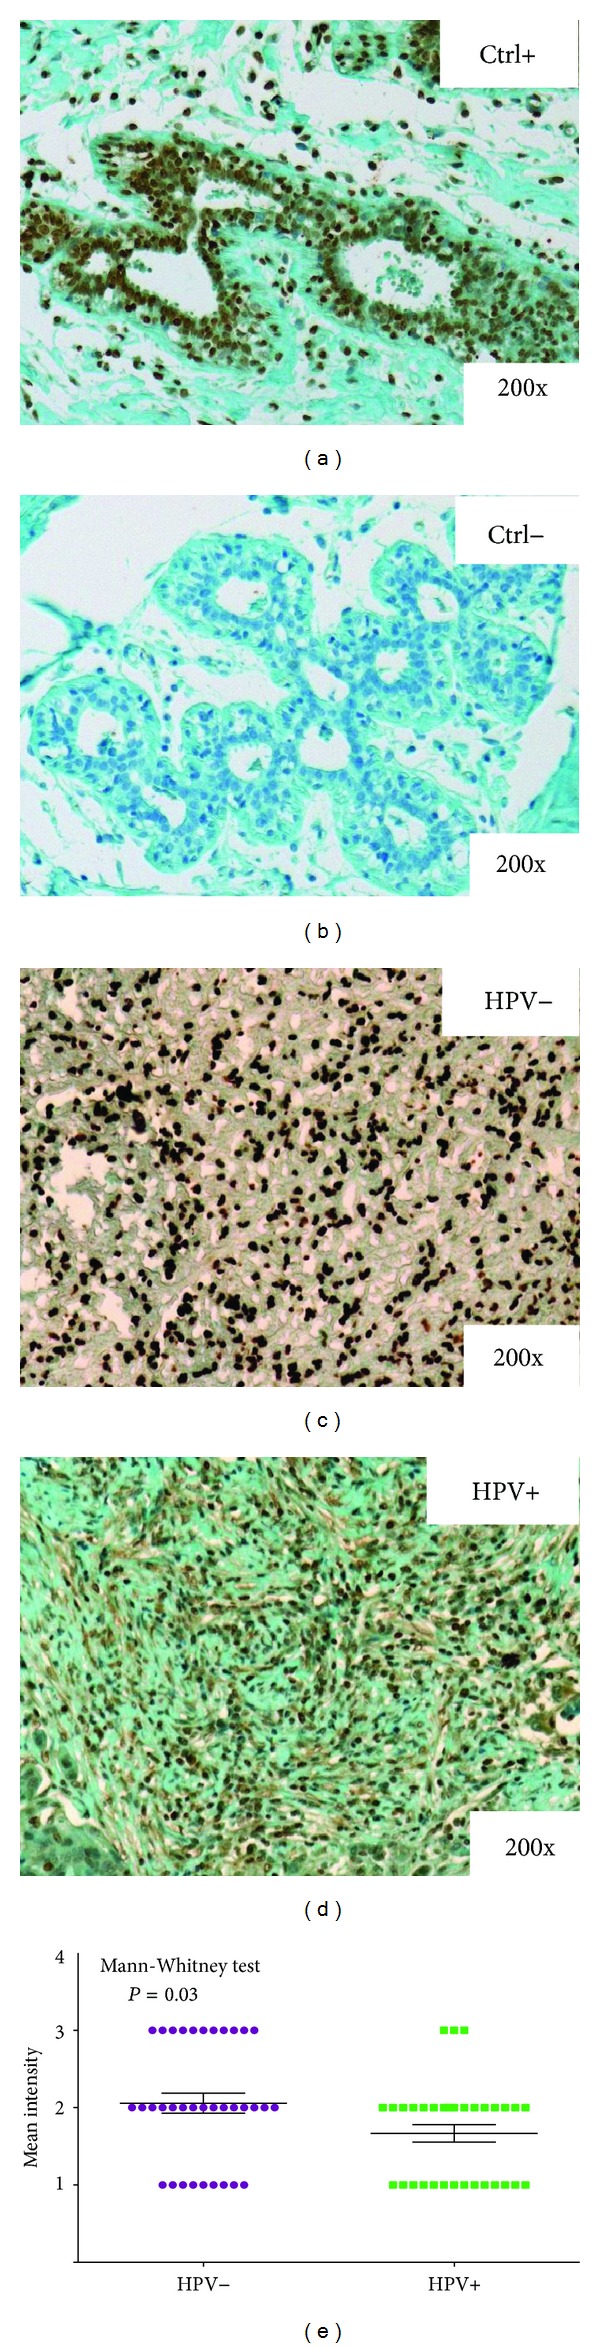
Typical immunohistochemical staining profile of EEF1α in HPV− (c) and HPV+ (d) oral tumors. The graph represents the results of the Mann-Whitney test of the EEF1α mean labeling index values in the 50 HPV+ and 50 HPV− tumors (e). (a) and (b) show positive and negative controls for EEF1α in oral tumors, respectively.
4. Discussion
Recent advances have been made in our understanding of the relationship between head and neck carcinogenesis and HPV. Strong evidence indicates that HPV+ HNSCC comprise a subclass of tumors with a different biology and different clinical properties and that affects specific demographic populations. HPV+ tumors occur in a younger age group, originate more frequently in the oropharynx, and have a lower T stage compared to HPV− tumors [15]. At the histopathological level, we distinguished distinct features of HPV+ tumors, including their identification as nonkeratinizing basal cells and their prominent “koilocytic” morphology [16]. Concerning overall survival, the majority of studies agree that HPV-infected patients have a better prognosis. HPV+ and HPV− tumors also exhibit differences in tumor biology, with HPV+ tumors having fewer p53 mutations and displaying reduced association with tobacco and alcohol consumption [17, 18]. These observations suggest that HPV+ HNSCC and HPV− HNSCC should be considered two distinct cancers with distinct biological pathways: one driven by environmental agents (tobacco and alcohol) and the other driven by infectious agents (high-risk HPV subtypes). However, these two pathologic agents may interact and act synergistically to promote the development of HNSCC.
Despite the progress made in the field of HPV-related HNSCC, a paucity of literature exists with respect to studies investigating the biology of HPV infection in head and neck carcinogenesis. Disease predictors are important from both the clinical and molecular perspectives. Current HNSCC treatments are frequently associated with adverse side effects, and 50% of HNSCC patients die within two years of their initial diagnosis because two-thirds of patients have advanced cancer (stage III or IV) at diagnosis [19, 20]. Therefore, novel approaches are needed to aid clinicians by providing them relevant predictive candidates for the disease to improve patient management. Beyond the clinical challenges, understanding the molecular mechanisms underlying this disease is crucial for developing targeted therapies and individualizing treatment based on the biology of the tumor. In this context, we investigated the global protein expression of three head and neck cancer cell lines, two HPV+ and one HPV−. First, we compared the two populations to identify differences in their proteomic patterns and, consequently, potential candidates of HPV infection. Second, we validated the selected proteins using a clinical series of 100 oral SCC samples (50 HPV+ and 50 HPV−).
Over the past decade, technological advances have been made in the field of proteomics, leading to the identification of specific proteins that are differentially expressed in tumor and control specimens. Mass spectrometry is undoubtedly the most powerful technology for proteomics. The most current mass spectrometers present high resolving power and mass accuracy, allowing for the detection and quantification of thousands of proteins. Thus, clinical proteomics is a powerful diagnostic and prognostic technology. However, advances in the proteomics field have resulted in publications describing numerous potential cancer markers that must be clinically validated prior to the development of a diagnostic test.
In our study, we used liquid chromatography coupled to electrospray ionization tandem mass spectrometry to analyze tryptic peptides from three cell lines (2 HPV+ and 1 HPV−). This technology allowed us to identify and quantify 2221 proteins, among which 155 were differentially expressed between the HPV− and HPV+ cells with significant P values of <0.01. The strength of our study lies in the clinical validation of our potential candidates. Indeed, there is a limitation in using cultured cells rather than clinical specimens, as the proteomes of cells grown in vitro may not accurately reflect those of in vivo cancer cells. However, if the selected protein candidates are further investigated by immunohistochemistry (IHC) using patient tissue samples, the proteomic analysis of cultured cells is entirely valid for the identification of putative candidates. Ye et al. identified 40 differentially expressed proteins between three paired oral SCC cell lines with different metastatic potentials. They were able to confirm their results by IHC and, consequently, identified superoxide dismutase 2 (SOD2) as a predictive marker for the diagnosis of metastasis [21].
Similarly, we validated several of the differentially expressed proteins between the HPV− and HPV+ populations in our study using three different methods. Immunocytochemistry and western blotting confirmed our mass spectrometry results, and IHC also demonstrated those statistically significant differences in 50 HPV+ and 50 HPV− oral SCC specimens. In fact, HPV+ oral carcinomas overexpressed prostate stem cell antigen (PSCA) compared to HPV− oral carcinomas. PSCA was discovered fifteen years ago. It is a glycosylphosphatidylinositol (GPI)-anchored cell surface protein belonging to the Thy-1/Ly-6 family [22]. PSCA was initially identified in prostate cancer but is also expressed in epithelial cells of various organs, such as the bladder, kidney, skin, esophagus, stomach, placenta, and lung [23–26]. Little is known about its physiological functions and signaling cascade, but recently, it was defined as a “Jekyll and Hyde” molecule due to its expression pattern. PSCA seems to act as an oncogene in some cancers, such as prostate, bladder, renal and ovarian carcinomas, and as a tumor suppressor in others, including esophageal and gastric cancer [27]. To date, only one study reported decreased PSCA expression (100-fold) in HNSCC [25].
PSCA seems to be involved in cell growth regulation and to play some roles in signal transduction. Other members of the Ly-6 superfamily are involved in cell adhesion, cell migration, and the regulation of T lymphocyte regulation [28–30]. PSCA overexpression in prostate cancer is related to c-myc amplification [24]. In addition, siRNA-mediated knockdown of PSCA significantly reduces lung cancer cell growth [26]. The same observation was recently made in human prostate cancer cells [31]. Moreover, PSCA is downregulated in gallbladder, esophagus, and stomach tumors [23, 32], as well as our HPV− HNC cell line (FaDU). Therefore, it would be interesting to further validate and explore the clinical implications of PSCA.
Our second candidate protein, EEF1α, was overexpressed in the HPV− cell line. EEF1α is a GTP-binding protein that interacts with aminoacyl-tRNA to recruit and deliver it to the A site of the ribosome during the elongation phase of protein translation. In addition to its role in protein translation, EEF1α is involved in cell migration, cell morphology, protein synthesis, actin cytoskeleton organization, and the modulation of apoptosis sensitivity [33, 34]. Due to its overexpression in many cancers, such as ovarian, breast, lung, and liver cancer, EEF1α has been defined as a putative oncogene [35]. This protein is of particular interest because a previous study reported that its downregulation in prostate cancer cells inhibits cell proliferation, invasion, and migration [36]. In contrast, increased EEF1α expression is associated with increased cell proliferation, oncogenic transformation, and delayed cell senescence [37–39]. EEF1 also interacts with Akt to modulate its activity and regulate proliferation, survival, and motility in breast cancer cells [40]. Several authors reported that increased expression of this elongation factor is associated with tumorigenesis by enhancing the translation of genes promoting cell growth [38, 41].
To date, no clinical studies have demonstrated the involvement of PSCA or EEF1α in head and neck carcinogenesis caused by viral infection, and their functions remain to be elucidated. This study will aid in our understanding of the mechanisms used by HPV to promote the development of head and neck cancers. In conclusion, PSCA and EEF1 meet several criteria, suggesting that they are involved in the biology of HPV-related HNSCC; however, further studies should be conducted to confirm our observations in a larger clinical series. Moreover, it will be interesting to perform functional experiments to understand the signaling pathways disrupted by HPV infection. By silencing several proteins, we plan to study the impact of gene extinction on cell proliferation, migration, invasion, and apoptosis to better understand the mechanisms used by HPV to drive carcinogenesis.
Acknowledgments
This work was partially financed by the FNRS under Grant “grand equipment” (no. 2877824). Géraldine Descamps is Ph.D. student who is supported by a Grant from the FNRS (Bourse Télévie).
Conflict of Interests
The authors declare that there is no conflict of interests regarding the publication of this paper.
References
- 1.Filleul O, Preillon J, Crompot E, Lechien J, Saussez S. Incidence of head and neck cancers in Belgium: comparison with worldwide and French data. Bulletin du Cancer. 2011;98(10):1173–1183. [PubMed] [Google Scholar]
- 2.Ankola AA, Smith RV, Burk RD, Prystowsky MB, Sarta C, Schlecht NF. Comorbidity, human papillomavirus infection and head and neck cancer survival in an ethnically diverse population. Oral Oncology. 2013;49(9):911–917. doi: 10.1016/j.oraloncology.2013.07.001. [DOI] [PMC free article] [PubMed] [Google Scholar]
- 3.Ragin CCR, Taioli E. Survival of squamous cell carcinoma of the head and neck in relation to human papillomavirus infection: review and meta-analysis. International Journal of Cancer. 2007;121(8):1813–1820. doi: 10.1002/ijc.22851. [DOI] [PubMed] [Google Scholar]
- 4.Duray A, Descamps G, Decaestecker C, et al. Human papillomavirus DNA strongly correlates with a poorer prognosis in oral cavity carcinoma. Laryngoscope. 2012;122(7):1558–1565. doi: 10.1002/lary.23298. [DOI] [PubMed] [Google Scholar]
- 5.Hansson BG, Rosenquist K, Antonsson A, et al. Strong association between infection with human papillomavirus and oral and oropharyngeal squamous cell carcinoma: a population-based case-control study in southern Sweden. Acta Oto-Laryngologica. 2005;125(12):1337–1344. doi: 10.1080/00016480510043945. [DOI] [PubMed] [Google Scholar]
- 6.Rosenquist K, Wennerberg J, Annertz K, et al. Recurrence in patients with oral and oropharyngeal squamous cell carcinoma: human papillomavirus and other risk factors. Acta Oto-Laryngologica. 2007;127(9):980–987. doi: 10.1080/00016480601110162. [DOI] [PubMed] [Google Scholar]
- 7.Morshed K. Association between human papillomavirus infection and laryngeal squamous cell carcinoma. Journal of Medical Virology. 2010;82(6):1017–1023. doi: 10.1002/jmv.21749. [DOI] [PubMed] [Google Scholar]
- 8.Ernoux-Neufcoeur P, Arafa M, Decaestecker C, et al. Combined analysis of HPV DNA, p16, p21 and p53 to predict prognosis in patients with stage IV hypopharyngeal carcinoma. Journal of Cancer Research and Clinical Oncology. 2011;137(1):173–181. doi: 10.1007/s00432-010-0871-2. [DOI] [PMC free article] [PubMed] [Google Scholar]
- 9.Duray A, Descamps G, Arafa M, et al. High incidence of high-risk HPV in benign and malignant lesions of the larynx. International Journal of Oncology. 2011;39(1):51–59. doi: 10.3892/ijo.2011.1031. [DOI] [PubMed] [Google Scholar]
- 10.Gillison ML, Koch WM, Capone RB, et al. Evidence for a causal association between human papillomavirus and a subset of head and neck cancers. Journal of the National Cancer Institute. 2000;92(9):709–720. doi: 10.1093/jnci/92.9.709. [DOI] [PubMed] [Google Scholar]
- 11.Hafkamp HC, Manni JJ, Haesevoets A, et al. Marked differences in survival rate between smokers and nonsmokers with HPV 16-associated tonsillar carcinomas. International Journal of Cancer. 2008;122(12):2656–2664. doi: 10.1002/ijc.23458. [DOI] [PubMed] [Google Scholar]
- 12.Lo WY, Lai CC, Hua CH, et al. S100A8 is identified as a biomarker of HPV18-infected oral squamous cell carcinomas by suppression subtraction hybridization, clinical proteomics analysis, and immunohistochemistry staining. Journal of Proteome Research. 2007;6(6):2143–2151. doi: 10.1021/pr060551+. [DOI] [PubMed] [Google Scholar]
- 13.Ott HW, Lindner H, Sarg B, et al. Calgranulins in cystic fluid and serum from patients with ovarian carcinomas. Cancer Research. 2003;63(21):7507–7514. [PubMed] [Google Scholar]
- 14.Melle C, Ernst G, Winkler R, et al. Proteomic analysis of human papillomavirus-related oral squamous cell carcinoma: identification of thioredoxin and epidermal-fatty acid binding protein as upregulated protein markers in microdissected tumor tissue. Proteomics. 2009;9(8):2193–2201. doi: 10.1002/pmic.200800882. [DOI] [PubMed] [Google Scholar]
- 15.Marur S, Forastiere AA. Head and neck cancer: changing epidemiology, diagnosis, and treatment. Mayo Clinic Proceedings. 2008;83(4):489–501. doi: 10.4065/83.4.489. [DOI] [PubMed] [Google Scholar]
- 16.Koch WM. Clinical features of HPV-related head and neck squamous cell carcinoma: presentation and work-up. Otolaryngologic Clinics of North America. 2012;45(4):779–793. doi: 10.1016/j.otc.2012.04.004. [DOI] [PubMed] [Google Scholar]
- 17.Westra WH, Taube JM, Poeta ML, Begum S, Sidransky D, Koch WM. Inverse relationship between human papillomavirus-16 infection and disruptive p53 gene mutations in squamous cell carcinoma of the head and neck. Clinical Cancer Research. 2008;15(2):366–369. doi: 10.1158/1078-0432.CCR-07-1402. [DOI] [PubMed] [Google Scholar]
- 18.Chung CH, Gillison ML. Human papillomavirus in head and neck cancer: its role in pathogenesis and clinical implications. Clinical Cancer Research. 2009;15(22):6758–6762. doi: 10.1158/1078-0432.CCR-09-0784. [DOI] [PubMed] [Google Scholar]
- 19.Bernier J, Domenge C, Ozsahin M, et al. Postoperative irradiation with or without concomitant chemotherapy for locally advanced head and neck cancer. The New England Journal of Medicine. 2004;350(19):1945–1952. doi: 10.1056/NEJMoa032641. [DOI] [PubMed] [Google Scholar]
- 20.Lang K, Menzin J, Earle CC, Jacobson J, Hsu MA. The economic cost of squamous cell cancer of the head and neck: findings from linked SEER-medicare data. Archives of Otolaryngology, Head & Neck Surgery. 2004;130(11):1269–1275. doi: 10.1001/archotol.130.11.1269. [DOI] [PubMed] [Google Scholar]
- 21.Ye H, Wang A, Lee BS, et al. Proteomic based identification of manganese superoxide dismutase 2 (SOD2) as a metastasis marker for oral squamous cell carcinoma. Cancer Genomics and Proteomics. 2008;5(2):85–94. [PMC free article] [PubMed] [Google Scholar]
- 22.Reiter RE, Gu Z, Watabe T, et al. Prostate stem cell antigen: a cell surface marker overexpressed in prostate cancer. Proceedings of the National Academy of Sciences of the United States of America. 1998;95(4):1735–1740. doi: 10.1073/pnas.95.4.1735. [DOI] [PMC free article] [PubMed] [Google Scholar]
- 23.Bahrenberg G, Brauers A, Joost HG, Jakse G. Reduced expression of PSCA, a member of the LY-6 family of cell surface antigens, in bladder, esophagus, and stomach tumors. Biochemical and Biophysical Research Communications. 2000;275(3):783–788. doi: 10.1006/bbrc.2000.3393. [DOI] [PubMed] [Google Scholar]
- 24.Gu Z, Thomas G, Yamashiro J, et al. Prostate stem cell antigen (PSCA) expression increases with high gleason score, advanced stage and bone metastasis in prostate cancer. Oncogene. 2000;19(10):1288–1296. doi: 10.1038/sj.onc.1203426. [DOI] [PubMed] [Google Scholar]
- 25.de Nooij-van Dalen AG, van Dongen GA, Smeets SJ, et al. Characterization of the human Ly-6 antigens, the newly annotated member Ly-6K included, as molecular markers for head-and-neck squamous cell carcinoma. International Journal of Cancer. 2003;103(6):768–774. doi: 10.1002/ijc.10903. [DOI] [PubMed] [Google Scholar]
- 26.Kawaguchi T, Sho M, Tojo T, et al. Clinical significance of prostate stem cell antigen expression in non-small cell lung cancer. Japanese Journal of Clinical Oncology. 2010;40(4):319–326. doi: 10.1093/jjco/hyp181. [DOI] [PubMed] [Google Scholar]
- 27.Saeki N, Gu J, Yoshida T, Wu X. Prostate stem cell antigen: a Jekyll and Hyde molecule? Clinical Cancer Research. 2010;16(14):3533–3538. doi: 10.1158/1078-0432.CCR-09-3169. [DOI] [PMC free article] [PubMed] [Google Scholar]
- 28.Stroncek DF, Caruccio L, Bettinotti M. CD177: a member of the Ly-6 gene superfamily involved with neutrophil proliferation and polycythemia vera. Journal of Translational Medicine. 2004;2(1, article 8) doi: 10.1186/1479-5876-2-8. [DOI] [PMC free article] [PubMed] [Google Scholar]
- 29.Hänninen A, Jaakkola I, Salmi M, Simell O, Jalkanen S. Ly-6C regulates endothelial adhesion and homing of CD8+ T cells by activating integrin-dependent adhesion pathways. Proceedings of the National Academy of Sciences of the United States of America. 1997;94(13):6898–6903. doi: 10.1073/pnas.94.13.6898. [DOI] [PMC free article] [PubMed] [Google Scholar]
- 30.Lee SK, Su B, Maher SE, Bothwell ALM. Ly-6A is required for T cell receptor expression and protein tyrosine kinase fyn activity. The EMBO Journal. 1994;13(9):2167–2176. doi: 10.1002/j.1460-2075.1994.tb06493.x. [DOI] [PMC free article] [PubMed] [Google Scholar]
- 31.Zhao Z, Ma W, Zeng G, Qi D, Ou L, Liang Y. Small interference RNA-mediated silencing of prostate stem cell antigen attenuates growth, reduces migration and invasion of human prostate cancer PC-3M cells. Urologic Oncology. 2013;31(3):343–351. doi: 10.1016/j.urolonc.2011.02.004. [DOI] [PubMed] [Google Scholar]
- 32.Ono H, Hiraoka N, Lee YS, et al. Prostate stem cell antigen, a presumable organ-dependent tumor suppressor gene, is down-regulated in gallbladder carcinogenesis. Genes Chromosomes and Cancer. 2012;51(1):30–41. doi: 10.1002/gcc.20928. [DOI] [PubMed] [Google Scholar]
- 33.Gross SR, Kinzy TG. Translation elongation factor 1A is essential for regulation of the actin cytoskeleton and cell morphology. Nature Structural and Molecular Biology. 2005;12(9):772–778. doi: 10.1038/nsmb979. [DOI] [PubMed] [Google Scholar]
- 34.Duttaroy A, Bourbeau D, Wang XL, Wang E. Apoptosis rate can be accelerated or decelerated by overexpression or reduction of the level of elongation factor-1α . Experimental Cell Research. 1998;238(1):168–176. doi: 10.1006/excr.1997.3819. [DOI] [PubMed] [Google Scholar]
- 35.van Goietsenoven G, Hutton J, Becker JP, et al. Targeting of eEF1A with Amaryllidaceae isocarbostyrils as a strategy to combat melanomas. The FASEB Journal. 2010;24(11):4575–4584. doi: 10.1096/fj.10-162263. [DOI] [PMC free article] [PubMed] [Google Scholar]
- 36.Zhu G, Yan W, He HC, et al. Inhibition of proliferation, invasion, and migration of prostate cancer cells by downregulating elongation factor-1α expression. Molecular Medicine. 2009;15(11-12):363–370. doi: 10.2119/molmed.2009.00082. [DOI] [PMC free article] [PubMed] [Google Scholar]
- 37.Edmonds BT, Wyckoff J, Yeung Y-G, et al. Elongation factor-1α is an overexpressed actin binding protein in metastatic rat mammary adenocarcinoma. Journal of Cell Science. 1996;109(11):2705–2714. doi: 10.1242/jcs.109.11.2705. [DOI] [PubMed] [Google Scholar]
- 38.Anand N, Murthy S, Amann G, et al. Protein elongation factor EEF1A2 is a putative oncogene in ovarian cancer. Nature Genetics. 2002;31(3):301–305. doi: 10.1038/ng904. [DOI] [PubMed] [Google Scholar]
- 39.Edmonds BT, Murray J, Condeelis J. pH regulation of the F-actin binding properties of Dictyostelium elongation factor 1α . The Journal of Biological Chemistry. 1995;270(25):15222–15230. doi: 10.1074/jbc.270.25.15222. [DOI] [PubMed] [Google Scholar]
- 40.Pecorari L, Marin O, Silvestri C, et al. Elongation factor 1 alpha interacts with phospho-Akt in breast cancer cells and regulates their proliferation, survival and motility. Molecular Cancer. 2009;8(1, article 58) doi: 10.1186/1476-4598-8-58. [DOI] [PMC free article] [PubMed] [Google Scholar]
- 41.Sonenberg N. Translation factors as effectors of cell growth and tumorigenesis. Current Opinion in Cell Biology. 1993;5(6):955–960. doi: 10.1016/0955-0674(93)90076-3. [DOI] [PubMed] [Google Scholar]