

Abstract
The ability to volitionally regulate emotions is critical to health and well-being. While patterns of neural activation during emotion regulation have been well characterized, patterns of connectivity between regions remain less explored. It is increasingly recognized that the human brain is organized into large-scale intrinsic connectivity networks (ICNs) whose interrelationships are altered in characteristic ways during psychological tasks. In this fMRI study of 54 healthy individuals, we investigated alterations in connectivity within and between ICNs produced by the emotion regulation strategy of reappraisal. In order to gain a comprehensive picture of connectivity changes, we utilized connectomic psychophysiological interactions (PPI), a whole-brain generalization of standard single-seed PPI methods. In particular, we quantified PPI connectivity pair-wise across 837 ROIs placed throughout the cortex. We found that compared to maintaining one’s emotional responses, engaging in reappraisal produced robust and distributed alterations in functional connections involving visual, dorsal attention, frontoparietal, and default networks. Visual network in particular increased connectivity with multiple ICNs including dorsal attention and default networks. We interpret these findings in terms of the role of these networks in mediating critical constituent processes in emotion regulation, including visual processing, stimulus salience, attention control, and interpretation and contextualization of stimuli. Our results add a new network perspective to our understanding of the neural underpinnings of emotion regulation, and highlight that connectomic methods can play a valuable role in comprehensively investigating modulation of connectivity across task conditions.
Introduction
The ability to volitionally regulate emotion contributes to behavioral flexibility and well-being, while deficits in this capacity are linked to maladjustment and psychopathology (Gross and Thompson, 2007). Given its importance in health and disease, more than 50 studies have examined the neural mechanisms of emotion regulation with functional magnetic resonance imaging (fMRI). These studies demonstrate that emotion regulation involves increased activity in cortical regions associated with cognitive and attention control such as dorsomedial prefrontal cortex (PFC), lateral PFC, and superior parietal regions, and produces diminished activation in emotion production regions such as the amygdala (see Ochsner and Gross, 2005; Ochsner et al., 2012; Phan and Sripada, 2013 for reviews). Though patterns of activation during emotion regulation have been well characterized, patterns of connectivity between regions remain less explored.
The issue of connectivity alterations during emotion regulation is particularly intriguing in light of increasingly influential network models of neural architecture. The human brain appears to be organized into large-scale intrinsic connectivity networks (ICNs) (Fox et al., 2005; Menon, 2011). These are distributed regions that exhibit coherent activity during rest and tasks (Greicius et al., 2003; Smith et al., 2009) and are associated with specific neurocognitive functions (Laird et al., 2011). Alterations in the relationships between ICNs during tasks are thought to reflect adjustments in network-mediated information-processing (Bressler and Menon, 2010), and are predictive of task performance (Fransson, 2006). While the ICN perspective has primarily been applied to studies of the unperturbed resting state, a growing body of research investigates network alterations produced by psychological tasks (Harrison et al., 2008; Spreng et al., 2010; Fornito et al., 2012; Kinnison et al., 2012).
In social affective neuroscience, challenges have emerged for “faculty approaches” that seek to localize particular emotions and emotion regulatory capacities in discrete brain regions (Lindquist et al., 2012; Barrett and Satpute, 2013). A new “network-based approach” (Barrett and Satpute, 2013; Kinnison et al., 2012) instead investigates affective phenomena from a distributed systems perspective. In this framework, emotions are conceptualized as mental events that emerge from integration within and between large-scale networks. Recent studies have uncovered altered network interrelationships due to social affective phenomena such as emotion states (Eryilmaz et al., 2011; Barrett and Satpute, 2013), moods (Harrison et al., 2008), and empathy (Raz et al., 2013). Applying a network-based perspective to understanding emotion regulation, it is plausible that this capacity implicates a number of constituent processes associated with large scale ICNs. These include visual processing (visual network; Yeo et al., 2011), voluntary control of visual attention (dorsal attention network; Corbetta and Shulman, 2002), working memory and goal-directed attention (frontoparietal network; Seeley et al., 2007), and assigning personal meanings to stimuli (default network; Gusnard et al., 2001; Buckner et al., 2008). These observations raise the hypothesis that these implicated ICNs alter their relationships, and in particular, become more interconnected, during voluntary regulation of emotion, reflecting greater integration of information across these constituent processes.
In this fMRI study of 54 healthy individuals, we investigated alterations in connectivity within and between large-scale networks produced by reappraisal, an important voluntary emotion regulation strategy. Previous studies of connectivity during emotion regulation have used seed-based methods, and examined a single or small number of seeds (Urry et al., 2006; Banks et al., 2007; Wager et al., 2008). These methods have clarified links between subcortical nodes, especially amygdala and striatum, and prefrontal regions implicated in regulation. They are less useful, however, for identifying altered relationships across large-scale ICNs. Thus in order to gain a comprehensive picture of large-scale network changes produced by emotion regulation, we utilized connectomic psychophysiological interactions (PPI), a whole-brain generalization of standard single-seed PPI methods (Friston et al., 1997; McLaren et al., 2012). We quantify PPI connectivity pair-wise across 837 ROIs placed throughout the cortex. We utilize network contingency analysis, a statistical method that identifies connectivity changes across pairs of networks. We demonstrate that voluntary regulation of emotion produces robust and distributed alterations in interconnections between multiple networks implicated in current theoretical models of emotion regulation.
Methods
Subjects
All subjects provided informed consent for the study protocol, as approved by the University of Michigan Institutional Review Board. Of 54 participants who entered the study, two did not complete the task, one had incomplete fMRI data due to scanner problems, and two had excessive head movement during scanning (>3mm movement). Thus 49 participants contributed to the present analysis (age mean and sd: 23.63±1.30, range: 20–27, males=26). All subjects had no MRI contraindications (e.g., metallic/ferrous materials in their body), no prior or current treatment for any psychiatric disorder (clinician-conducted psychiatric evaluation based on the Structured Clinical Interview for DSM-IV), and no history of neurological injury.
Participants for this study were recruited as part of an fMRI study of the long-term neural effects of childhood poverty. At the time of scanning, 15% of subjects were below the U.S. Census Bureau-defined poverty line, which is similar to a representative sample of U.S. residents. At age 9, roughly half of the participants were from households below the U.S. Census Bureau-defined poverty line, and the other half were from non-poverty backgrounds. See Evans (2003) for further details on subject recruitment and protocols. In the present study, our primary interest was in the effects of emotion regulation on network connectivity, rather than effects of childhood poverty. We included covariates controlling for the effects of current income and childhood poverty in all analyses.
Task
We used an Emotion Regulation Task (ERT) validated in previous fMRI studies (Phan et al., 2005; Banks et al., 2007). The task involved three conditions. During the Maintain and Reappraise conditions, participants were presented with aversive pictures from the International Affective Picture System (IAPS; Bradley and Lang, 2007). During the Maintain condition, participants were instructed to attend to and experience naturally (without trying to change or alter) the emotional state elicited by the pictures. During the Reappraisal condition, participants were instructed to voluntarily decrease the intensity of their negative affect by using the cognitive strategy of reappraisal (Gross, 1999). In particular, participants were asked to use one of two strategies: 1) transforming the depicted scenario into less negative or positive terms (e.g., people crying outside the church are leaving a wedding and the tears are joyful); and 2) rationalizing or objectifying the content of the pictures (e.g. an abused woman is an actress in a movie between scenes). During a pre-scanning session, participants practiced these reappraisal strategies by talking through the process out loud with practice stimuli (separate from the stimuli shown in the scanning session). Experimenters assisted participants by correcting their technique or suggesting alternative reappraisals. Participants were instructed not to look away or distract themselves with irrelevant thoughts. Participants practiced until they could reliably and rapidly generate appropriate reappraisals of stimuli, and understanding of the task was confirmed by reviewing examples of subject-generated strategies. There was also a third condition, the Neutral Look condition, in which participants were presented with neutral IAPS pictures and instructed to simply look at them. This condition provided a control condition for an additional hypothesis, unrelated to the aims of the current report, of the effects of childhood poverty on neural responses to aversive pictures. Of note, we chose to study reappraisal because it is an important emotion regulation strategy (Gross, 1999), has been shown to produce beneficial psychological and physiological changes (Gross, 1998), and has been validated in fMRI in multiple prior studies (Ochsner et al., 2002; Phan et al., 2005; see Ochsner et al., 2012; Phan and Sripada, 2013 for reviews).
The fMRI task was structured in terms of a block-related design in which subjects viewed 20 second blocks of aversive or neutral pictures. Each picture was presented continuously for 5 seconds without an interstimulus interval. Prior to each block of pictures, the instruction to ‘Look’, ‘Maintain’ or ‘Reappraise’ appeared at the center of a black screen for a duration of 5 s (Instruction). Immediately following each Neutral Look, Maintain or Reappraisal block, a blank screen with a rating scale appeared for 5 s asking participants to rate the intensity of their negative affect on a 5-point scale (1=least negative/neutral, 5=extremely negative) via button response (Rating). The Look/Maintain/Reappraise blocks were interspersed with 20 second baseline blocks consisting of a fixation cross to minimize carryover effects (‘Baseline’), and to allow the blood oxygen-level dependent (BOLD) signal to return to baseline. During this period, participants were asked to stop maintaining or reappraising their emotional experience and to relax. The total task duration was 10 minutes spread across 2 runs.
The stimulus set consisted of 32 highly aversive and arousing pictures and 16 neutral pictures based on normative IAPS ratings (Bradley and Lang, 2007). The mean and standard deviation for the valence and arousal values for the aversive pictures on a 9-point scale were 2.60±0.63 and 5.72±0.62, respectively and for the neutral pictures were 5.59±0.89 and 3.67±0.78 (1=most unpleasant/least arousing, 9=most pleasant/most arousing) based on normative ratings (Lang et al., 1993). The aversive pictures elicit both evaluation and experience of negative affect (Lang et al., 1993) and generally depict complex scenes of burn victims, funeral scenes, people crying, and dead animals. Of note, the aversive pictures selected for Reappraise and Maintain conditions were matched for general content, including faces and figures and were balanced on subjective valence (t(30)=0.46, p>0.05) and arousal (t(30)=0.57, p>0.05).
FMRI Scanning and Preprocessing
MRI scanning occurred on a Philips 3.0 Tesla Achieva X-series MRI (Best, The Netherlands). We obtained 300 functional volumes with a T2*-weighted, echoplanar acquisition sequence [GRE; repetition time, 2000 ms; echo time, 25ms; flip angle, 90°; field of view, 22cm; 42 slice; thickness/skip, 3.0/0mm; matrix size equivalent to 64×64].
A standard series of processing steps was performed using statistical parametric mapping (SPM8; www.fil.ion.ucl.ac.uk/spm). After discarding four images at the beginning of each fMRI run to account for magnetic equilibrium, scans were reconstructed, slice-time corrected (sequential ascending, reference slice=21), realigned to the first scan in the experiment to correct for head motion, spatially normalized to a functional template, resampled to 2×2×2 mm voxels, and spatially smoothed using a Gaussian filter with a full-width half-maximum value of 8mm.
FRMI Analysis
Psychophysiological Interaction Analysis (PPI)
PPI analysis (Friston et al., 1997) is a validated and widely used method that assesses whether functional connectivity between brain regions differs across task conditions, after controlling for the effect of task on the BOLD response. More specifically we used the Generalized PPI method developed by McLaren and colleagues, as this method has been shown to improve sensitivity and specificity (McLaren et al., 2012). Standard PPI creates an interaction regressor (the multiplication of a task regressor and the deconvolved BOLD time series from the seed) in order to identify brain regions that exhibit task-modulated connectivity with the seed. Generalized PPI in contrast produces a connectivity map separately for each task condition. These condition-specific connectivity maps are then subtracted to investigate differences in connectivity across conditions.
Connectomic PPI and Network Contingency Analysis
PPI is typically deployed as a seed-based method; PPI connectivity is calculated between a single ROI seed and every voxel in the brain. Univariate statistics are then used to assess statistical significance, typically with voxel-wise multiple comparison correction. We were interested in comprehensively characterizing connectivity changes across all seven major ICNs. The method implemented here, connectomic PPI with network contingency analysis, has several advantages for this purpose. First, this method comprehensively characterizes connectivity across the entire brain without potentially arbitrary choices of seed regions. Second, this method leverages a priori information about network structure to directly assess questions about internetwork connectivity. Third, it avoids univariate tests across the hundreds of thousands of connections of the connectome, instead conducting a single contingency test (which assesses whether the number of suprathreshold edges exceeds the number expected by chance) for each network pair investigated. Fourth, it uses permutation tests, a non-parametric test that is robust to deviations from assumptions of normality and independence.
Connectomic PPI
In order to use PPI as a whole-brain connectomic method, we placed 3mm radius ROIs (encompassing 19 2mm3 voxels) in a regular, 3-dimensional grid spaced at 12mm intervals throughout the brain. This density of ROI placement balances comprehensive coverage with computational feasibility. Performing PPI on 50,000+ seed voxels (followed by permutation tests for statistical significance) is not computationally feasible, and by placing seeds every 12mm, we effectively down sampled the data. Given our 8mm smoothing kernel, this density of sampling also ensured that information from the entirety of brain was comprehensively sampled. Of note, our placement of seed ROIs densely throughout the brain introduces redundancy as closely spaced seed ROIs will yield highly similar PPI maps, which in turn raises concern about needless multiple comparisons. However, the network contingency statistic we introduce below obviates this issue, as the number of comparisons is based on the number of ICNs investigated (i.e., 7), rather than the number of seed ROIs.
Since our main interest was the cortical ICNs, we then removed all ROIs from the grid that fell more than 5mm (Euclidean distance) from the Yeo and colleagues (2011) ICN parcellation of the brain, yielding 837 ROIs in total. We chose the Yeo and colleagues network map because their study was based on a large number of subjects (1000 participants), they included multiple convergent methods to assess reliability, and their parcellation was derived using grid-based connectomic methods similar to the current study (Yeo et al., 2011). We calculated PPI connectivity using the generalized PPI routine implemented in SPM8, modifying the routine to calculate PPI between a seed ROI and a set of other ROIs, rather than every voxel in the brain. For each ROI, we calculated generalized PPI connectivity between this ROI seed and the 836 remaining ROIs. This process was repeated with each ROI serving as seed once. We refer to the connection between each pair of ROIs as an “edge”. The interpretation of connectivity at each edge is identical in connectomic PPI as in standard single-seed PPI—the chief difference being that connectomic PPI places seeds throughout the brain while standard PPI places seeds at a single or a small number of regions.
Because PPI is based on multiple regression, PPI coefficients need not be identical when the seed region (ROI1) and target region (ROI2) are reversed, i.e., when ROI2 is used as the seed and ROI1 is used as the target. This contrasts with correlation analysis in which the correlation between ROI1 and ROI2 is the same as between ROI2 and ROI1. Thus while a correlation-based adjacency matrix derived from n ROIs has (n2−n)/2 unique edges (the diagonal is excluded as it represents connectivity between a seed and itself), the PPI-based adjacency matrix with n ROIs has n2 − n edges. More specifically, in the present analysis that used 837 ROIs, each condition-specific connectome has 699,732 edges.
Five conditions were modeled in the PPI analysis: Neutral Look, Maintain, and Reappraise blocks, as well as Instruction and Rating periods. Since our main interest was in the connectivity changes associated with voluntary regulation of emotion, we were primarily interested in the condition-specific connectomes associated with the Reappraise condition and the Maintain condition, which serves as its control. We also generated the condition-specific connectome for the Neutral Look condition in order to investigate a specific post-hoc hypothesis about the visual cortex (see below).
Network Contingency Analysis
Our main aim was to determine whether and where patterns of connectivity, as represented in the Reappraise and Maintain condition-specific connectomes, significantly differed. Several analytic approaches are available to address this question. We avoided a mass univariate approach in which statistical inference is performed separately for each edge of the connectome, as the multiple comparison correction required for performing 699,732 statistical tests was deemed excessive. We instead performed a network contingency analysis, which performs one statistical test on each pair of networks studied. More specifically, the analysis addresses the question of whether for each set of edges linking two large-scale networks, the population of condition-modulated edges is larger than one would expect by chance. This analysis is composed of the following steps (see Figure 1).
Figure 1. Steps of the Network Contingency Analysis.
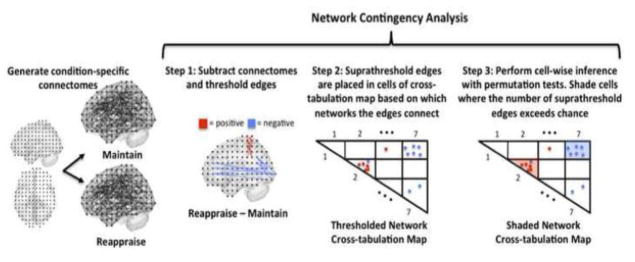
All possible interconnections between seven major intrinsic connectivity networks are represented in 28 (non-redundant) cells of a network cross-tabulation map. The network contingency analysis assesses whether the number of suprathreshold condition-modulated edges within each cell is greater than would be expected by chance. Each step of the analysis is discussed in greater detail in the main text.
Step 1. Subtraction and Thresholding
We subtracted the Maintain connectome from the Reappraise connectome, producing a Reappraise – Maintain delta connectome, and we thresholded this delta connectome based on statistical significance. For each edge, we fit the following multiple regression model:
where yi is the magnitude of the PPI connectivity difference in Reappraise minus Maintain at edge i; X1 and X2 are two poverty covariates: age nine income to needs ratio and current income to needs ratio; β1 and β2 are estimated betas; b is an intercept term that represents the mean effect of the Reappraise condition over and above the Maintain baseline; and ε is a mean zero error term. Note that the model without the poverty covariates (i.e., the ‘intercept only’ model) is formally identical to a paired-sample t-test, and thus the above regression model effectively performs a paired-sample t-test that controls for the effects of poverty.
Based on statistical significance of the intercept term, i.e., mean effect of condition, we thresholded the Reappraise-Maintain connectome at p<0.001 (the rationale for this threshold is discussed below).
Step 2. Organize edges based on network affiliation
Next, we organized the suprathreshold edges of the Reappraise-Maintain delta connectome in terms of network affiliation. We utilized the network map of Yeo and colleagues (2011) discussed above which parcellates the brain into seven major networks. These seven networks were used to generate a cross-tabulation map with 28 (non-redundant) cells (Figure 1). Each cell represents the set of edges linking two networks; cells along the diagonal represent edges originating and terminating in the same network, while off diagonal cells represent edges originating in one network and terminating in another. Each of the suprathreshold edges in the Reappraise-Maintain delta map was assigned to one of these 28 cells based on its origination and termination.
For visualization purposes, we placed a dot in the cross-tabulation map to represent suprathreshold edges. Since PPI is based on regression, the PPI coefficient when ROI1 is the seed and ROI2 is the target need not be the same as the coefficient when ROI2 is the seed and ROI1 is the target. Thus for each connection linking two ROIs, we placed a dot at the appropriate position in the map if either of the two directional connections (or both) was present. Suprathreshold edges that became more positive in Reappraise (>Maintain) were shown as red dots, while suprathreshold edges that that became more negative in Reappraise (>Maintain) were shown as blue dots. In addition, in extremely rare cases in which both directions of an edge survived thresholding but their signs disagreed (one edge was more positive in Reappraise while the other was more negative in Reappraise) we colored the dots yellow.
Step 3. Cell-wise contingency analysis
We tested the hypothesis that the number of observed edges in a cell of the thresholded network cross-tabulation map exceeds the number that would be expected by chance alone. The details of this analysis are as follows: First we selected a cell in the network cross-tabulation map and counted the number of suprathreshold edges in the cell (‘Nobserved’). Next we compared Nobserved to the number of suprathreshold edges that would be expected by chance under the null hypothesis that there is no effect of the condition manipulation. To calculate this null distribution, we utilized a permutation test, a non-parametric test that is robust to deviations from independence assumptions of parametric tests such as Bernoulli or chi-square tests (Good, 2000).
In performing the permutation test, relabeled data was generated by randomly selecting subjects and switching their condition labels (i.e., ‘Reappraise’ and ‘Maintain’). Steps 1 through 2 above were then performed with this relabeled data. This was repeated 10,000 times and Nobserved was calculated at each iteration, yielding a distribution of Nobserved values. The p value of the actual Nobserved value was calculated as the number of Nobserved values in the permutation distribution that exceeded the actual value divided by 10,000. Since the permutation test is performed for a multiple regression model that includes covariates (see step 1), the procedure of Freedman and Lane (1983) was followed. In brief, a multiple regression model is first estimated with covariates alone, residuals are formed and are permuted. The covariate effect is then added back in, creating an approximate realization of data under the null hypothesis, and the statistical test of interest is calculated on this data (see FSL Randomise http://fsl.fmrib.ox.ac.uk/fsl/fslwiki/Randomise/Theory for a neuroimaging implementation).
We performed a cell-wise contingency analysis separately for each cell of the thresholded network cross-tabulation map and corrected for multiple comparisons with the false discovery correction procedure (FDR; Benjamini and Hochberg, 1995). Cells that survived FDR correction were next shaded. Since we were also interested in the directionality of changes, the cell was shaded more red as the proportion of suprathreshold cells that exhibit positive change approaches one and more blue as this number approaches zero (predominantly negative changes).
In step 1 of the network contingency analysis, we set the p value threshold (‘pthreshold’) to be 0.001, consistent with prior studies (e.g., Di Martino et al., 2013). To test the robustness of the analysis under different threshold values, we performed the Reappraise vs. Maintain network contingency analysis with pthreshold set to {0.0001, 0.0005, 0.001, 0.005, 0.01, 0.05, 0.1}. Each of these pthreshold values yielded a p value map (one p value for each of the 28 cells that make up the map). We then generated a weighted mean of these p values across the thresholds by calculating a normalized area under the curve. In doing this calculation, the pthreshold values were first z-transformed so that the distance between pthreshold values was well scaled. This procedure yielded a single weighted mean p value map. We then performed FDR correction for multiple comparisons on these values and compared the results to those resulting from the analysis with pthreshold set at 0.001.
In order to clarify location, distribution, and lateralization of implicated edges, we generated three-dimensional visualizations of the statistically significant cells from step 4. All suprathreshold edges in these cells were rendered on a three-dimensional canonical brain using connectomic visualization tools implemented in BrainNet Viewer, http://www.nitrc.org/projects/bnv/ (Xia et al., 2013). Finally, in the Supplement, we present the PPI connectivity values of each suprathreshold edge in Maintain and Reappraise in graphical (Figure S1) and table form (Table S1).
Effect of Childhood Poverty
Our primary interest was in the effects of emotion regulation on network connectivity, but for completeness, we did model and examine effects of childhood poverty on network connectivity during emotion regulation. In particular, we modeled participants’ income-to-needs ration at age 9 (mean 1.87±1.11) as well as current income-to-needs ratio (mean 3.23±2.96) as covariates. These two poverty covariates were included in the multiple regression model in step 1 of the network contingency analysis discussed above. In order to determine whether childhood poverty predicts differences in connectivity during Reappraise versus Maintain, we performed an additional network contingency analysis on the childhood poverty regressor. There were no significant cells of the network cross-tabulation map suggesting that age nine poverty does not predict network interrelationships during emotion regulation at adulthood.
Seed-based Connectivity Analysis
Seed-based methods have been used in previous studies to examine connectivity during emotion regulation, and have uncovered connectivity changes at subcortical structures including amygdala and ventral striatum. CPPI methods are especially well suited to examining connectivity differences at cortical ICNs, but have less ability to detect connectivity changes at small subcortical structures. In order to complement the cortical ICN findings from cPPI, we conducted additional seed-based PPI analyses. In particular, we used the same generalized PPI procedure described above for specific seeds: left and right amygdala, and left and right ventral striatum. The amygdala seeds consisted of anatomical masks derived from the Automated Anatomical Labeling (AAL) parcellation system (Tzourio-Mazoyer et al., 2002). The ventral striatal seeds were 5mm radius spheres placed at the peak coordinates (MNI −10, 14, −14) reported in a previous study that identified connectivity changes in striatum during emotion regulation (Wager et al., 2008). Only the left striatal ROI was identified in that study, but we included the corresponding right-sided ROI as well. Finally, because default network, an important ICN, is often investigated in seed-based studies with a posterior cingulate cortex (PCC) seed, we included a seed consisting of a 5mm radius sphere centered at a peak coordinate (MNI 0, −53, 26) reported in a previous study (Van Dijk et al., 2010).
For each seed, first-level PPI maps from the Reappraise and Maintain conditions were entered into an SPM8 random effects model and subtracted using paired sample t-tests, with age nine income-to-needs and current income-to-needs included as covariates. We thresholded the second-level activation maps at p<0.001 uncorrected to match the connectivity threshold (i.e., pthreshold) used in our main cPPI analysis.
Activation Analysis
In order to compare patterns of functional connectivity during emotion regulation with patterns of brain activation, we also performed a standard activation analysis. In first-level analysis, we modeled Neutral, Look, Maintain, and Reappraise blocks, as well as Instruction and Rating periods, and linear contrasts compared activation in the Reappraisal condition with the Maintain condition. First-level maps were entered into an SPM8 random effects model with paired sample t-tests, with age nine income-toneeds and current income-to-needs included as covariates and thresholding set at p<0.001.
Results
Behavioral Results
Ratings of affective state were significantly lower in the Reappraise condition (M=2.45±0.92) compared to the Maintain condition [M=2.95±0.83; t(48)= −4.62, p < .001], suggesting that the emotion regulation manipulation produced its intended effect of reducing negative affect in response to aversive pictures. As expected, ratings of affect during the Neutral Look condition during which participants looked at neutral pictures were significantly lower than the Maintain or Reappraise condition (M=1.17±0.34, Maintain: t(48)= 14.36, Reappraise: t(48)=11.34, both ps < .001).
FMRI Results
Using network contingency analysis, we compared the Reappraise versus Maintain PPI connectomes. We found reappraisal produced statistically significant effects in six cells, where each cell represents the set of connections linking two networks: 1) visual-visual, q<0.001, FDR-corrected; 2) visual-dorsal attention, q<0.01, FDR-corrected; 3) visual-frontoparietal, q<0.05, FDR-corrected; 4) visual-default, q<0.05, FDR-corrected; 5) dorsal attention-dorsal attention, q<0.05, FDR-corrected; and 6) dorsal attention-default (q<0.05, FDR-corrected; see Figure 2). In all six of these network pairs (shaded in Figure 2), there was a preponderance of edges exhibiting a positive change in connectivity reflecting greater connectivity during Reappraise compared to Maintain (Table 1).
Figure 2. Reappraise - Maintain Network Cross-tabulation Map.

A network contingency analysis was used to compare the Reappraise and Maintain condition-specific connectomes. Interconnections between seven major intrinsic connectivity networks (derived from the parcellation of Yeo and colleagues 2011) are represented on the map; each of the 28 cells in the map represents the set of connections linking two networks. Cells that are shaded have significantly more edges modulated by the task conditions than would be expected by chance (FDR-corrected, q<0.05). The map indicates that Reappraisal enhances connectivity between the following networks: visual-visual, visual-dorsal attention, visual-frontoparietal, visual-default, dorsal attention-dorsal attention, and dorsal attention-default.
Table 1. Descriptive statistics for Reappraise-Maintain.
In the six statistically significant cells of the network cross-tabulation map (see Figure 2), reappraisal preponderantly increased internetwork connectivity compared to the maintaining one’s emotional response without regulation.
| Network 1- Network 2 | number of suprathreshold edges | % of suprathreshold edges that are greater in Reappraise vs. Maintain |
|---|---|---|
| Visual-Visual | 354 | 67 |
| Visual-Dorsal Attention | 198 | 71 |
| Visual-Frontoparietal | 186 | 96 |
| Visual-Default | 330 | 92 |
| Dorsal Attention-Dorsal Attention | 51 | 94 |
| Dorsal Attention-Default | 145 | 89 |
To assess the robustness of this analysis, we performed network contingency analyses using p value thresholds ranging from 0.0001 to 0.1, taking the normalized AUC of the results across analyses (see Methods for details). We found that the same six cells of the network cross-tabulation map shown in Figure 2 were statistically significant, though the default network-dorsal attention cell was trend-level significant (q=.10, FDR-corrected). Moreover, no other cells other than these six were statistically significant, suggesting the analysis is indeed robust across p value thresholds.
For each of the six statistically significant cells shown in Figure 2, we produced three-dimensional visualizations of the suprathreshold edges in these cells (Figure 3). These visualizations allow more detailed appreciation of localization, distribution, and lateralization of edges. For example, it can be seen in Figure 3 that visual network connections with default network involved diffuse regions of the default network, encompassing prefrontal, posterior midline, bilateral inferior parietal, and lateral temporal regions. Additionally, prominent right lateralization of ICN connections with visual cortex was observed in two networks: frontoparietal network and default network. In both networks, the ratio of connections linking the right sides of the respective networks to visual network (compared to the left sides of the networks with visual network) was significantly skewed in favor of right sided connections (right frontoparietal-visual = 136, left frontoparietal-visual = 55, Bernoulli test p<0.001; right default-visual = 226, left default-visual = 109, Bernoulli test p<0.001). In the Supplement, we comprehensively present the PPI connectivity values of each suprathreshold edge in Maintain and Reappraise in graphical (Figure S1) and table form (Table S1).
Figure 3. Network Interconnections Modulated by Volitional Emotion Regulation.

The network contingency analysis of the Reappraise - Maintain connectomes found six sets of network-to-network connections that were significantly modulated by the task conditions. These six sets of network-to-network connections were rendered separately on sagittal and superior views of a canonical brain.
Our findings of increased connectivity within visual network in the Reappraise versus Maintain condition is intriguing in light of recent findings that suggest that greater intra-visual connectivity is inversely related to salience of visual stimuli (Sripada et al., 2013; see Discussion). This suggests emotion regulation was successful in that aversive stimuli were less attended to or less salient in the Reappraise condition compared to the Maintain condition. To provide an additional test of the hypothesis that presentation of more salient visual stimuli is associated with diminished intra-visual connectivity, we performed an addition network contingency analysis on the Neutral Look versus Maintain condition-specific connectomes, focusing specifically on intra-visual connections. We predicted higher intra-visual connectivity during the Neutral Look condition in which participants are presented with less salient neutral pictures compared to the Maintain condition in which participants are presented with more salient aversive pictures. Results confirmed this hypothesis, as intra-visual connectivity was markedly different in the Neutral Look versus Maintain conditions (network contingency analysis cell-wise p value for visual network-visual network connections: p<0.001), with the vast majority of edges (97%) increased in the Neutral Look condition (Figure 4).
Figure 4. Neutral Look - Maintain In Visual Network.
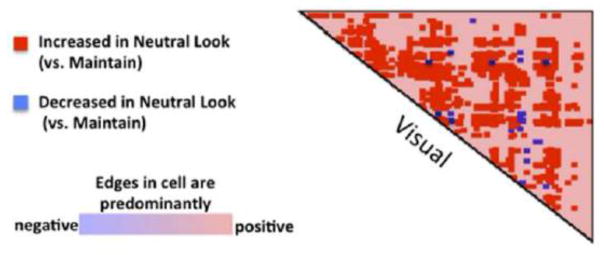
In order to test the hypothesis that reduced stimulus salience enhances intra-visual network connectivity, we performed an additional network contingency analysis restricted to visual cortex on the condition-specific connectomes for the Neutral Look condition (in which subjects looked at neutral pictures) versus the Maintain condition (in which subjects looked at more salient aversive pictures). As predicted, we observed more intra-visual edges modulated by task than expected by chance (FDR-corrected, q<0.001), with the vast majority of edges (97%) increased in the Neutral Look condition.
Seed-based Connectivity Analysis
In the Reappraise versus Maintain condition, we observed enhanced connectivity between seeds in right amygdala and right ventral striatum with a region spanning anterior cingulate cortex and nearby dorsomedial PFC. These two regions, along with left ventral striatum, also exhibited enhanced connectivity with lateral prefrontal regions including inferior frontal gyrus (see Figure 5 and Table 2).
Figure 5. Seed-based PPI Results Reappraise – Maintain.
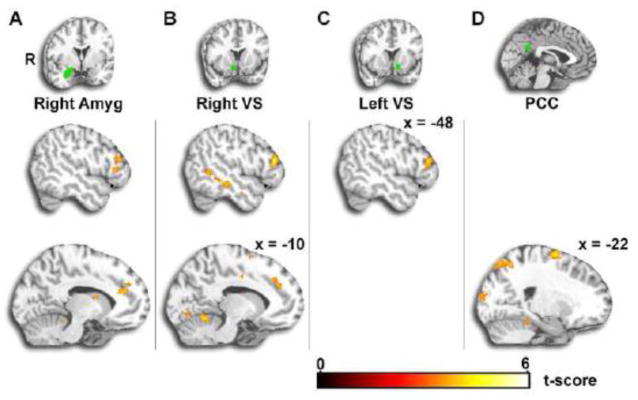
A–C. Seed-based psychophysiological interaction (PPI) analysis was conducted in the Reappraise versus Maintain conditions with four subcortical seeds implicated in previous studies of emotion regulation: right and left amygdala and right and left ventral striatum. During Reappraise (>Maintain), right amygdala and right ventral striatum exhibited increased connectivity with anterior cingulate/dorsomedial prefrontal cortex. Right amygdala and bilateral striatum exhibited increased connectivity with lateral prefrontal cortex. D. We investigated default network connectivity with a PCC seed in order to compare with connectomic PPI results. Results showed increased PCC connectivity during Reappraise (>Maintain) in superior parietal cortex and posterior occipital cortex. Amyg=Amygdala; VS=Ventral Striatum; PCC=Posterior Cingulate Cortex.
Table 2. Seed PPI Results for Reappraise versus Maintain.
Results from whole-brain voxelwise analysis of seed-based PPI connectivity differences in Reappraise versus Maintain conditions. All results are presented at P(uncorrected) < 0.001 with a minimum cluster size of 25 voxels.
| Seed Region | Region | MNI Coordinates | Volume (mm3) | T(46) | ||
|---|---|---|---|---|---|---|
| x | y | z | ||||
| Right Amygdala (Reappraise > Maintain) | Cerebellum | −4 | −42 | −18 | 1128 | 4.57 |
| ACC | −10 | 38 | 20 | 968 | 4.54 | |
| 8 | 38 | 22 | 352 | 4.12 | ||
| Precuneus | 12 | −64 | 54 | 336 | 4.24 | |
| IFG | −46 | 30 | 4 | 928 | 4.22 | |
| Putamen | −20 | 8 | −6 | 264 | 3.94 | |
| Thalamus | −12 | 4 | 14 | 984 | 3.84 | |
| Caudate | 14 | 12 | −2 | 400 | 3.84 | |
| Sup Parietal Gyrus | −30 | −66 | 52 | 424 | 3.84 | |
| Fusiform Gyrus | −28 | −42 | −22 | 344 | 3.72 | |
| Sup Frontal Gyrus | 0 | 30 | 44 | 280 | 3.60 | |
|
| ||||||
| Left Ventral Striatum (Reappraise > Maintain) | IFG | 56 | 22 | −10 | 888 | 5.20 |
| −48 | 36 | 16 | 672 | 4.15 | ||
| Lingual Gyrus | −26 | −54 | −6 | 304 | 4.28 | |
| Sup Frontal Gyrus | 12 | 30 | 54 | 424 | 4.18 | |
| 20 | 32 | 40 | 712 | 3.98 | ||
| Mid Temporal Gyrus | −52 | −24 | −8 | 488 | 3.79 | |
|
| ||||||
| Right Ventral Striatum (Reappraise > Maintain) | Mid Frontal Gyrus | 26 | 32 | 40 | 1672 | 5.46 |
| 34 | 10 | 42 | 264 | 4.03 | ||
| IFG | −52 | 34 | 12 | 1336 | 4.72 | |
| −30 | 24 | −28 | 312 | 4.23 | ||
| 52 | 24 | −10 | 472 | 4.17 | ||
| 32 | 26 | −28 | 232 | 3.70 | ||
| Cerebellum | 6 | −48 | −18 | 2992 | 4.69 | |
| Mid Cingulate | −6 | −6 | 38 | 1800 | 4.46 | |
| Sup Frontal Gyrus | −12 | 42 | 30 | 792 | 4.25 | |
| Mid Temporal Gyrus | −52 | −50 | 2 | 1672 | 4.15 | |
| 60 | −38 | −14 | 320 | 4.14 | ||
| Lingual Gyrus | −6 | −78 | −10 | 904 | 4.00 | |
| Caudate | 16 | 2 | 16 | 240 | 3.95 | |
| Precuneus | 16 | −68 | 60 | 208 | 3.66 | |
|
| ||||||
| PCC (Reappraise > Maintain) | Sup Frontal Gyrus | −22 | 4 | 68 | 2504 | 5.29 |
| 22 | −4 | 68 | 984 | 4.59 | ||
| Sup Frontal Gyrus (orbital) | −18 | 58 | −4 | 1696 | 4.71 | |
| Sup Parietal Gyrus | 16 | −58 | 48 | 4304 | 4.55 | |
| Precuneus | −10 | −58 | 62 | 3488 | 4.54 | |
| Fusiform Gyrus | 30 | −38 | −16 | 1088 | 4.41 | |
| Mid Frontal Gyrus | 38 | 36 | 40 | 712 | 4.38 | |
| −34 | 44 | 6 | 432 | 4.36 | ||
| −22 | 34 | 48 | 1024 | 4.26 | ||
| 48 | 42 | 6 | 240 | 3.80 | ||
| Mid Frontal Gyrus (orbital) | 28 | 54 | −10 | 288 | 3.89 | |
| Mid Occipital Gyrus | −10 | −104 | 8 | 1752 | 4.30 | |
| Parahippocampal Gyrus | −24 | −16 | −26 | 536 | 4.26 | |
| Mid Cingulate | 4 | −26 | 48 | 408 | 4.14 | |
| Mid Temporal Gyrus | −60 | −14 | −4 | 232 | 4.10 | |
| 64 | −20 | −10 | 224 | 3.83 | ||
| Sup Occipital Gyrus | 14 | −96 | 2 | 4144 | 4.08 | |
Activation Results
In the Reappraise versus Maintain contrast, we observed activation in dorsolateral and dorsomedial PFC, superior parietal cortex, caudate/putamen and superior temporal sulcus/temporal pole regions. There was reduced activation in middle and posterior insula extending to rolandic operculum (see Figure 6 and Table 3).
Figure 6. Whole-Brain Activation Results Reappraise – Maintain.
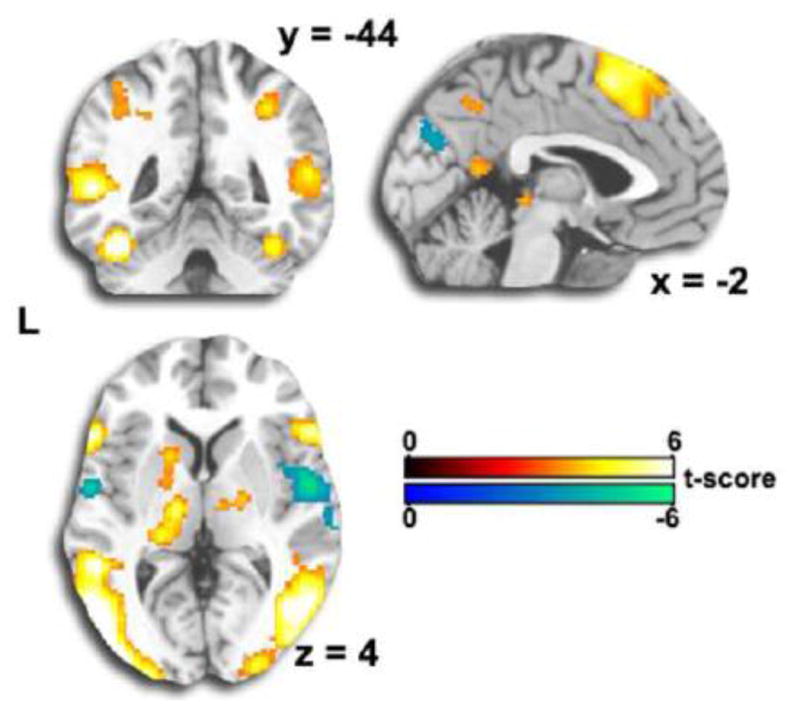
Consistent with previous studies, volitional emotion regulation produced greater activation in control regions in prefrontal, superior parietal, and temporal pole regions. Activation was reduced in posterior insula extending to rolandic operculum, regions associated with emotion and negative affect.
Table 3. Activation Results for Reappraise versus Maintain.
Results from whole-brain voxelwise analysis of neural activation differences in Reappraise versus Maintain conditions. All results are presented at P(uncorrected) < 0.001 with a minimum cluster size of 25 voxels.
| Contrast | Region | MNI Coordinates | Volume (mm3) | T(46) | ||
|---|---|---|---|---|---|---|
| x | y | z | ||||
| Reappraise > Maintain | Mid Occipital/Mid Temporal | −48 | −70 | 8 | 56088 | 10.13 |
| 52 | −66 | 12 | 39728 | 8.47 | ||
| Bilateral IFG/Mid Frontal/dlPFC | 54 | 24 | 28 | 66440 | 7.58 | |
| Thalamus | −12 | −16 | 0 | 10352 | 5.68 | |
| 20 | −10 | 2 | 1392 | 4.11 | ||
| Sup Parietal Gyrus | 26 | −66 | 56 | 8432 | 5.18 | |
| Mid Temporal Gyrus | −52 | −2 | −24 | 480 | 4.60 | |
|
| ||||||
| Maintain > Reappraise | Insula | 54 | −2 | 0 | 8096 | 5.40 |
| −56 | −4 | 2 | 1152 | 4.67 | ||
| −38 | 4 | 12 | 264 | 4.12 | ||
| Cuneus | −6 | −76 | 28 | 2928 | 5.01 | |
Discussion
In this study, we examined functional connectivity changes produced during reappraisal, an important volitional emotion regulation strategy. In order to gain a comprehensive picture of connectivity alterations across the entire brain, we used connectomic psychophysiological interaction analysis, quantifying PPI connectivity pair-wise across 837 ROIs placed throughout the cortex. We found that voluntary regulation of emotion produces robust and distributed alterations in functional connections involving visual, dorsal attention, frontoparietal, and default networks. These networks are in turn implicated in a number of critical constituent processes in emotion regulation, including visual processing, attention control, and stimulus interpretation and contextualization. Our results add a new dimension to our neurobiological understanding of emotion regulation by suggesting a potentially important role for altered intra- and inter-network connectivity. Moreover, this study highlights that connectomic PPI is a potentially valuable new tool in comprehensively investigating modulation of connectivity across task conditions.
Recent models emphasize the importance of interrelationships between large-scale networks in the neural underpinnings of human cognition (Bressler and Menon, 2010; Laird et al., 2011). Concurrently, models of emotion have emerged that deemphasize localization of emotions in discrete brain regions (Lindquist et al., 2012; Barrett and Satpute, 2013), and instead investigate affective phenomena from a distributed systems perspective (Barrett and Satpute, 2013; Kinnison et al., 2012). Based on these models, we applied a network perspective to understand reappraisal, an important volitional regulation strategy that has also been examined in a large number of fMRI activation studies (see Kalisch, 2009; Diekhof et al., 2011; Ochsner et al., 2012; Phan and Sripada, 2013 for reviews). We observed altered interconnections between multiple large-scale ICNs including visual, dorsal attention, frontoparietal, and default network, and discuss the importance of these findings for current models of emotion regulation individually below.
During reappraisal, we found increased connectivity between dorsal attention network and visual network, as well as increased connectivity within dorsal attention network. Dorsal attention network encompasses superior parietal cortex, posterior temporal regions, and superior frontal regions including the frontal eye fields (Yeo et al., 2011). This bilateral network has been implicated in voluntary regulation of visual attention in accordance with goals. Convergent evidence from fMRI (Corbetta and Shulman, 2002), lesion studies (Corbetta and Shulman, 2011), transcranial magnetic stimulation (Ruff et al., 2006; Driver et al., 2010), and effective connectivity analysis of neuroimaging data (in particular, dynamic causal modeling; Vossel et al., 2012) demonstrates that dorsal attention network is richly interconnected with visual network and modulates multiple aspects of visual processing. The dorsal attention network has been implicated in both spatial attention (orienting to specific regions of the visual field) as well as feature-based attention (attending to certain features in the visual field) (Egner et al., 2008). It is likely that both kinds of attention are critical in volitional emotion regulation, as conjectured by Ochsner and colleagues (2012 p.E14). For example, when presented with aversive pictures, it is possible that subjects may foveate on less aversive features of the scene, consistent with the results of previous studies that measured gaze fixation during emotion regulation (Xing and Isaacowitz, 2006; van Reekum et al., 2007). Alternatively, heightened intra-dorsal attention and dorsal attention-visual network connectivity may reflect modulation of visual properties of stimuli by higher-level information (Ochsner et al., 2012).
We also observed increased connectivity between frontopartietal network—which encompasses dorsal lateral prefrontal cortex (DLPFC) and lateral posterior parietal cortex—and visual network. It is noteworthy that frontopartietal network is closely linked with dorsal attention network, and the former is sometimes viewed as a component of the latter (Fox et al., 2005; Spreng et al., 2012). Frontoparietal regions such as DLPFC are engaged during cognitively demanding tasks that require maintaining information in working memory, and manipulation of information in accordance with task demands (Miller, 2000; Wager and Smith, 2003). In addition, primarily right lateralized regions of frontoparietal network, especially in posterior parietal cortex, have been postulated to play a key role in visual attention, while lesions in these regions are associated with spatial neglect (Corbetta and Shulman, 2011). Of note, we observed pronounced right lateralization of frontoparietal connections with visual network, especially in anterior regions of the network including DLPFC, which potentially might be explained in terms of contributions of this network to goal-directed control over visual attention.
Reappraisal was also found to significantly impact connectivity of default network; this network became more interconnected with visual network as well as dorsal attention network. Default network includes widely distributed regions in medial prefrontal cortex, posterior cingulate, inferior parietal cortex, and lateral temporal regions (Buckner et al., 2008; Yeo et al., 2011). This network is implicated in multiple processes relevant to emotion regulation. Default network plays a role in interpretation of incoming stimuli; it contextualizes stimuli by linking them with personally relevant information including autobiographical memories and images (Gusnard et al., 2001; Schacter and Addis, 2007). Closely linked to its interpretative function, default network supports a broad range of simulative functions that involve distancing oneself from the current situation and projecting one’s self into alternative, non-actual scenarios (Buckner and Carroll, 2007). The emotion regulation strategy of reappraisal, in particular, is likely to draw on default network functions as it involves reinterpreting the situation by creating an alternative personal meaning for the situation and volitionally ‘seeing’ the situation in light of this alternative meaning. While the patterns of activation of default network during tasks is well known, its task-specific patterns of connectivity are beginning to become the focus of greater interest (Spreng et al., 2010; Gao and Lin, 2012; Fornito et al., 2012). For example, Spreng and colleagues (2010) found that default network enhances its coupling with task control networks during an autobiographical planning task, but not in an externally-directed cognitively demanding task (the Tower of London task). The present study provides additional evidence of task demands (i.e., volitional regulation of emotion) driving altered connectivity of default network with other large-scale networks.
Compared to the Maintain condition, the Reappraise condition produced increased intra-visual connectivity. One interpretation of this finding is in terms of growing evidence that neuronal coherence within visual cortex is inversely associated with visual attention and salience. Thus states involving increased visual attention or salience of visual stimuli have been found to produce decreased intra-visual connectivity, for example eyes open (versus eyes closed) rest (McAvoy et al., 2012), strong visual stimulation (Nauhaus et al., 2009), and administration of pharmacological compounds that enhance alertness and attention, such as methylphenidate (Sripada et al., 2013) and physostigmine (Ricciardi et al., 2012). This hypothesis is also consistent with our finding that in the Neutral Look condition, in which participants simply looked at neutral pictures, there was significantly greater intra-visual connectivity than during the Maintain condition, in which participants are presented with aversive pictures. Of note, however, whereas the suprathreshold edges in the Neutral Look versus Maintain delta map were almost exclusively positive (97%), the suprathreshold edges in the Reappraise versus Maintain delta map were only preponderantly positive (67%), meaning many suprathreshold edges were reduced during reappraisal. This might be explained perhaps in terms of the fact that reappraisal involves altered interpretation of stimuli, and this plausibly requires not simply reducing attention or salience, but rather shifting it—deemphasizing certain perceptual features while emphasizing others (Ochsner et al., 2012). Thus while reappraisal achieves an overall decrease in visual attention/salience, it achieves this through enhancing attention to/salience of certain features within the visual scene, which might explain the more mixed pattern that reappraisal has on the directionality of changes in intra-visual connectivity.
Our finding of changes within and between large-scale networks during emotion regulation should be interpreted in light of an impressive corpus of research that has investigated emotion regulation from a cortical-subcortical perspective. In particular, previous fMRI studies have reliably found altered interconnections between subcortical regions, including amygdala and ventral striatum, and prefrontal regions including anterior cingulate, dorsomedial PFC, and lateral PFC (Wager and Smith, 2003; Urry et al., 2006; Banks et al., 2007; Kober et al., 2010). We replicated this pattern of results in the current study, showing that during reappraisal, amygdala and ventral striatum exhibit enhanced connectivity with these medial and lateral prefrontal regions (see Figure 5 and Table 2). Amygdala has been implicated in threat processing (LeDoux, 1998; Amaral, 2003) and in assigning salience to stimuli more broadly (Liberzon et al., 2003; Vuilleumier, 2005; Phelps, 2006). It has dense reciprocal interconnections with medial prefrontal regions (Ghashghaei et al., 2007) that modulate amygdala reactivity in light of current context and goals (Kim et al., 2011). Evidence from animal models (Quirk and Beer, 2006) and psychopathologies (Rauch et al., 2006; Etkin and Wager, 2007; Liberzon and Sripada, 2007) suggest that disruptions of connections between medial PFC and amygdala produces maladaptive and decontextualized amygdala responses. Ventral striatum in contrast is implicated in reward and positive affect (Delgado et al., 2000; O’Doherty, 2004). Wager and colleagues (2008) found evidence that lateral PFC regions up-regulate ventral striatal responding during successful emotion regulation. More broadly, it has been proposed that lateral prefrontal regions are relatively specialized for volitional regulation and provide inputs to medial regions, thereby indirectly affecting response profiles of subcortical emotion-relevant centers (Ochsner and Gross, 2005; Ochsner et al., 2012). Taken together, these findings regarding cortical-subcortical connectivity underscore that emotion regulation is a complex, multi-faceted process. In particular, it involves at least two categories of functional connectivity alterations: discrete alterations in cortical-subcortical links and distributed alterations in relationships between large-scale ICNs. While the functional significance of cortical-subcortical links has been clarified in previous research, changes in ICN configurations during tasks have been relatively less well studied (but see Spreng et al., 2010; Gao and Lin, 2012; Fornito et al., 2012). While we have offered conjectures regarding the functional significance of altered ICN relationships during emotion regulation in the preceding paragraphs, it is clear that substantial further investigation is required.
These two categories of connectivity alterations associated with emotion regulation—discrete cortical-subcortical changes and distributed ICN alterations—appear to be best investigated with distinct methods. CPPI and network contingency analysis examine changes at large populations of connections. They are thus well suited to capturing distributed connectivity changes in large-scale networks that can be sampled across hundreds of regions. In contrast, previous research as well as the present study find that small structures such as amygdala and striatum exhibit altered connectivity with relatively discrete prefrontal regions (Urry et al., 2006; Banks et al., 2007; Wager et al., 2008). These types of connectivity changes are better investigated with seed-based methods. That said, seed-based methods can also in some cases provide a very useful window into large-scale network alterations. In comparison to cPPI, though, the information they provide tends to be more limited. For example, we used a PCC seed to examine default network changes during emotion regulation. We found alterations in superior parietal cortex, located in dorsal attention network, as well as the posterior pole of occipital cortex, which is in visual network (Figure 5 and Table 2). This is consistent with our cPPI results that show altered connectivity between default network and both dorsal attention and visual networks. However, comparing the cPPI maps involving default network in Figure 3 with the PCC seed-based map in Figure 5C, it is clear that the cPPI maps provide more information. In particular, the PCC seed-based map fails to provide information regarding which regions of default network changed connectivity with these other networks (whereas Figure 3 shows these the implicated default network regions encompass ventral and dorsomedial PFC, lateral temporal, and lateral parietal regions). Moreover, the PCC seed-based map misses multiple important regions that changed their connectivity with default network, such as posterior inferior temporal regions in dorsal attention network and more anterior regions of visual cortex (i.e., regions in V2 and V3). Overall, connectomic PPI and seed-based connectivity are complementary methods. Each method provides useful, non-overlapping information into distinct aspects of the complex pattern of connectivity changes occurring during emotion regulation.
We used network contingency analysis to make statistical inferences about altered interrelationships between large-scale networks. This approach relies on a count statistic: For each pair of ICNs, the number of connections that are observed to exceed a statistical threshold are compared to the number expected by chance. An alternative approach is to compute mean connectivity between all pairs of ICNs. The count statistic we employed has several advantages relative to the mean-based approach. First, the count statistic operates by placing a threshold so that only strongly affected connections are counted. Since connections that are only weakly affected are much more likely to be noise, thresholding removes noise and enhances the ability to detect a difference. Second, count statistics are robust to certain specific kinds of deviations from normality assumptions. For example, if the condition of interest affects the population of connections by ramping up a subset of connections very strongly while leaving most connections largely unaffected (a neurobiologically and empirically plausible supposition), then the count statistic will have more power to detect this effect than the mean. The intuitive reason is that a statistic based on the count of suprathreshold edges preferentially focuses on this small population of highly affected connections, while the mean averages over the massive, mostly unaffected, population of connections. Third, the use of counts is already well established in graph theoretic analyses of connectivity. These analyses generate a connectivity matrix based on a fine-grained parcellation of the brain. A threshold is then standardly imposed, and then one of many available graph theoretic statistics is calculated (Sporns et al., 2004). One of the most popular graph theoretic statistics is thresholded global degree (e.g., Buckner et al., 2009), which is a count of the suprathreshold edges. Thus the use of counts in connectomic/graph theoretic analyses has been empirically validated in previous studies.
It is useful to interpret our connectivity findings in light of the results of our activation analysis contrasting activation in the Reappraise versus Maintain conditions (Figure 6 and Table 3). PPI measures connectivity changes between regions after covarying out the effect of the task manipulation. It is thus theoretically possible that regions that are co-activated by task can show any PPI relationship—positive, negative, or none. In addition to being theoretically independent, activation and connectivity have different functional interpretations. Very roughly, activation represents how much a region is working, while connectivity represents with whom a region is working, i.e., with which other regions the seed is sharing information (Bressler and Menon, 2010). Consistent with the possibility of independence between activity and connectivity, we found that visual cortex, which played a very prominent role in our connectivity results, did not exhibit statistically significant activation differences in the Reappraise versus Maintain condition. The reverse is true of superior parietal cortex and anterior regions of dorsomedial prefrontal cortex; these regions were strongly activated in the Reappraise (>Maintain) condition, but were largely not represented in our connectivity findings. Meanwhile, other regions exhibited statistically significant activations in the Reappraise (>Maintain) condition, and also exhibited increases in connectivity, in particular dorsolateral prefrontal cortex and superior temporal sulcus/temporal pole regions. In contrast, default network exhibited prominent increases in connectivity with visual cortex and dorsal attention network during reappraisal, but it did not increase its activity. Rather, it exhibited a trend towards deactivation during reappraisal (this could be observed only after lowering the statistical threshold to p<0.05). This study thus revealed a role for two networks—in particular visual cortex and default network—not often discussed in previous studies of emotion regulation. These networks don’t change their activation levels during emotion regulation, but they do exhibit substantial and distributed changes in their connectivity profiles—a fact revealed by our whole cortex connectomic approach.
This study has limitations and raises issues that invite further study. First, in the sample for this study, 15% were below the poverty line at the time of scanning and 50% were below the poverty line at age nine. We did include poverty covariates in all analyses, and we did not find an effect of childhood poverty on network connectivity patterns during emotion regulation. Nonetheless, the nature of the healthy control sample used in this study should be taken into account before making firm conclusions about more healthy control populations used in typical neuroimaging studies. On the other hand, given that one in four babies are now born into poverty in the US, more economically heterogeneous samples are important to include in neuroscientific investigations rather than the predominance of middle class college student or patient samples that currently make up the vast majority of neuroscientific samples. Second, PPI analysis is based on multiple regression and is ultimately a covariational technique; it cannot establish the direction of causality between functionally connected regions. Future studies should use complementary methods that can provide evidence about causality. Third, we studied emotion regulation exclusively in healthy individuals. It is increasingly recognized that aberrant interrelationships between large-scale networks exist in psychopathologies (Menon, 2011), including depression (Hamilton et al., 2011) and post-traumatic stress disorder (Sripada et al., 2012) that are characterized by deficits in emotion regulation. Future studies should use connectomic methods to investigate abnormal network interrelationships during emotion regulation in these conditions.
In summary, this is the first connectomic fMRI study of patterns of functional connectivity during emotion regulation. We found that voluntary regulation of emotion produces robust and distributed alterations in interrelationships between large-scale networks, adding a new network perspective to our understanding of the brain mechanisms of emotion regulation.
Supplementary Material
Highlights.
We examined effects of volitional emotion regulation on intrinsic connectivity networks
54 subjects, emotion regulation task with IAPS pictures, block design
Connectomic PPI used to generate connectomes for Reappraise versus Maintain
Reappraisal increases connectivity between visual, dorsal attention, and default networks
Acknowledgments
C.S.’s research was supported by NIH grant K23-AA-020297, Center for Computational Medicine Pilot Grant, and the John Templeton Foundation. G.E. was supported by National Institute on Minority Health and Health Disparities RC2MD004767, W.T. Grant Foundation, and the John D. and Catherine T. Mac Arthur Foundation Network for Socioeconomic Status and Health. J.E.S. was supported by National Institute on Minority Health and Health Disparities RC2MD004767 and the Robert Wood Johnson Health and Society Scholar Award.
Footnotes
Conflicts of Interest: The authors declare no competing financial interests.
Publisher's Disclaimer: This is a PDF file of an unedited manuscript that has been accepted for publication. As a service to our customers we are providing this early version of the manuscript. The manuscript will undergo copyediting, typesetting, and review of the resulting proof before it is published in its final citable form. Please note that during the production process errors may be discovered which could affect the content, and all legal disclaimers that apply to the journal pertain.
References
- Amaral DG. The amygdala, social behavior, and danger detection. Ann N Y Acad Sci. 2003;1000:337–347. doi: 10.1196/annals.1280.015. [DOI] [PubMed] [Google Scholar]
- Banks SJ, Eddy KT, Angstadt M, Nathan PJ, Phan KL. Amygdala-frontal connectivity during emotion regulation. Soc Cogn Affect Neurosci. 2007;2:303–312. doi: 10.1093/scan/nsm029. [DOI] [PMC free article] [PubMed] [Google Scholar]
- Barrett LF, Satpute AB. Large-scale brain networks in affective and social neuroscience: towards an integrative functional architecture of the brain. Current Opinion in Neurobiology. 2013;23:361–372. doi: 10.1016/j.conb.2012.12.012. [DOI] [PMC free article] [PubMed] [Google Scholar]
- Benjamini Y, Hochberg Y. Controlling the False Discovery Rate: A Practical and Powerful Approach to Multiple Testing. Journal of the Royal Statistical Society Series B (Methodological) 1995;57:289–300. [Google Scholar]
- Bradley M, Lang P. Handbook of Emotion Elicitation and Assessment. Oxford University Press; 2007. [Google Scholar]
- Bressler SL, Menon V. Large-scale brain networks in cognition: emerging methods and principles. Trends Cogn Sci (Regul Ed) 2010;14:277–290. doi: 10.1016/j.tics.2010.04.004. [DOI] [PubMed] [Google Scholar]
- Buckner RL, Andrews-Hanna JR, Schacter DL. The Brain’s Default Network. Annals of the New York Academy of Sciences. 2008;1124:1–38. doi: 10.1196/annals.1440.011. [DOI] [PubMed] [Google Scholar]
- Buckner RL, Carroll DC. Self-projection and the brain. Trends in Cognitive Sciences. 2007;11:49–57. doi: 10.1016/j.tics.2006.11.004. [DOI] [PubMed] [Google Scholar]
- Buckner RL, Sepulcre J, Talukdar T, Krienen FM, Liu H, Hedden T, Andrews-Hanna JR, Sperling RA, Johnson KA. Cortical hubs revealed by intrinsic functional connectivity: mapping, assessment of stability, and relation to Alzheimer’s disease. J Neurosci. 2009;29:1860–1873. doi: 10.1523/JNEUROSCI.5062-08.2009. [DOI] [PMC free article] [PubMed] [Google Scholar]
- Corbetta M, Shulman GL. Control of goal-directed and stimulus-driven attention in the brain. Nat Rev Neurosci. 2002;3:201–215. doi: 10.1038/nrn755. [DOI] [PubMed] [Google Scholar]
- Corbetta M, Shulman GL. Spatial neglect and attention networks. Annu Rev Neurosci. 2011;34:569–599. doi: 10.1146/annurev-neuro-061010-113731. [DOI] [PMC free article] [PubMed] [Google Scholar]
- Delgado MR, Nystrom LE, Fissell C, Noll DC, Fiez JA. Tracking the Hemodynamic Responses to Reward and Punishment in the Striatum. J Neurophysiol. 2000;84:3072–3077. doi: 10.1152/jn.2000.84.6.3072. [DOI] [PubMed] [Google Scholar]
- Di Martino A, Zuo X-N, Kelly C, Grzadzinski R, Mennes M, Schvarcz A, Rodman J, Lord C, Castellanos FX, Milham MP. Shared and Distinct Intrinsic Functional Network Centrality in Autism and Attention-Deficit/Hyperactivity Disorder. [Accessed April 9, 2013];Biological Psychiatry. 2013 doi: 10.1016/j.biopsych.2013.02.011. Available at: http://www.sciencedirect.com/science/article/pii/S0006322313001765. [DOI] [PMC free article] [PubMed]
- Diekhof EK, Geier K, Falkai P, Gruber O. Fear is only as deep as the mind allows: a coordinate-based meta-analysis of neuroimaging studies on the regulation of negative affect. Neuroimage. 2011;58:275–285. doi: 10.1016/j.neuroimage.2011.05.073. [DOI] [PubMed] [Google Scholar]
- Driver J, Blankenburg F, Bestmann S, Ruff CC. New approaches to the study of human brain networks underlying spatial attention and related processes. Exp Brain Res. 2010;206:153–162. doi: 10.1007/s00221-010-2205-7. [DOI] [PMC free article] [PubMed] [Google Scholar]
- Egner T, Monti JMP, Trittschuh EH, Wieneke CA, Hirsch J, Mesulam M-M. Neural integration of top-down spatial and feature-based information in visual search. J Neurosci. 2008;28:6141–6151. doi: 10.1523/JNEUROSCI.1262-08.2008. [DOI] [PMC free article] [PubMed] [Google Scholar]
- Eryilmaz H, Van De Ville D, Schwartz S, Vuilleumier P. Impact of transient emotions on functional connectivity during subsequent resting state: A wavelet correlation approach. NeuroImage. 2011;54:2481–2491. doi: 10.1016/j.neuroimage.2010.10.021. [DOI] [PubMed] [Google Scholar]
- Etkin MD, Wager PD. Functional Neuroimaging of Anxiety: A Meta-Analysis of Emotional Processing in PTSD, Social Anxiety Disorder, and Specific Phobia. Am J Psychiatry. 2007;164:1476–1488. doi: 10.1176/appi.ajp.2007.07030504. [DOI] [PMC free article] [PubMed] [Google Scholar]
- Evans GW. A multimethodological analysis of cumulative risk and allostatic load among rural children. Developmental Psychology. 2003;39:924–933. doi: 10.1037/0012-1649.39.5.924. [DOI] [PubMed] [Google Scholar]
- Fornito A, Harrison BJ, Zalesky A, Simons JS. Competitive and cooperative dynamics of large-scale brain functional networks supporting recollection. Proc Natl Acad Sci USA. 2012;109:12788–12793. doi: 10.1073/pnas.1204185109. [DOI] [PMC free article] [PubMed] [Google Scholar]
- Fox MD, Snyder AZ, Vincent JL, Corbetta M, Van Essen DC, Raichle ME. The human brain is intrinsically organized into dynamic, anticorrelated functional networks. Proc Natl Acad Sci U S A. 2005;102:9673–9678. doi: 10.1073/pnas.0504136102. [DOI] [PMC free article] [PubMed] [Google Scholar]
- Fransson P. How default is the default mode of brain function?: Further evidence from intrinsic BOLD signal fluctuations. Neuropsychologia. 2006;44:2836–2845. doi: 10.1016/j.neuropsychologia.2006.06.017. [DOI] [PubMed] [Google Scholar]
- Freedman D, Lane D. A Nonstochastic Interpretation of Reported Significance Levels. Journal of Business & Economic Statistics. 1983;1:292–298. [Google Scholar]
- Friston K, Buechel C, Fink G, Morris J, Rolls E, Dolan R. Psychophysiological and Modulatory Interactions in Neuroimaging. NeuroImage. 1997;6:218–229. doi: 10.1006/nimg.1997.0291. [DOI] [PubMed] [Google Scholar]
- Gao W, Lin W. Frontal parietal control network regulates the anti-correlated default and dorsal attention networks. Hum Brain Mapp. 2012;33:192–202. doi: 10.1002/hbm.21204. [DOI] [PMC free article] [PubMed] [Google Scholar]
- Ghashghaei HT, Hilgetag CC, Barbas H. Sequence of information processing for emotions based on the anatomic dialogue between prefrontal cortex and amygdala. Neuroimage. 2007;34:905–923. doi: 10.1016/j.neuroimage.2006.09.046. [DOI] [PMC free article] [PubMed] [Google Scholar]
- Good P. Permutation Tests: A Practical Guide to Resampling Methods for Testing Hypotheses. 2. Springer; 2000. [Google Scholar]
- Greicius MD, Krasnow B, Reiss AL, Menon V. Functional connectivity in the resting brain: a network analysis of the default mode hypothesis. Proc Natl Acad Sci USA. 2003;100:253–258. doi: 10.1073/pnas.0135058100. [DOI] [PMC free article] [PubMed] [Google Scholar]
- Gross JJ. Antecedent- and response-focused emotion regulation: divergent consequences for experience, expression, and physiology. J Pers Soc Psychol. 1998;74:224–237. doi: 10.1037//0022-3514.74.1.224. [DOI] [PubMed] [Google Scholar]
- Gross JJ. Emotion regulation: Past, present, future. Cognition and Emotion. 1999;13:551–573. [Google Scholar]
- Gross JJ, Thompson RA. Handbook of emotion regulation. New York, NY: Guilford Press; 2007. Emotion regulation: Conceptual foundations; pp. 3–24. [Google Scholar]
- Gusnard DA, Akbudak E, Shulman GL, Raichle ME. Medial prefrontal cortex and self-referential mental activity: Relation to a default mode of brain function. PNAS. 2001;98:4259–4264. doi: 10.1073/pnas.071043098. [DOI] [PMC free article] [PubMed] [Google Scholar]
- Hamilton JP, Furman DJ, Chang C, Thomason ME, Dennis E, Gotlib IH. Default-Mode and Task-Positive Network Activity in Major Depressive Disorder: Implications for Adaptive and Maladaptive Rumination. Biological Psychiatry. 2011;70:327–333. doi: 10.1016/j.biopsych.2011.02.003. [DOI] [PMC free article] [PubMed] [Google Scholar]
- Harrison BJ, Pujol J, Ortiz H, Fornito A, Pantelis C, Yücel M. Modulation of Brain Resting-State Networks by Sad Mood Induction. PLoS ONE. 2008;3:e1794. doi: 10.1371/journal.pone.0001794. [DOI] [PMC free article] [PubMed] [Google Scholar]
- Kalisch R. The functional neuroanatomy of reappraisal: time matters. Neurosci Biobehav Rev. 2009;33:1215–1226. doi: 10.1016/j.neubiorev.2009.06.003. [DOI] [PubMed] [Google Scholar]
- Kim MJ, Loucks RA, Palmer AL, Brown AC, Solomon KM, Marchante AN, Whalen PJ. The structural and functional connectivity of the amygdala: From normal emotion to pathological anxiety. Behav Brain Res. 2011;223:403–410. doi: 10.1016/j.bbr.2011.04.025. [DOI] [PMC free article] [PubMed] [Google Scholar]
- Kinnison J, Padmala S, Choi J-M, Pessoa L. Network Analysis Reveals Increased Integration during Emotional and Motivational Processing. J Neurosci. 2012;32:8361–8372. doi: 10.1523/JNEUROSCI.0821-12.2012. [DOI] [PMC free article] [PubMed] [Google Scholar]
- Kober H, Mende-Siedlecki P, Kross EF, Weber J, Mischel W, Hart CL, Ochsner KN. Prefrontal–striatal pathway underlies cognitive regulation of craving. PNAS. 2010;107:14811–14816. doi: 10.1073/pnas.1007779107. [DOI] [PMC free article] [PubMed] [Google Scholar]
- Laird AR, Fox PM, Eickhoff SB, Turner JA, Ray KL, McKay DR, Glahn DC, Beckmann CF, Smith SM, Fox PT. Behavioral interpretations of intrinsic connectivity networks. J Cogn Neurosci. 2011;23:4022–4037. doi: 10.1162/jocn_a_00077. [DOI] [PMC free article] [PubMed] [Google Scholar]
- Lang PJ, Greenwald MK, Bradley MM, Hamm AO. Looking at pictures: Affective, facial, visceral, and behavioral reactions. Psychophysiology. 1993;30:261–273. doi: 10.1111/j.1469-8986.1993.tb03352.x. [DOI] [PubMed] [Google Scholar]
- LeDoux J. Fear and the brain: where have we been, and where are we going? Biol Psychiatry. 1998;44:1229–1238. doi: 10.1016/s0006-3223(98)00282-0. [DOI] [PubMed] [Google Scholar]
- Liberzon I, Phan Luan K, Decker Laura R, Taylor Stephan F. Extended Amygdala and Emotional Salience: A PET Activation Study of Positive and Negative Affect. Neuropsychopharmacology. 2003;28:726–733. doi: 10.1038/sj.npp.1300113. [DOI] [PubMed] [Google Scholar]
- Liberzon I, Sripada CS. The functional neuroanatomy of PTSD: a critical review. Progress in Brain Research. In: Ronald E, De Kloet MSO, EV, editors. Stress Hormones and Post Traumatic Stress Disorder Basic Studies and Clinical Perspectives. Elsevier; 2007. [Accessed October 4, 2013]. pp. 151–169. Available at: http://www.sciencedirect.com/science/article/pii/S0079612307670113. [DOI] [PubMed] [Google Scholar]
- Lindquist KA, Wager TD, Kober H, Bliss-Moreau E, Barrett LF. The brain basis of emotion: A meta-analytic review. Behavioral and Brain Sciences. 2012;35:121–143. doi: 10.1017/S0140525X11000446. [DOI] [PMC free article] [PubMed] [Google Scholar]
- McAvoy M, Larson-Prior L, Ludwikow M, Zhang D, Snyder AZ, Gusnard DL, Raichle ME, d’Avossa G. Dissociated mean and functional connectivity BOLD signals in visual cortex during eyes closed and fixation. [[Accessed September 11, 2012].];J Neurophysiol. 2012 doi: 10.1152/jn.00900.2011. Available at: http://www.ncbi.nlm.nih.gov/pubmed/22875902. [DOI] [PMC free article] [PubMed]
- McLaren DG, Ries ML, Xu G, Johnson SC. A generalized form of context-dependent psychophysiological interactions (gPPI): A comparison to standard approaches. NeuroImage. 2012;61:1277–1286. doi: 10.1016/j.neuroimage.2012.03.068. [DOI] [PMC free article] [PubMed] [Google Scholar]
- Menon V. Large-scale brain networks and psychopathology: a unifying triple network model. Trends Cogn Sci (Regul Ed) 2011;15:483–506. doi: 10.1016/j.tics.2011.08.003. [DOI] [PubMed] [Google Scholar]
- Miller E. The prefrontal cortex and cognitive control. Nature reviews Neuroscience. 2000;1:59–65. doi: 10.1038/35036228. [DOI] [PubMed] [Google Scholar]
- Nauhaus I, Busse L, Carandini M, Ringach DL. Stimulus contrast modulates functional connectivity in visual cortex. Nat Neurosci. 2009;12:70–76. doi: 10.1038/nn.2232. [DOI] [PMC free article] [PubMed] [Google Scholar]
- O’Doherty JP. Reward representations and reward-related learning in the human brain: insights from neuroimaging. Curr Opin Neurobiol. 2004;14:769–776. doi: 10.1016/j.conb.2004.10.016. [DOI] [PubMed] [Google Scholar]
- Ochsner K, Silvers J, Buhle J. Functional imaging studies of emotion regulation: a synthetic review and evolving model of the cognitive control of emotion. Ann N Y Acad Sci. 2012;1251:E1–24. doi: 10.1111/j.1749-6632.2012.06751.x. [DOI] [PMC free article] [PubMed] [Google Scholar]
- Ochsner KN, Bunge SA, Gross JJ, Gabrieli JD. Rethinking feelings: an FMRI study of the cognitive regulation of emotion. J Cogn Neurosci. 2002;14:1215–1229. doi: 10.1162/089892902760807212. [DOI] [PubMed] [Google Scholar]
- Ochsner KN, Gross JJ. The cognitive control of emotion. Trends Cogn Sci. 2005;9:242–249. doi: 10.1016/j.tics.2005.03.010. [DOI] [PubMed] [Google Scholar]
- Phan KL, Fitzgerald DA, Nathan PJ, Moore GJ, Uhde TW, Tancer ME. Neural substrates for voluntary suppression of negative affect: A functional magnetic resonance imaging study. Biological Psychiatry. 2005;57:210–219. doi: 10.1016/j.biopsych.2004.10.030. [DOI] [PubMed] [Google Scholar]
- Phan KL, Sripada CS. Handbook of Human Affective Neuroscience. Cambridge, UK: Cambridge University Press; 2013. Emotion Regulation; pp. 375–400. [Google Scholar]
- Phelps EA. Emotion and Cognition: Insights from Studies of the Human Amygdala. Annual Review of Psychology. 2006;57:27–53. doi: 10.1146/annurev.psych.56.091103.070234. [DOI] [PubMed] [Google Scholar]
- Quirk GJ, Beer JS. Prefrontal involvement in the regulation of emotion: convergence of rat and human studies. Current Opinion in Neurobiology. 2006;16:723–727. doi: 10.1016/j.conb.2006.07.004. [DOI] [PubMed] [Google Scholar]
- Rauch SL, Shin LM, Phelps EA. Neurocircuitry Models of Posttraumatic Stress Disorder and Extinction: Human Neuroimaging Research—Past, Present, and Future. Biological Psychiatry. 2006;60:376–382. doi: 10.1016/j.biopsych.2006.06.004. [DOI] [PubMed] [Google Scholar]
- Raz G, Jacob Y, Gonen T, Winetraub Y, Soreq E, Flash T, Hendler T. Cry for her or cry with her: Context-dependent dissociation of two modes of cinematic empathy reflected in network cohesion dynamics. [[Accessed June 9, 2013].];Soc Cogn Affect Neurosci. 2013 doi: 10.1093/scan/nst052. Available at: http://scan.oxfordjournals.org.proxy.lib.umich.edu/content/early/2013/04/23/scan.nst052. [DOI] [PMC free article] [PubMed]
- Ricciardi E, Handjaras G, Bernardi G, Pietrini P, Furey ML. Cholinergic enhancement reduces functional connectivity and BOLD variability in visual extrastriate cortex during selective attention. [[Accessed September 11, 2012].];Neuropharmacology. 2012 doi: 10.1016/j.neuropharm.2012.07.003. Available at: http://www.ncbi.nlm.nih.gov/pubmed/22906685. [DOI] [PMC free article] [PubMed]
- Ruff CC, Blankenburg F, Bjoertomt O, Bestmann S, Freeman E, Haynes J-D, Rees G, Josephs O, Deichmann R, Driver J. Concurrent TMS-fMRI and psychophysics reveal frontal influences on human retinotopic visual cortex. Curr Biol. 2006;16:1479–1488. doi: 10.1016/j.cub.2006.06.057. [DOI] [PubMed] [Google Scholar]
- Schacter DL, Addis DR. The cognitive neuroscience of constructive memory: remembering the past and imagining the future. Phil Trans R Soc B. 2007;362:773–786. doi: 10.1098/rstb.2007.2087. [DOI] [PMC free article] [PubMed] [Google Scholar]
- Seeley WW, Menon V, Schatzberg AF, Keller J, Glover GH, Kenna H, Reiss AL, Greicius MD. Dissociable intrinsic connectivity networks for salience processing and executive control. J Neurosci. 2007;27:2349–2356. doi: 10.1523/JNEUROSCI.5587-06.2007. [DOI] [PMC free article] [PubMed] [Google Scholar]
- Smith SM, Fox PT, Miller KL, Glahn DC, Fox PM, Mackay CE, Filippini N, Watkins KE, Toro R, Laird AR, Beckmann CF. Correspondence of the brain’s functional architecture during activation and rest. PNAS. 2009;106:13040–13045. doi: 10.1073/pnas.0905267106. [DOI] [PMC free article] [PubMed] [Google Scholar]
- Sporns O, Chialvo DR, Kaiser M, Hilgetag CC. Organization, development and function of complex brain networks. Trends Cogn Sci (Regul Ed) 2004;8:418–425. doi: 10.1016/j.tics.2004.07.008. [DOI] [PubMed] [Google Scholar]
- Spreng RN, Sepulcre J, Turner GR, Stevens WD, Schacter DL. Intrinsic Architecture Underlying the Relations among the Default, Dorsal Attention, and Frontoparietal Control Networks of the Human Brain. Journal of Cognitive Neuroscience. 2012;25:74–86. doi: 10.1162/jocn_a_00281. [DOI] [PMC free article] [PubMed] [Google Scholar]
- Spreng RN, Stevens WD, Chamberlain JP, Gilmore AW, Schacter DL. Default network activity, coupled with the frontoparietal control network, supports goal-directed cognition. NeuroImage. 2010;53:303–317. doi: 10.1016/j.neuroimage.2010.06.016. [DOI] [PMC free article] [PubMed] [Google Scholar]
- Sripada C, Kessler D, Welsh R, Angstadt M, Liberzon I, Phan KL, Scott C. Distributed effects of methylphenidate on the network structure of the resting brain: a pattern classification analysis. NeuroImage. 2013 doi: 10.1016/j.neuroimage.2013.05.016. [DOI] [PMC free article] [PubMed] [Google Scholar]
- Sripada RK, King AP, Welsh RC, Garfinkel SN, Wang X, Sripada C, Liberzon I. Neural Dysregulation in Posttraumatic Stress Disorder: Evidence for Disrupted Equilibrium Between Salience and Default Mode Brain Networks. Psychosom Med. 2012;74:904–911. doi: 10.1097/PSY.0b013e318273bf33. [DOI] [PMC free article] [PubMed] [Google Scholar]
- Tzourio-Mazoyer N, Landeau B, Papathanassiou D, Crivello F, Etard O, Delcroix N, Mazoyer B, Joliot M. Automated anatomical labeling of activations in SPM using a macroscopic anatomical parcellation of the MNI MRI single-subject brain. Neuroimage. 2002;15:273–289. doi: 10.1006/nimg.2001.0978. [DOI] [PubMed] [Google Scholar]
- Urry HL, van Reekum CM, Johnstone T, Kalin NH, Thurow ME, Schaefer HS, Jackson CA, Frye CJ, Greischar LL, Alexander AL, Davidson RJ. Amygdala and ventromedial prefrontal cortex are inversely coupled during regulation of negative affect and predict the diurnal pattern of cortisol secretion among older adults. J Neurosci. 2006;26:4415–4425. doi: 10.1523/JNEUROSCI.3215-05.2006. [DOI] [PMC free article] [PubMed] [Google Scholar]
- Van Dijk KRA, Hedden T, Venkataraman A, Evans KC, Lazar SW, Buckner RL. Intrinsic functional connectivity as a tool for human connectomics: theory, properties, and optimization. J Neurophysiol. 2010;103:297–321. doi: 10.1152/jn.00783.2009. [DOI] [PMC free article] [PubMed] [Google Scholar]
- Van Reekum CM, Johnstone T, Urry HL, Thurow ME, Schaefer HS, Alexander AL, Davidson RJ. Gaze fixations predict brain activation during the voluntary regulation of picture-induced negative affect. NeuroImage. 2007;36:1041–1055. doi: 10.1016/j.neuroimage.2007.03.052. [DOI] [PubMed] [Google Scholar]
- Vossel S, Weidner R, Driver J, Friston KJ, Fink GR. Deconstructing the architecture of dorsal and ventral attention systems with dynamic causal modeling. J Neurosci. 2012;32:10637–10648. doi: 10.1523/JNEUROSCI.0414-12.2012. [DOI] [PMC free article] [PubMed] [Google Scholar]
- Vuilleumier P. How brains beware: neural mechanisms of emotional attention. Trends in Cognitive Sciences. 2005;9:585–594. doi: 10.1016/j.tics.2005.10.011. [DOI] [PubMed] [Google Scholar]
- Wager TD, Davidson ML, Hughes BL, Lindquist MA, Ochsner KN. Prefrontal-subcortical pathways mediating successful emotion regulation. Neuron. 2008;59:1037–1050. doi: 10.1016/j.neuron.2008.09.006. [DOI] [PMC free article] [PubMed] [Google Scholar]
- Wager TD, Smith EE. Neuroimaging studies of working memory: a meta-analysis. Cogn Affect Behav Neurosci. 2003;3:255–274. doi: 10.3758/cabn.3.4.255. [DOI] [PubMed] [Google Scholar]
- Xia M, Wang J, He Y. BrainNet Viewer: A Network Visualization Tool for Human Brain Connectomics. PLoS ONE. 2013;8:e68910. doi: 10.1371/journal.pone.0068910. [DOI] [PMC free article] [PubMed] [Google Scholar]
- Xing C, Isaacowitz DM. Aiming at Happiness: How Motivation Affects Attention to and Memory for Emotional Images. Motiv Emot. 2006;30:243–250. [Google Scholar]
- Yeo BTT, Krienen FM, Sepulcre J, Sabuncu MR, Lashkari D, Hollinshead M, Roffman JL, Smoller JW, Zöllei L, Polimeni JR, Fischl B, Liu H, Buckner RL. The organization of the human cerebral cortex estimated by intrinsic functional connectivity. J Neurophysiol. 2011;106:1125–1165. doi: 10.1152/jn.00338.2011. [DOI] [PMC free article] [PubMed] [Google Scholar]
Associated Data
This section collects any data citations, data availability statements, or supplementary materials included in this article.